Endocrinol Metab 2015;30:216-220
http://dx.doi.org/10.3803/EnM.2015.30.2.216 pISSN 2093-596X · eISSN 2093-5978
Brief Report
Glucagon-Like Peptide-1 Increases Mitochondrial
Biogenesis and Function in INS-1 Rat Insulinoma Cells
Mi Yeon Kang*, Tae Jung Oh, Young Min Cho
Department of Internal Medicine, Seoul National University College of Medicine, Seoul, Korea
Glucagon-like peptide-1 (GLP-1) is a gut-derived incretin hormone that increases glucose-stimulated insulin secretion in pancre- atic β-cells. Since mitochondrial function is crucial to insulin secretion, we hypothesized that GLP-1 may increase mitochondrial biogenesis in pancreatic β-cells. We treated INS-1 rat insulinoma cells with GLP-1 or exendin-4 for 48 hours and measured mito- chondrial mass and function. Both GLP-1 and exendin-4 increased mitochondrial mass by approximately 20%. The mitochon- dria/cytosol ratio was increased from 7.60±3.12% to 10.53±2.70% by exendin-4. In addition, GLP-1 increased the mitochondri- al membrane potential and oxygen consumption. Proliferator-activated receptor-gamma coactivator 1α expression was increased approximately 2-fold by GLP-1 treatment. In conclusion, the present study presents evidence for a new mechanism of action by which GLP-1 improves pancreatic β-cell function via enhanced mitochondrial mass and performance.
Keywords: Glucagon-like peptide-1; Mitochondria; Diabetes mellitus; Beta cell; Insulin
INTRODUCTION
Mitochondrial dysfunction causes both insulin resistance and β-cell dysfunction, leading to glucose intolerance and diabetes [1,2]. In skeletal muscle, decreased mitochondrial fatty acid oxidation results in increased amounts of cytosolic long-chain acyl CoA and diacylglycerol, which leads to increased serine phosphorylation of insulin receptor substrate-1, thereby elicit- ing insulin resistance [3]. In pancreatic β-cells, decreased ATP generation due to impaired mitochondrial oxidative phosphor- ylation is linked to impaired insulin secretion, via a mecha- nism that reduces closure of the ATP-sensitive potassium channel [4]. In this regard, measures to improve mitochondrial
function, either in the skeletal muscle or in the pancreatic β-cell, should be effective for treating diabetes.
Glucagon-like peptide-1 (GLP-1) is a gut-derived incretin hormone that stimulates insulin secretion and suppresses glu- cagon secretion, inhibits gastric emptying, and reduces appe- tite and food intake [5,6]. Because of its efficacy in lowering blood glucose by stimulating β-cell insulin secretion, GLP-1 analogues and incretin enhancers (i.e., dipeptidyl peptidase-4 inhibitors) are widely used in the clinic to treat diabetes [7].
Interestingly, it was reported that GLP-1 stimulates ATP syn- thesis in pancreatic MIN6 β-cells [8], suggesting a new mech- anism for improving β-cell function using GLP-1 therapy. In this study, we examined the effect of GLP-1 and its analogue
Received: 14 July 2014, Revised: 27 August 2014, Accepted: 29 August 2014
Corresponding author: Young Min Cho
Department of Internal Medicine, Seoul National University College of Medicine, 101 Daehak-ro, Jongno-gu, Seoul 110-744, Korea
Tel: +82-2-2072-1965, Fax: +82-2-762-9662, E-mail: [email protected]
*Current affiliation: Department of Internal Medicine, St. Carollo Hospital, 221 Sunkwang-ro, Suncheon, Korea
Copyright © 2015 Korean Endocrine Society
This is an Open Access article distributed under the terms of the Creative Com- mons Attribution Non-Commercial License (http://creativecommons.org/
licenses/by-nc/3.0/) which permits unrestricted non-commercial use, distribu- tion, and reproduction in any medium, provided the original work is properly cited.
on mitochondrial biogenesis in pancreatic β-cells.
METHODS
INS-1 cell culture and glucose-stimulated insulin secretion INS-1 rat insulinoma cells (passages 28 to 34) were grown in monolayer culture in RPMI-1640 supplemented with 10% fe- tal bovine serum, 10 mM 4-(2-hydroxyethyl)-1-pipera- zineethanesulfonic acid, 2 mM L-glutamine, 1 mM sodium pyruvate, 50 μM β-mercaptoethanol, 100 U/mL penicillin, and 100 μg/mL streptomycin, at 37˚C in a humidified atmosphere of 5% CO2 and 95% air. For glucose-stimulated insulin secre- tion, INS-1 cells were seeded in 24-well plates and treated with 0, 100, or 200 nM GLP-1 (Sigma-Aldrich, St. Louis, MO, USA) for 48 hours. Cells were then washed twice with Kreb’s ringer bicarbonate buffer (KRBB), incubated in KRBB at 37˚C for 1 hour, and exposed to 5 or 10 mM glucose for 1 hour. The culture supernatant was collected and stored at –20˚C until as- sayed for insulin concentration using enzyme-linked immuno- sorbent assay (ELISA, Linco Research, St. Charles, MO, USA).
Measurement of mitochondrial mass and membrane potential
INS-1 cells (1×10⁵) were seeded in six-well plates and incubat- ed with GLP-1 (100 to 400 nM) or exendin-4 (100 to 200 nM, Sigma-Aldrich) for 48 hours. Mitochondrial mass was mea- sured by 10-n-nonyl-acridine orange staining (NAO, Invitro- gen, Carlsbad, CA, USA), and the mitochondrial membrane potential was measured using tetramethylrhodamine ethyl ester perchlorate (TMRE, Invitrogen) with a FACSCalibur flow cy- tometer (Becton Dickinson, Franklin Lakes, NJ, USA), follow- ing the manufacturers’ protocols. The strength of NAO or TMRE staining was expressed as the mean fluorescence inten- sity (MFI).
Transmission electron microscopy
INS-1 cells (5×10⁵) were seeded in 60-mm plates and incubated with exendin-4 for 48 hours. Cells were collected and processed for electron microscopy using standard methods. Ten random pic- tures were taken at a magnification of ×5,000, using an H-7100 transmission electron microscope (Hitachi, Tokyo, Japan). The volume density of mitochondria was estimated using a point- counting method in a blinded fashion by two separate examiners.
For each set of 10 pictures, the average volume density was cal- culated, and the mean of 10 values was used to estimate the vol-
ume density for each individual cell.
Measurement of oxygen consumption
Oxygen consumption was measured using a high-resolution respirometer (Oxygraph-2k, Oroboros Instruments, Innsbruck, Austria) according to the manufacturer’s instructions. A sus- pension of INS-1 cells at 1×10⁶ cells/mL in a 2-mL volume of culture medium (RPMI-1640) was measured in the respirome- ter at 37˚C.
Reverse transcriptase polymerase chain reaction
Total RNA from cells was prepared using an RNeasy Mini kit (Qiagen, Valencia, CA, USA). cDNA was obtained from 1 μg RNA using random hexamers and avian myeloblastosis virus reverse transcriptase (Invitrogen). Samples were amplified in a Gene Amp polymerase chain reaction (PCR) system 9600 (Perkin-Elmer/Cetus, Norwalk, CT, USA). Digital images of the PCR products separated on 1% agarose gels were ana- lyzed using a Gel Doc 2000 (BioRad Inc., Richmond, CA, USA).
Statistical analysis
Data are presented as means±SD. Nonparametric methods, including Kruskal-Wallis tests, Wilcoxon signed-rank tests, and Mann-Whitney tests, were used to evaluate statistical sig- nificance. Values for P<0.05 were considered significant.
RESULTS
Effects of GLP-1 and its analogue on insulin secretion and mitochondrial biogenesis in INS-1 cells
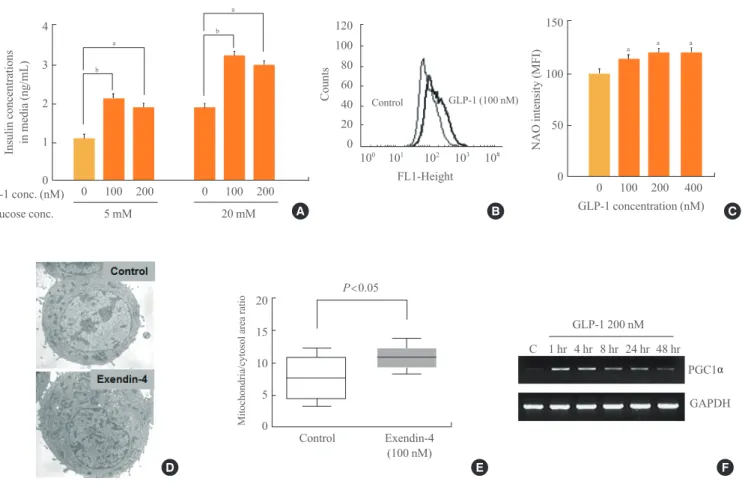
GLP-1 treatment of INS-1 cells for 48 hours enhanced glucose- stimulated insulin secretion (Fig. 1A) and mitochondrial mass (Fig. 1B, C). GLP-1 at 100, 200, and 400 nM increased NAO staining intensity to 121.64±11.54, 127.48±15.47, and 126.94±12.89 MFI, respectively (n=10) (Fig. 1C). A similar result was obtained using another mitochondrial dye (MitoTracker Green, data not shown). When mitochondrial density was measured using a point-counting method on transmission electron microscopy im- ages, the mitochondria/cytosol area ratio was significantly in- creased by 100 nM exendin-4, from 7.60±3.12% to 10.53±
2.70% (Fig. 1D, E). The expression of proliferator-activated re- ceptor-gamma coactivator 1 α (PGC1α), a key regulator of mito- chondrial biogenesis, was increased dramatically after 1 hour of GLP-1 treatment; after 4 hours, expression decreased gradually but remained above control levels for up to 48 hours of treatment
C
80 60 40 20 0 Oxygen consumption rate (μmol/sec/105 cells)
a
Control
B GLP-1
(100 nM) 180
160 140 120 100 80 60 40 20 0
TMRE intenslty (MFI)
b b
b
100 200
Control
A Exendin-4
(100 nM) GLP-1 concentration
(nM)
Fig. 2. Glucagon-like peptide-1 (GLP-1) increases mitochondria membrane potential (A, n=6) and cellular oxygen consumption rate (B, n=4). TMRE, tetramethylrhodamine ethyl ester perchlorate; MFI, mean fluorescence intensity. aP<0.05; bP<0.01 compared with con- trol.
20 15 10 5 Mitochondria/cytosol area ratio 0
Control P<0.05
Exendin-4 (100 nM)
GLP-1 200 nM
PGC1α GAPDH C 1 hr 4 hr 8 hr 24 hr 48 hr 4
3 2 1
GLP-1 conc. (nM)0 Glucose conc.
Insulin concentrations in media (ng/mL)
0 0
a
a
b
b
100 200 100
5 mM 20 mM
200 A
150 100 50 0
NAO intensity (MFI)
GLP-1 concentration (nM) 0 100 200 400
a a a
D E F
Fig. 1. Effects of glucagon-like peptide-1 (GLP-1) or exendin-4 on insulin secretion (A, n=6), mitochondrial mass (C, n=10), mitochon- drial density (E, n=10), and proliferator-activated receptor-gamma coactivator 1 α (PGC1α) expression (F) in INS-1 cells. (B) A repre- sentative fluorescence activated cell sorting analysis for 10-n-nonyl-acridine orange staining (NAO) intensity, as summarized in (C). (D) Representative transmission electron microscopy images used to estimate the mitochondria/cytosol area ratios shown in concentration (conc). MFI, mean fluorescence intensity; GAPDH, glyceraldehyde 3-phosphate dehydrogenase. aP<0.05; bP<0.01 compared with the control.
120 100 80 60 40 20 0
Counts
FL1-Height 100 101 102 103 104
B Control GLP-1 (100 nM)
(Fig. 1F).
Effects of GLP-1 and exendin-4 on mitochondrial function in INS-1 cells
The intensity of TMRE staining, which is an indicator of the strength of the mitochondrial membrane potential, was in- creased in INS-1 cells treated with GLP-1 or exendin-4 for 48 hours (Fig. 2A). In line with this finding, the oxygen consump- tion rate of cells treated with GLP-1 for 48 hours exhibited a significant increase relative to controls (56.3±2.8 μmol/sec/105 cells vs. 42.0±1.6 μmol/sec/105 cells, P<0.05) (Fig. 2B).
DISCUSSION
Because mitochondrial oxidative phosphorylation is crucial to glucose-stimulated insulin secretion [4], the mechanisms me- diating the effects of GLP-1 on mitochondria in pancreatic β-cells deserve further study. One possible mechanism is the mobilization of calcium into the mitochondrial matrix after GLP-1 treatment, which has been reported to enhance mito- chondrial function in pancreatic MIN6 β-cells, possibly through the activation of several Krebs cycle dehydrogenases [8] and also in vascular smooth muscle cells [9]. Interestingly, in hepatocytes, nonapeptide fragments of GLP-1 (i.e., GLP-1 [28-36] amide) were shown to enter the cytoplasm rapidly and target mitochondria in a GLP-1 receptor-independent manner, and to be associated with decreased gluconeogenesis and oxi- dative stress [10]. However, in the present study, exendin-4 also exhibited a stimulatory effect on mitochondrial mass and function. Therefore, signaling through the GLP-1 receptor ap- pears to be sufficient to increase both mitochondrial mass and function in pancreatic β-cells.
We report here a novel effect of GLP-1 on mitochondrial biogenesis and function. In INS-1 cells, GLP-1 and exendin-4 treatment triggered an increase in mitochondrial mass, mito- chondrial density, mitochondrial membrane potential, and ox- ygen consumption. These increases were accompanied by up- regulation of PGC1α, a key regulator of mitochondrial biogen- esis [11]. However, further studies are needed to characterize the time-course of GLP-1-stimulated biogenesis, as it relates to that of PGC1α expression. In conclusion, the present study provides evidence for a new mechanism of action of GLP-1 in pancreatic β-cells, linking mitochondrial biogenesis and func- tion to glucose-stimulated insulin secretion.
CONFLICTS OF INTEREST
Y.M.C. has received lecture or consultation fees from MSD, Lilly, Novartis, Astra-Zeneca, and Boehringer-Ingelheim.
ACKNOWLEDGMENTS
We thank Dr. Hyung Jin Choi for the helpful discussions and Ms. So Hee Kim for her technical assistance. This study was supported in part by the Seoul National University Hospital Research Fund and by a KES Research Grant Award.
REFERENCES
1. Cho YM, Park KS, Lee HK. Genetic factors related to mi- tochondrial function and risk of diabetes mellitus. Diabetes Res Clin Pract 2007;77 Suppl 1:S172-7.
2. Kwak SH, Park KS, Lee KU, Lee HK. Mitochondrial me- tabolism and diabetes. J Diabetes Investig 2010;1:161-9.
3. Lowell BB, Shulman GI. Mitochondrial dysfunction and type 2 diabetes. Science 2005;307:384-7.
4. Maechler P, Wollheim CB. Mitochondrial function in nor- mal and diabetic beta-cells. Nature 2001;414:807-12.
5. Cho YM, Fujita Y, Kieffer TJ. Glucagon-like peptide-1: glu- cose homeostasis and beyond. Annu Rev Physiol 2014;76:535- 59.
6. Cho YM, Merchant CE, Kieffer TJ. Targeting the glucagon receptor family for diabetes and obesity therapy. Pharma- col Ther 2012;135:247-78.
7. Cho YM, Wideman RD, Kieffer TJ. Clinical application of glucagon-like peptide 1 receptor agonists for the treatment of type 2 diabetes mellitus. Endocrinol Metab (Seoul) 2013;28:262-74.
8. Tsuboi T, da Silva Xavier G, Holz GG, Jouaville LS, Thom- as AP, Rutter GA. Glucagon-like peptide-1 mobilizes intra- cellular Ca2+ and stimulates mitochondrial ATP synthesis in pancreatic MIN6 beta-cells. Biochem J 2003;369(Pt 2):287- 99.
9. Morales PE, Torres G, Sotomayor-Flores C, Pena-Oyarzun D, Rivera-Mejias P, Paredes F, Chiong M. GLP-1 promotes mitochondrial metabolism in vascular smooth muscle cells by enhancing endoplasmic reticulum-mitochondria cou- pling. Biochem Biophys Res Commun 2014;446:410-6.
10. Tomas E, Stanojevic V, Habener JF. GLP-1-derived nona- peptide GLP-1(28-36)amide targets to mitochondria and suppresses glucose production and oxidative stress in iso-
lated mouse hepatocytes. Regul Pept 2011;167:177-84.
11. Puigserver P, Spiegelman BM. Peroxisome proliferator-ac- tivated receptor-gamma coactivator 1 alpha (PGC-1 al-
pha): transcriptional coactivator and metabolic regulator.
Endocr Rev 2003;24:78-90.