ICCAS2005 June 2-5, KINTEX, Gyeonggi-Do, Korea
1. INTRODUCTION
Recently, the stability of the equipment operation of wastewater treatment plants has been required because plants have become larger and automatic control systems have been widely applied [1]. Most abnormal problems that cause the biggest disturbance in effluent water happen because of breakdown of various devices and equipment in wastewater treatment plants. The blower, mixer, and pump are the primary devices that affect the quality of effluent water. Detection of the breakdown of operating equipment is essential to guarantee a stable quality of effluent at WWTPs.
The equipments of treatment plants are generally checked and maintained by periodical inspection. Therefore, rapid breakdown cannot be detected and remedied that causes the deterioration of effluent quality. It is very important in the field to detect equipment faults immediately. Fault detection methods consist of two separate techniques. The direct detection method analyzes the several sensing data such as vibration data, and detects the abnormal behavior of equipment [2]. The indirect detection approach uses process profiles such as pH, DO, and ORP, the variation of which is measured. Variation under process conditions can provide information on whether the fault is caused by process problems or by equipment. Direct diagnosis detects equipment faults simply but cannot diagnose other process faults or identify the cause of the faults.
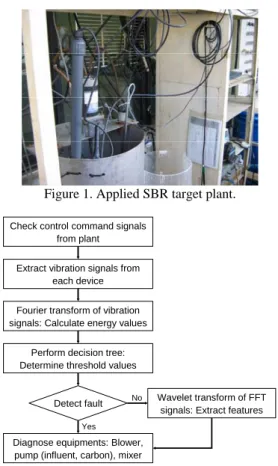
In this research, an SBR (Sequence Batch Reactor) plant was operated by a PC-based control system in order to treat the wastewater stably (Figure 1). The plant contains three sensors and four devices. ORP, DO, and pH sensors were installed, and a blower, a mixer, and two pumps were operated in the plant. This PC-based plant’s design was based on the concept of an open system, which can guarantee easy-reconfigurable, compatible, and extensible functions. LabVIEW was implemented to develop an open system for the target SBR plant [3]. Vibration signals were acquired from the operating equipment of the SBR plant and preprocessed by Fourier transform and Wavelet transform. After pre-processing, the decision tree method was used to diagnose the faults of the equipment.
2. SEQUENTIAL BATCH REACTOR
2.1 SBR target plant
In this research, the target plant contained a blower, a mixer,
and two pumps. To collect the observation data, vibration sensors were installed that can measure the vibration signals of equipment so that the fault detection of equipment could be achieved. In this research, a time-series data mining approach was employed to analyze the extracted vibration signals. Time-series data mining is new technique has been used recently in industrial fields. We applied time-series data mining with data preprocessing methods and the data mining technique. Figure 2 shows a flowchart of the proposed system.
Figure 1. Applied SBR target plant.
Extract vibration signals from each device
Perform decision tree: Determine threshold values Check control command signals
from plant
Wavelet transform of FFT signals: Extract features
Diagnose equipments: Blower, pump (influent, carbon), mixer
Fourier transform of vibration signals: Calculate energy values
Detect fault No
Yes
Figure 2. Flow chart of time-series data mining.
3. DATA TRANSFORM AND DATAMININ TOOLS
3.1 Preprocessing methods
Fourier transform and wavelet transform are the most popular signal processing methods. In this study, the sensing
Fault Diagnosis of Equipment of Wastewater Treatment Plants by Vibration
Signal Analysis Using Time-Series Data Mining
Dae-Won Choi
*, Hyeon Bae
**, Seung-Pyo Chun
**, and Sungshin Kim
*** Performance Evaluation Team, R&D Center, NEXEN Tire Co., Kyungnam, Korea (Tel : +82-55-370-5340; E-mail: [email protected])
**School of Electrical and Computer Engineering, Pusan National University, Busan, Korea (Tel : +82-51-510-2374; E-mail: {baehyeon, buzz74, sskim}@pusan.ac.kr)
Abstract: This paper describes how to diagnose SBR plant equipment using time-series data mining. It shows the equipment
diagnostics based upon vibration signals that are acquired from each device for process control. Data transform techniques including two data preprocessing skills and data mining methods were employed in the data analysis. The proposed method is not only suitable for SBR equipment, but is also suitable for other industrial devices. The experimental results performed on a lab-scale SBR plant show a good equipment-management performance.
signals were preprocessed by Fourier and wavelet transform to extract the features. The transformed signals supported much useful information on feature extraction. Equation (1) and (2) show the Fourier and wavelet transforms, respectively.
∫
−+∞∞ − = f te dt j F( ω) () jωt (1)∫
+∞ ∞ − − = dt a b t a t f a b Wf j j j) () 1 ( ) , ( ϕ* (2)3.2 Data mining technique
Determining thresholds using a decision tree method is one of the powerful data mining methods for classification of features. Entropy and gain are used to extend branches of trees.
∑
∑
∈ = − ≡ − ≡ ) ( 1 2 ) ( ) ( ) , ( log ) ( A Value c i i i S Entropy S S S Entropy A S Gain p p S Entropy υ υ υ (3)where S is a collection, pi is the proportion of S belonging to
class i. If the target attribute can take on c possible values, the entropy can be as large as log2c. Values(A) is the set of all
possible values for attribute A, and Sv is the subset of S.
4. RESULTS AND DISCUSSION
4.1 Sensing of vibration signals of four devices
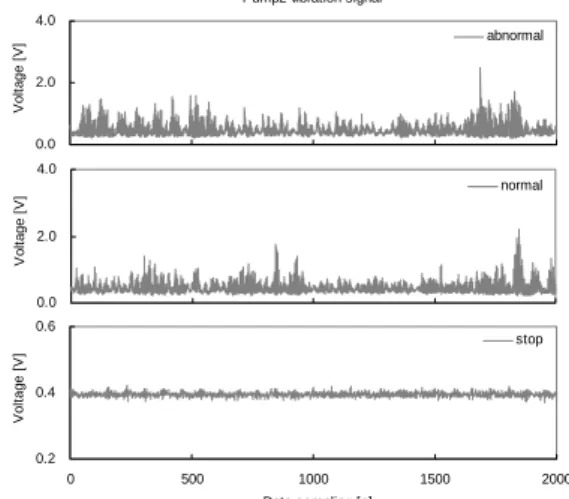
The vibration sensors were vertically installed on the housing of the equipment’s rotor to detect the faults of equipment. The signals were acquired from operating devices that included a blower, a mixer, a pump for influent feeding (Pump 1), and a pump for external carbon feeding (Pump 2).
The experimental conditions of the applied equipment were set according to abnormal, normal, and stop status. The signals for the stop status were collected at the point of stopping and the device condition was in normal status. The abnormal status was artificially established for the same case under actual field faults as follows: a blower had pipe clogging with wastewater sludge, a mixer’s pan was irregularly operating because of dregs, and Pump 1 and Pump 2 were under an abnormal condition caused by pipe sludge. Figure 3 to Fig. 6 show the obtained vibration signals that can provide information to determine equipment status. In this study, three conditions, abnormal, normal, and stop status, were simulated. The normal and stop states were set to check the correct operation of processes corresponding to control commands. And the abnormal state was set to detect independent device faults having no relation to control commands.
Blower vibration signal
0.2 0.4 0.6 0 500 1000 1500 2000 Data sampling V ol tage [ V ] abnormal 0.2 0.4 0.6 Data sampling V ol ta ge [ V ] normal 0.2 0.4 0.6 0 500 1000 1500 2000 Data sampling [n] V ol tage [ V ] stop
Figure 3. Vibration signals of a blower under.
Mixer vibration signal
0.0 2.0 4.0 6.0 0 500 1000 1500 2000 Data sampling V ol tage [ V ] abnormal 0.0 2.0 4.0 6.0 Data sampling V ol ta ge [ V ] normal 0.2 0.4 0.6 0 500 1000 1500 2000 Data sampling [n] V o lt age [ V ] stop
Figure 4. Vibration signals of a mixer under the three conditions.
Pump1 vibration signal
0.0 2.0 0 500 1000 1500 2000 Data sampling V o lt age [ V ] abnormal 0.0 2.0 Data sampling V ol tage [ V ] normal 0.2 0.4 0.6 0 500 1000 1500 2000 Data sampling [n] V ol tage [ V ] stop
Figure 5. Vibration signals of an influent pump under the three conditions.
Pump2 vibration signal
0.0 2.0 4.0 0 500 1000 1500 2000 Data sampling V ol tag e [ V ] abnormal 0.0 2.0 4.0 Data sampling V ol tage [ V ] normal 0.2 0.4 0.6 0 500 1000 1500 2000 Data sampling [n] V ol ta ge [ V ] stop
Figure 6. Vibration signals of an external carbon source pump under the three conditions.
4.2 Application of Fourier transform to each signal
The sensing data from the vibration sensors showed weak points to indicate faults in the equipment. The stop status was classified with the abnormal and the normal statuses, but there was no significant difference between the abnormal and the
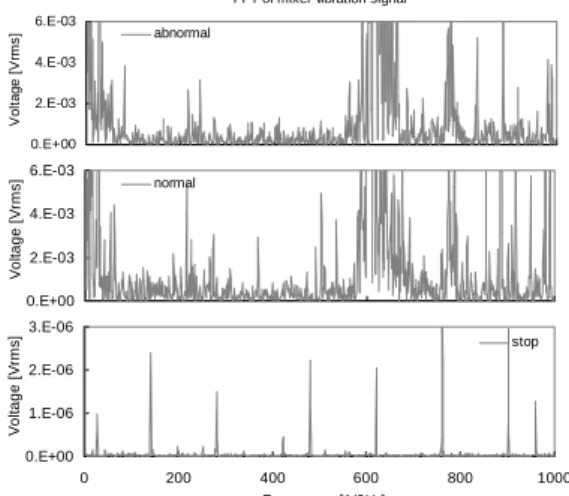
normal statuses in the vibration signals. Therefore, we found a pre-processing method that is a signal processing approach, namely FFT (Fast Fourier Transform). FFT is strong to noise and easy to use in physical plants. The abnormal, normal, and stop states were detected by the FFT results, which were based on vibration signals. The FFT values provide the specific features of each status. Figure 7 to Fig. 10 show the FFT results for the blower, the mixer, and the pumps under the three conditions.
FFT of blower vibration signal
0.E+00 2.E-05 4.E-05 6.E-05 0 200 400 600 800 1000 Data sampling Vo lt a g e [ V rm s ] abnormal 0.E+00 2.E-05 4.E-05 6.E-05 Data sampling V ol tage [ V rm s ] normal 0.E+00 1.E-06 2.E-06 3.E-06 0 200 400 600 800 1000 Frequency [1/2Hz] V ol tage [ V rm s ] stop
Figure 7. FFT signals of a blower under the three conditions. FFT of mixer vibration signal
0.E+00 2.E-03 4.E-03 6.E-03 0 200 400 600 800 1000 Data sampling V ol ta ge [ V rm s ] abnormal 0.E+00 2.E-03 4.E-03 6.E-03 Data sampling V ol tage [ V rm s ] normal 0.E+00 1.E-06 2.E-06 3.E-06 0 200 400 600 800 1000 Frequency [1/2Hz] V ol tage [ V rm s ] stop
Figure 8. FFT signals of a mixer under the three conditions.
FFT of pump1 vibration signal
0.E+00 2.E-04 4.E-04 6.E-04 0 200 400 600 800 1000 Data sampling V ol tage [ V rm s ] abnormal 0.E+00 2.E-05 4.E-05 6.E-05 Data sampling V o lt age [ V rm s ] normal 0.E+00 1.E-06 2.E-06 3.E-06 0 200 400 600 800 1000 Frequency [1/2Hz] V ol tage [ V rm s ] stop
Figure 9. FFT signals of an influent pump.
FFT of pump2 vibration signal
0.E+00 2.E-04 4.E-04 6.E-04 0 200 400 600 800 1000 Data sampling V ol tage [ V rm s ] abnormal 0.E+00 2.E-05 4.E-05 6.E-05 Data sampling V o lt age [ V rm s ] normal 0.E+00 1.E-06 2.E-06 3.E-06 0 200 400 600 800 1000 Frequency [1/2Hz] V o lt age [ V rm s ] stop
Figure 10. FFT signals of an external carbon source pump under the three conditions.
4.3 Employment Fourier transform based on energies
In the previous results, the abnormal, normal, and stop status had specific spectra of the natural frequency for each case. For numerical calculation, the energy values of FFT were applied and compared to detect faults. The energy values were calculated by the square of each FFT value and the average of the squared values. The sampling data were calculated for the energy values of FFT amounted to 1000 as shown in Equation (4).
∑
= = n x x f n Energy 1 2 ) ( 1 (4)Figure 11 to Fig. 13 shows the energy values of each FFT result according to the three statuses for the blower and the two pumps. The calculated energy values of the blower and the two pumps have clearly different distributions in the graphs. Therefore, we can ensure that fault detection of the three devices is successfully performed. These results indicate that the energy values of FFT are suitable values for fault detection. Classification rules were extracted by using the decision tree method, one of the data mining tools. From the results, we confirmed that the classification error is very low for the three pieces of equipment. The proposed FFT algorithm with decision tree techniques can detect faults of the blower, Pump 1, and Pump 2. As shown in the following figures, the classification capability is good, though for Pump 2 there are two errors; however, the system performance is adequate for application. Real-time fault detection should be possible using the extracted rules with small errors.
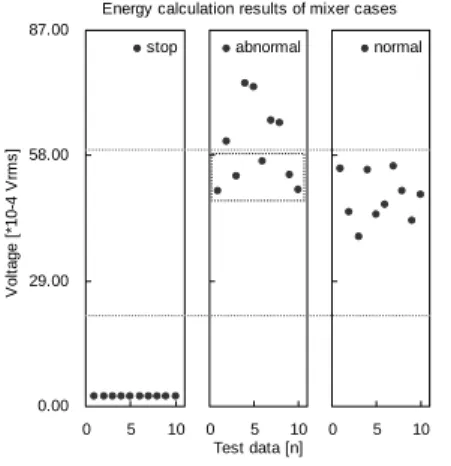
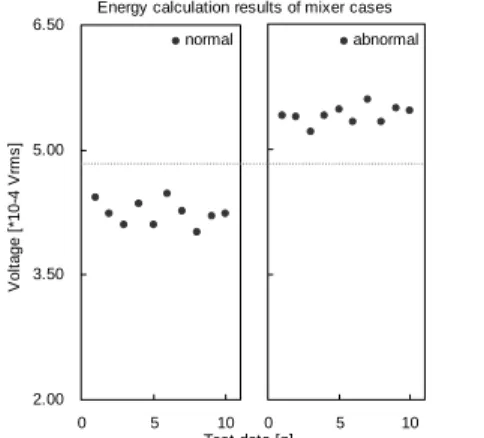
The application results of FFT for the blower, the mixer, and the two pumps are presented. The results show the possibility of fault detection, but not in mixer cases (Figure 14), so a new method of feature extraction is required [4]. From the decision tree result for the FFT energy values, we could perceive that it is difficult to classify the three conditions in the abnormal, normal, and stop statuses. As shown in the Fig. 14, approximately half of the errors were in the abnormal status, about 50% of the errors. This result leads to the definite conclusion that the fault of the mixer is not easily detected by the proposed approach, namely FFT with the decision tree method. To solve this problem, we propose implementation of wavelet transform.
1.60 1.80 2.00 2.20 0 5 10 Va lu e [ *1 0 -4 ] normal 1.60 1.80 2.00 2.20 0 5 10 Test data [n] Va lu e [ *1 0 -4 ] abnormal 1.60 1.80 2.00 2.20 0 5 10 V ol ta ge [ *10-4 V rm s ] stop
Energy calculation results of blower cases
(a) Energy values of a blower. Rules: Rule 1: (10, lift 2.7) b-FFT-avr ≤ 0.0001859203 → class 1 [0.917] Rule 2: (10, lift 2.7) b-FFT-avr > 0.0001859203 b-FFT-avr ≤ 0.0002030861 → class 2 [0.917] Rule 3: (10, lift 2.7) b-FFT-avr > 0.0002030861 → class 3 [0.917]
(b) Extracted rules for the blower.
Figure 11. FFT energy values of a blower and decision tree rules for classification of the fault cases.
2.00 3.40 4.80 6.20 0 5 10 Va lu e [ *1 0 -4 ] normal 2.00 3.40 4.80 6.20 0 5 10 Test data [n] Va lu e [ *1 0 -4 ] abnormal 2.00 3.40 4.80 6.20 0 5 10 V ol ta ge [ *10-4 V rm s ] stop
Energy calculation results of pump1 cases
(a) Energy values of a pumb1. Rules Rule 1: (10, lift 2.7) P1-FFT-avr ≤ 0.0002559595 → class 1 [0.917] Rule 2: (10, lift 2.7) P1-FFT-avr > 0.0002781371 → class 2 [0.900] Rule 3: (10, lift 2.7) P1-FFT-avr > 0.0002559595 P1-FFT-avr ≤ 0.0002781371 → class 3 [0.786]
(b) Extracted rules for the pump1.
Figure 12. FFT energy values of Pump 1 and decision tree rules for classification of the fault cases.
2.00 3.20 4.40 5.60 0 5 10 V al ue [ *10 -4] normal 2.00 3.20 4.40 5.60 0 5 10 Test data [n] V al ue [ *10 -4] abnormal 2.00 3.20 4.40 5.60 0 5 10 V ol tage [ *10-4 V rm s ] stop
Energy calculation results of pump2 cases
(a) Energy values of a pump2. Rules Rule 1: (10, lift 2.7) P2-FFT-avr ≤ 0.0002348289 → class 1 [0.917] Rule 2: (10, lift 2.7) P2-FFT-avr > 0.0003624962 → class 2 [0.917] Rule 3: (10, lift 2.7) P2-FFT-avr > 0.0002348289 P2-FFT-avr ≤ 0.0003624962 → class 3 [0.917]
(b) Extracted rules for the pump2.
Figure 13. FFT energy values of Pump 2 and decision tree rules for classification of the fault cases.
Figure 14. FFT energy values of the mixer.
4.4 Application of wavelet transform to mixer signals
The faults of the blower and the two pumps were detected by FFT energy values based on the decision tree method, whereas the faults of the mixer showed the worst performance of fault classification. This result shows that the FFT pre-processing approach is not suitable for mixer signals. Therefore, it is better to apply a new method to extract the special features from mixer signals. In this paper wavelet transform was employed to extract the proper features. We found that the results of wavelet transform of the fast Fourier transformed signals were better than those of the raw signals were. If raw signals are transformed by wavelet, synchronous problems often occurs that cause bad performance. Figure 15 shows the procedures of fault detection in the mixer. In the first step, FFT is performed, and in the second step, wavelet transform is achieved.
Coiflet was applied for a wavelet function, and
0.00 29.00 58.00 87.00 0 5 10 V al u e [ *10-4] normal 0.00 29.00 58.00 87.00 0 5 10 Test data [n] V al u e [ *10-4] abnormal 0.00 29.00 58.00 87.00 0 5 10 V ol tage [ *10-4 V rm s ] stop
decomposition was achieved with 10 levels. The results of wavelet transform showed approximate coefficients and detail coefficients at each level [5]. As the level becomes higher, the detail coefficients extract low-frequency components from converted data by Fourier transform, that is, as a low-pass filter. FFT data has high-frequency components, so the fault of a mixer can be detected in the high-frequency region [6]. Figures 16 and Fig. 17 present the results of wavelet transform of the first level and second level details for the stop, abnormal and normal statuses from top to bottom. Figure 16 shows the result of wavelet transform with first detail coefficients for the abnormal and normal statuses of the mixer and Fig. 17 presents the results for the second level. From the results, we could distinguish the abnormal and normal conditions of the mixer, which is not perfectly achieved by just FFT. The average values or each point value could be applied for fault detection in this study.
The wavelet decomposition was performed on the FFT-transformed signal of the mixer data. Figure 18 shows the energy values of the first details for normal and abnormal conditions. The faults of mixers can be detected by the result of the wavelet analysis using energy values. With proposed diagnosis algorithm, we can detect faults of the four operating devices in wastewater treatment plants.
Raw data 0.0 2.0 4.0 6.0 0 500 1000 1500 2000 Data sampling V ol tage [ V ] FFT transform 0.E+00 2.E-03 4.E-03 6.E-03 0 200 400 600 800 1000 Data sampling V o lt age [ V rm s ] Wavelet transform -0.4 -0.3 -0.2 -0.1 0.0 0.1 0.2 0 100 200 300 400 500 Data sampling V ol tag e [ V ]
Figure 15. Fault detection process in the mixer case that is achieved by Fourier and wavelet transform.
1st details under stop, normal, and abnormal conditions
-0.40 -0.30 -0.20 -0.10 0.00 0.10 0.20 0 100 200 300 400 500 V ol tage [ V ] stop -0.40 -0.30 -0.20 -0.10 0.00 0.10 0.20 0 100 200 300 400 500 V ol tage [ V ] normal -0.40 -0.30 -0.20 -0.10 0.00 0.10 0.20 0 100 200 300 400 500 Data sampling [n] V ol tage [ V ] abnormal
Figure 16. The 1st details of wavelet transform for FFT data including stop, normal, and abnormal conditions.
2nd details under stop, normal, and abnormal conditions
-0.40 -0.30 -0.20 -0.10 0.00 0.10 0.20 0 50 100 150 200 250 Vo lt a g e [ V ] stop -0.40 -0.30 -0.20 -0.10 0.00 0.10 0.20 0 50 100 150 200 250 V ol tage [ V ] normal -0.40 -0.30 -0.20 -0.10 0.00 0.10 0.20 0 50 100 150 200 250 Data sampling [n] V ol tag e [ V ] abnormal
Figure 17. The 2nd details of wavelet transform for FFT data including stop, normal, and abnormal conditions.
2.00 3.50 5.00 6.50 0 5 10 V al ue [ *10-4] abnormal 2.00 3.50 5.00 6.50 0 5 10 V ol tag e [ *10 -4 V rm s ] normal
Energy calculation results of mixer cases
Test data [n]
Figure 18. Fault detection process in the mixer case.
5. CONCLUSIONS
This paper introduced methods that can be used to diagnose the faults of SBR operating devices. Three conditions of equipments were studied and four pieces of equipment, which contained a blower, a mixer, and two pumps, were the targets. The applied conditions consisted of abnormal, normal, and stop statuses that imitated the physical phenomena in the fields.
The gathered vibration signals were preprocessed by FFT. The cases of the blower and the two pumps were well detected but the case of the mixer could not be classified by FFT only. Therefore, wavelet transform was employed to solve the case of the mixer. Wavelet transform showed good results for the mixer.
Classification rules were extracted by the decision tree method, which is one of the data mining techniques. The applied method is a powerful tool in the design of rules. The proposed fault diagnosis system exhibited a good detection performance with two preprocessing techniques and the decision tree method.
ACKNOWLEDGMENTS
This work was supported by “Research Center for Logistics Information Technology (LIT)” hosted by the Ministry of Education & Human Resources Development in Korea.
REFERENCES
system for monitoring and diagnosis of anaerobic wastewater treatment plants. Water Research, 36(10), 2656-2666.
[2] Alan V. Oppenheim and Ronald W. Schafer (1992). Discrete-Time Signal Processing. Prentice Hall. [3] Gray K. Well and Jefftey Travis (1997). LabVIEW for
Everyone. Prentice HallPRT.
[4] William J. E. Potts (1999). Decision Tree Modeling. SAS Institute, Inc., 14-24.
[5] W. J. Staszewski (1998). Wavelet Based Compression and Feature Selection for Vibration Analysis. Journal of Sound and Vibration, 211(5), 735- 760.
[6] D. Boulahbal, M. F. Golnaragihi and F. Ismail (1999). Amplitude and Phase Wavelet Maps for the Detection of Cracks in Geared Systems. Mechanical Systems and Signal Processing, 13(3), 423- 436.