Components of Metabolic Syndrome in Korean Adults:
A Hospital-Based Cohort at Seoul National University Bundang Hospital
Soo Lim
1,*, Se Hee Min
2, Ji Hyun Lee
3, Lee Kyung Kim
4, Dong-Hwa Lee
5, Jie-Eun Lee
1, Kyoung Min Kim
1, Sunmi Lee
6, Kyoung-Chan Park
6,7, Yun Jong Lee
1,61Department of Internal Medicine, Seoul National University Bundang Hospital, Seoul National University College of Medicine, Seongnam; 2Department of Internal Medicine, Asan Medical Center, University of Ulsan College of Medicine, Seoul; 3Department of Internal Medicine, Veterans Health Service Medical Center, Seoul;
4Department of Internal Medicine, Cheju Halla General Hospital, Jeju; 5Department of Internal Medicine, Chungbuk National University Hospital, Cheongju;
6Human Biobank, Seoul National University Bundang Hospital, Seongnam; 7Department of Dermatology, Seoul National University Bundang Hospital, Seoul National University College of Medicine, Seongnam, Korea
Background: The prevalence of metabolic syndrome is increasing in Korea, particularly among young adults.
This trend will increase the incidence of cardiovascular and metabolic diseases in the future. Therefore, it is im- perative to detect and prevent metabolic abnormalities early in life. Here, we established a hospital-based bio- bank cohort to identify the most prevalent dysmetabolic phenotype. The aim of this report was to inform other researchers of our protocol and to share our data for future collaboration.
Methods: The baseline examination comprised health-related questionnaires, anthropometric and handgrip strength measurements, bioelectrical impedance analysis of body composition, and nutritional assessment. Rel- evant biochemical parameters were measured, and oral glucose tolerance tests were performed. Metabolic syn- drome was defined according to the National Cholesterol Education Program Adult Treatment Panel III criteria with Asian waist circumference criteria.
Results: From a total of about 3,000 employees aged 20 to 59 years working at Seoul National University Bun- dang Hospital, 1,017 were enrolled from 2015 to 2016. The mean age was 34.5±8.4 years for men (n=311, 30.6%) and 30.9±8.5 years for women (n=706, 69.4%). The overall prevalence of metabolic syndrome was 7.6%
(17.7% in men and 3.1% in women). Among the five components of metabolic syndrome, high blood pressure was the most prevalent in both men (51.4%) and women (13.8%).
Conclusion: Although further follow-up data are needed, we expect that more adverse cardiovascular events may occur in men than in women. This hospital-based cohort will serve as the foundation for a comprehensive evaluation of metabolic syndrome and future cardiometabolic disease risk in middle-aged Koreans.
Key words: Metabolic syndrome, Cardiovascular disease, Risk factor, Biobank
Received February 26, 2019 Reviewed March 20, 2019 Accepted May 3, 2019
* Corresponding author Soo Lim
https://orcid.org/0000-0002-4137-1671 Department of Internal Medicine, Seoul National University Bundang Hospital, Seoul National University College of Medicine, 82 Gumi-ro 173beon-gil, Bundang-gu, Seongnam 13620, Korea Tel: +82-31-787-7035
Fax: +82-31-787-4051 E-mail: [email protected]
INTRODUCTION
Metabolic syndrome is a cluster of cardiometabolic risk factors comprising central obesity, dyslipidemia, hypertension, and hyper- glycemia.
1Hence, cardiovascular events and mortality are consis- tently more prevalent in subjects with metabolic syndrome.
2The
main pathophysiology of metabolic syndrome is insulin resistance and central obesity, although the International Diabetes Federation (IDF) diagnostic criteria emphasize central obesity
3, while the World Health Organization emphasizes impaired glucose regulation and/
or insulin resistance.
4The diagnostic criteria of metabolic syndrome established by the National Cholesterol Education Program Adult
Copyright © 2019 Korean Society for the Study of Obesity
This is an Open Access article distributed under the terms of the Creative Commons Attribution Non-Commercial License (http://creativecommons.org/licenses/by-nc/4.0/) which permits unrestricted non-commercial use, distribution, and reproduction in any medium, provided the original work is properly cited.
2017-03-16 https://crossmark-cdn.crossref.org/widget/v2.0/logos/CROSSMARK_Color_square.svg
Components of Metabolic Syndrome in Korean Adults:
A Hospital-Based Cohort at Seoul National University Bundang Hospital
Soo Lim
1,*, Se Hee Min
2, Ji Hyun Lee
3, Lee Kyung Kim
4, Dong-Hwa Lee
5, Jie-Eun Lee
1, Kyoung Min Kim
1, Sunmi Lee
6, Kyoung-Chan Park
6,7, Yun Jong Lee
1,61Department of Internal Medicine, Seoul National University Bundang Hospital, Seoul National University College of Medicine, Seongnam; 2Department of Internal Medicine, Asan Medical Center, University of Ulsan College of Medicine, Seoul; 3Department of Internal Medicine, Veterans Health Service Medical Center, Seoul;
4Department of Internal Medicine, Cheju Halla General Hospital, Jeju; 5Department of Internal Medicine, Chungbuk National University Hospital, Cheongju;
6Human Biobank, Seoul National University Bundang Hospital, Seongnam; 7Department of Dermatology, Seoul National University Bundang Hospital, Seoul National University College of Medicine, Seongnam, Korea
Background: The prevalence of metabolic syndrome is increasing in Korea, particularly among young adults.
This trend will increase the incidence of cardiovascular and metabolic diseases in the future. Therefore, it is im- perative to detect and prevent metabolic abnormalities early in life. Here, we established a hospital-based bio- bank cohort to identify the most prevalent dysmetabolic phenotype. The aim of this report was to inform other researchers of our protocol and to share our data for future collaboration.
Methods: The baseline examination comprised health-related questionnaires, anthropometric and handgrip strength measurements, bioelectrical impedance analysis of body composition, and nutritional assessment. Rel- evant biochemical parameters were measured, and oral glucose tolerance tests were performed. Metabolic syn- drome was defined according to the National Cholesterol Education Program Adult Treatment Panel III criteria with Asian waist circumference criteria.
Results: From a total of about 3,000 employees aged 20 to 59 years working at Seoul National University Bun- dang Hospital, 1,017 were enrolled from 2015 to 2016. The mean age was 34.5±8.4 years for men (n=311, 30.6%) and 30.9±8.5 years for women (n=706, 69.4%). The overall prevalence of metabolic syndrome was 7.6%
(17.7% in men and 3.1% in women). Among the five components of metabolic syndrome, high blood pressure was the most prevalent in both men (51.4%) and women (13.8%).
Conclusion: Although further follow-up data are needed, we expect that more adverse cardiovascular events may occur in men than in women. This hospital-based cohort will serve as the foundation for a comprehensive evaluation of metabolic syndrome and future cardiometabolic disease risk in middle-aged Koreans.
Key words: Metabolic syndrome, Cardiovascular disease, Risk factor, Biobank
Received February 26, 2019 Reviewed March 20, 2019 Accepted May 3, 2019
* Corresponding author Soo Lim
https://orcid.org/0000-0002-4137-1671 Department of Internal Medicine, Seoul National University Bundang Hospital, Seoul National University College of Medicine, 82 Gumi-ro 173beon-gil, Bundang-gu, Seongnam 13620, Korea Tel: +82-31-787-7035
Fax: +82-31-787-4051 E-mail: [email protected]
Treatment Panel III (NCEP-ATP III) have merged these concepts
5, and the IDF has published an updated set of criteria.
6The reported prevalence of metabolic syndrome varies widely according to age group, sex, ethnicity, and diagnostic criteria.
7In the Korea National Health and Nutrition Examination Survey (KNHANES), the prevalence of metabolic syndrome assessed by modified NCEP-ATP III guidelines increased from 24.9% in 1998 to 31.3% in 2007.
8More recent KNHANES data from 2007 to 2010 revealed that the prevalence of metabolic syndrome was 31.9% in men and 29.0% in women aged 30 years and above.
9In the present report, metabolic syndrome was defined by modified NCEP-ATP III guidelines, with the definition of abdominal obesi- ty established by the Korean Society for the Study of Obesity (waist circumference ≥ 90 cm in men and ≥ 85 cm in women).
10More strikingly, the KNHANES indicated that the prevalence of metabolic syndrome in young Koreans increased to 7.8% in 2007, whereas data from the United States revealed that the prevalence of metabolic syndrome in young people decreased to 6.5% in 2007.
11In addition, among subjects aged 20 years and above, the preva- lence of metabolic syndrome in the United States was stable at 36.1% from 2007 to 2008 and 34.7% from 2011 to 2012.
12In brief, metabolic syndrome has shown an increasing trend in Koreans, in contrast to the U.S. population.
A previous survey demonstrated that Western dietary pattern and sedentary behavior were associated with a high prevalence of metabolic syndrome in the United States.
13,14However, it has been reported that Korean women do not follow typical Western dietary patterns and thus have a relatively low prevalence of metabolic syn- drome.
15In terms of physical activity, excessive sitting time and low physical activity level were associated with a high risk of metabolic syndrome in Koreans.
16,17Interestingly, muscle strength was signifi- cantly lower in elderly male subjects with metabolic syndrome than in their normal counterparts.
18In addition, central obesity accom- panied by sarcopenia was closely associated with metabolic syn- drome in elderly Koreans.
19Therefore, a detailed assessment of nu- trition, physical activity, muscle strength, and body composition is needed to provide a comprehensive understanding of metabolic syndrome in the Korean population. Furthermore, in the era of precision medicine, appropriate sample collection is necessary to confirm the many potential biomarkers that predict metabolic syn-
drome and cardiovascular disease.
Building a cohort with employees in an institution or company is simple and effective in terms of recruitment and regular follow- up.
20Hospital-based cohorts have several advantages, including easy access to healthcare facilities and high participation and fol- low-up rates.
21Therefore, we established a hospital-based biobank cohort to determine the most prevalent metabolic abnormalities among metabolic syndrome components and to identify predictive biomarkers for risk of future diabetes mellitus and cardiovascular events such as nonfatal myocardial infarction, nonfatal stroke, and cardiovascular death. The primary purpose of this cohort study was to investigate the prevalence of the established risk factors for metabolic syndrome in Korean adults. The secondary purposes were to discover any new risk factors or predictors of metabolic syndrome and to uncover their possible mechanisms. We plan to follow up with this cohort every three years for up to 12 years for this purpose. Lastly, we will share our protocol in detail to merge our results with those of other hospital-based cohort studies and will release our dataset for future collaboration.
METHODS Study design
We designed a hospital-based prospective cohort study. Subjects were recruited at Seoul National University Bundang Hospital (SNUBH), Seongnam, Korea. The subjects were hospital workers in various occupational categories: physicians, nurses, pharmacists, technicians, and other hospital personnel. Under the national health and safety laws in Korea, an annual general health examina- tion is mandatory for all hospital employees. The components of the mandatory health examination depend on the occupational category. We enrolled subjects who underwent medical checkups for this purpose. The study protocol was approved by the Institu- tional Review Board of SNUBH (IRB No. B-1505/298-005). All subjects gave written informed consent to participate in our study and/or be included in the SNUBH-biobank. This study was regis- tered at https://clinicaltrials.gov (NCT02640859).
Study population and patient enrollment
Male and female employees of SNUBH who were 20 to 59 years
old were recruited through advertisements and enrolled voluntarily.
Subjects who had any type of malignancy, previous cardiovascular events, or known end-stage renal disease requiring dialysis were ex- cluded. In addition, subjects who were expected to change jobs within the next 6 months were excluded. We aimed to recruit 500 subjects per year for 2 years (2015–2016) to reach a target of 1,000 subjects. The baseline study was performed from 2015 to 2016.
Demographics and anthropometric measurements
At the baseline examination, self-completed questionnaires were used to assess the subjects’ demographics, general health status, and social history (alcohol consumption, smoking status, physical activ- ity, and family history of chronic diseases). We defined ex-smokers as those who had smoked more than 100 cigarettes in their lifetime but were not smoking at present. Physical activity was divided into four categories: (1) none; (2) regular walking, which was defined as ≥ 30 minutes of walking per day at least 3 days per week; (3) regular exercise, which included ≥ 30 minutes of activities such as fast walking, tennis, regular cycling, and moderate-intensity daily activities such as mopping at least 3 days per week; and (4) vigor- ous exercise, which included running, fast cycling, and climbing for
> 20 minutes at least 3 days per week. The parity of women was assessed with a standard questionnaire, which included the number of live births, year of delivery, and method of delivery.
Height and body weight were measured on an electronic scale with the subjects wearing light indoor clothing. Body mass index (BMI) was calculated as weight (kg) divided by height squared (m
2). Waist circumference was measured with a measuring tape at the midline between the lowest rib margin and the iliac crest. Sys- tolic and diastolic blood pressures were measured with an electron- ic blood pressure meter (UA-1020 device; A&D, Tokyo, Japan) while the subjects were seated. Blood pressure was measured twice at a 5-minute interval, and the mean value was used in the analysis.
Nutritional analysis
We performed a nutritional assessment using a web-based, com- puter-assisted personal interview system, which has been con- firmed to reflect individual usual nutrient intake.
22We provided in- formation on how to access the website and instructed participants to enter their nutrient intakes during 2 weekdays and 1 weekend
day. After the survey, we informed the participants of their analyzed results and provided dietary recommendations based on their nu- tritional status.
Bioelectrical impedance analysis
After subjects had fasted overnight and urinated, a trained nurse measured their body composition (fat and muscle mass) with a bioelectrical impedance analysis (BIA) machine (InBody720 or InBody770; InBody, Seoul, Korea) while the subjects wore light clothing, on the same day as blood sampling. The InBody720 and InBody770 use the same hardware for production of impedance.
Water intake was restricted before each BIA measurement. Partici- pants were placed in an upright position with bare feet, and an in- structor entered their identification number, age, sex, and height into the machine. The participants were then instructed to grasp the electrode bars with both hands and to separate their arms from their trunk. In this manner, the subjects’ feet and hands made con- tact with eight electrodes. After the machine was started by the in- structor, six different frequencies (1, 5, 50, 250, 500, and 1,000 kHz) were used on five segments of the body: both arms and legs and the trunk. Abdominal visceral fat area was estimated through the manufacturer’s calculation method.
23Handgrip strength
Handgrip strength was measured with an electronic grip strength dynamometer (TKK 5401, GripD; Takei Scientific Instruments, Tokyo, Japan) while the subjects were seated. Subjects were asked to perform maximum force trials twice with each hand in a right- then-left sequence. The mean values of repeated measures were re- corded.
Biochemical data
We instructed the participants not to eat food after midnight.
Baseline blood samples were drawn after at least 10 hours of fast-
ing, and the collected samples were centrifuged at 3,000 rpm for 10
minutes at 4°C. Plasma glucose level was analyzed by the hexoki-
nase method, while high-density lipoprotein (HDL) cholesterol
and low-density lipoprotein cholesterol levels were measured by
homogeneous enzymatic assays, and triglyceride level was mea-
sured by a glycerol-3-phosphate oxidase peroxide method. An XE-
2100 Hematology Analyzer (Sysmex Corp., Kobe, Japan) was used to measure white blood cell count, hemoglobin level, hematocrit level, and platelet count. Aspartate and alanine aminotransferase (NADH-UV method), total bilirubin (bilirubin oxidase method), thyroid function (electrochemiluminescence immunoassay), blood urea nitrogen (urease/glutamate dehydrogenase method), creati- nine (Jaffe’s kinetic method), calcium (o-cresolphtalein chromo- genic method), and phosphorus (molybdate reduction method) levels were measured at the central laboratory of SNUBH. The biochemical tests were performed immediately after sample collec- tion. Aliquots of serum, plasma, whole blood, DNA, and RNA (PAXgene Blood RNA System, Qiagen, Hilden, Germany) were kept in deep freezers until tested (–80°C).
Oral glucose tolerance test
We performed a standard 75-g 2-hour oral glucose tolerance test (OGTT) on selected subjects who agreed to participate. All partici- pants were advised to continue their regular diet and to avoid ex- cessive alcohol consumption and vigorous exercise for at least 3 days before the test. They were asked to ingest 75 g of glucose in a 225-mL volume (Glu Orange; McNulty Pharmaceutical, Seoul, Korea) over 5 minutes after a baseline blood sample was drawn.
24Aliquots of 4 mL of blood were collected 30 and 120 minutes after glucose ingestion for measurements of postload glucose concentra- tion (Postload30 and Postload120, respectively). The blood sam- ples were kept on ice during the tests, and the centrifugation proce- dure was the same as above.
Definition of metabolic syndrome
Metabolic syndrome was defined according to the IDF metabol- ic syndrome criteria
6, and waist circumference data were evaluated based on Asia-Pacific abdominal obesity criteria.
10Metabolic syn- drome was diagnosed by the presence of abdominal obesity (waist circumference ≥90 cm in men and ≥85 cm in women), plus two or more of the following factors: (1) blood triglyceride level ≥150 mg/dL or specific treatment for this lipid abnormality; (2) HDL-cholesterol level <40 mg/dL in men and <50 mg/dL in women or specific treat- ment for this lipid abnormality; (3) blood pressure ≥130/85 mmHg or use of antihypertensive medications; and (4) fasting blood glu- cose ≥ 100 mg/dL or use of antidiabetic medications.
Statistical analysis
The prevalence of metabolic syndrome in Korea is estimated to be 5.2%–31.7% among men and 9.0%–40.1% among women.
7The applied criteria for metabolic syndrome and the age range of the participants are important factors affecting the incidence of car- diometabolic diseases. In our cohort, we planned to recruit subjects aged 20–59 years, so the expected prevalence of metabolic syndrome was 10%–20% in both sexes, with a higher prevalence in men than in women. On the assumption of a cardiometabolic event rate of 10% in women and 20% in men over 3 years, we determined that a total of 1,000 participants (700 women and 300 men) would be re- quired for statistical analysis and sampling convenience. We planned to recruit around 1,000 subjects with a two to one ratio of women to men from 2015 to 2016.
All data are expressed as the mean and standard deviation (SD) or as number and percentage. The Kolmogorov-Smirnov test was applied to evaluate the normality of variable distributions. In the case of continuous variables that were not normally distributed, we performed nonparametric analyses. Before variables were com- pared between the two sexes, differences in variance were subjected to Levene’s test. Correlations between variables were analyzed by Pearson’s test. Categorical variables were compared by chi-square tests. For continuous variables, means were compared by Student t-test or nonparametric t-test. The analyses were performed with IBM SPSS version 20.0 (IBM Corp., Armonk, NY, USA). For all tests, P<0.05 was considered to be statistically significant.
RESULTS Baseline characteristics
Supplementary Table 1 displays the items measured in the base- line examination. Table 1 lists the clinical and biochemical charac- teristics of the subjects. At baseline, 1,017 subjects were enrolled.
The mean age of the subjects (± SD) was 32.0± 8.6 years, and the men were older than the women (34.5±8.4 years vs. 30.9±8.5 years, P<0.001). In this cohort, 69.4% were women. The mean waist cir- cumference was 85.0± 8.9 cm in men and 70.4± 7.9 cm in women.
Systolic blood pressure was higher in men than in women: 127.1±
11.8 mmHg in men vs. 112.9± 10.9 mmHg in women (P<0.001).
Plasma triglyceride level was also significantly different between
men and women: 131.3±107.3 mg/dL in men versus 76.7± 37.8 mg/dL in women (P<0.001). The mean fasting plasma glucose level was 95.5 ± 18.9 mg/dL in men and 88.5 ± 10.3 mg/dL in women (P<0.001). During the OGTT, the Postload30 level was highest (144.3± 36.3 mg/dL), followed by the Postload120 level (107.4± 36.1 mg/dL) and the fasting level. The Postload30 and Postload120 levels were higher in men than in women (P<0.01).
Table 2 displays the medical and family histories of the subjects.
The proportion of current smokers was 9.3% in men and 0.1% in women (P<0.001). Substantial alcohol consumption (≥30 g/day for men or ≥ 20 g/day for women) was observed in 14.5% of men
and 5.4% of women. In the physical activity assessment, 16.1% of men and 21.7% of women exercised regularly. Among all partici- pants, 16.6% and 10.4% of the subjects had family histories of hy- pertension and diabetes mellitus, respectively.
Metabolic syndrome components
In total, 77 subjects (7.6%) met the criteria for metabolic syn- drome. There was a significant difference in prevalence of metabol- ic syndrome between the sexes: 17.7% in men and 3.1% in women.
All individual components of metabolic syndrome were also more prevalent in men than in women (Table 3). When we compared
Table 1. Clinical and biochemical characteristics of the enrolled subjectsVariable Total (n= 1,017) Men (n= 311) Women (n= 706) P
Age (yr) 32.0± 8.6 34.5± 8.4 30.9± 8.5 < 0.001
Height (cm) 165.2± 7.9 173.7± 6.0 161.5± 5.3 < 0.001
Body weight (kg) 61.1± 12.4 74.2± 10.9 55.4± 7.8 < 0.001
BMI (kg/m2) 22.2± 3.3 24.6± 3.1 21.2± 2.8 < 0.001
Waist circumference (cm) 74.8± 10.6 85.0± 8.9 70.4± 7.9 < 0.001
Systolic blood pressure (mmHg) 117.3± 13.0 127.1± 11.8 112.9± 10.9 < 0.001
Diastolic blood pressure (mmHg) 73.4± 11.7 80.4± 9.8 70.3± 11.1 < 0.001
WBC (103/μL) 6.2± 2.4 6.1± 1.5 6.2± 2.7 0.653
Hemoglobin (g/dL) 13.9± 1.5 15.5± 1.0 13.2± 1.0 < 0.001
Hematocrit (%) 42.0± 4.0 46.0± 2.8 40.1± 3.0 < 0.001
Platelets (103/μL) 265.0± 55.5 257.4± 50.3 268.6± 57.6 0.006
Total cholesterol (mg/dL) 186.5± 31.2 193.0± 35.5 183.7± 28.8 < 0.001
Triglycerides (mg/dL) 93.1± 71.3 131.3± 107.3 76.7± 37.8 < 0.001
HDL cholesterol (mg/dL) 64.0± 15.4 54.9± 12.9 67.9± 14.7 < 0.001
LDL cholesterol (mg/dL) 102.8± 28.7 112.5± 34.2 99.3± 25.5 < 0.001
Fasting plasma glucose (mg/dL) 90.6± 13.8 95.5± 18.9 88.5± 10.3 < 0.001
Postload30 (mg/dL, n= 222) 144.3± 36.3 164.2± 54.1 138.2± 26.1 < 0.001
Postload120 (mg/dL, n= 218) 107.4± 36.1 119.0± 61.7 103.7± 21.5 0.007
AST (IU/L) 20.4± 7.3 24.8± 8.8 18.7± 5.9 < 0.001
ALT (IU/L) 17.6± 12.5 28.1± 17.5 13.5± 6.1 < 0.001
γGT (IU/L) 21.1± 28.4 35.9± 47.0 14.8± 8.6 < 0.001
Total bilirubin (mg/dL) 0.8± 0.3 0.9± 0.3 0.7± 0.3 < 0.001
Total T3 (ng/mL) 1.12± 0.19 1.14± 0.20 1.11± 0.19 0.072
Free T4 (ng/dL) 1.26± 0.18 1.32± 0.21 1.23± 0.17 < 0.001
TSH (IU/mL) 2.2± 1.7 2.1± 1.4 2.2± 1.8 0.159
BUN (mg/dL) 11.9± 3.1 13.5± 3.0 11.2± 2.9 < 0.001
Creatinine (mg/dL) 0.72± 0.16 0.89± 0.12 0.64± 0.12 < 0.001
eGFR (mL/min/1.73 m2) 108.4± 20.8 99.3± 16.2 112.6± 21.4 < 0.001
Calcium (mg/dL) 9.1± 0.3 9.2± 0.3 9.1± 0.3 < 0.001
Phosphorous (mg/dL) 3.7± 0.5 3.5± 0.5 3.7± 0.5 < 0.001
Values are presented as mean± standard deviation.
BMI, body mass index; WBC, white blood cell; HDL, high-density lipoprotein; LDL, low-density lipoprotein; Postload30 and Postload120, postload glucose levels 30 and 120 minutes after the oral glucose tolerance test; AST, aspartate aminotransferase; ALT, alanine aminotransferase; γGT, γ-glutamyl transferase; T3, triiodothyronine; T4, thyroxin; TSH, thyroid stimulating hormone; BUN, blood urea nitrogen; eGFR, estimated glomerular filtration rate.
the components of metabolic syndrome in women according to parity, all values were higher in women who had been pregnant than in those who had not (Supplementary Table 2). After the evaluation, we recommended lifestyle improvements to partici- pants who had symptoms of metabolic syndrome. In men, high blood pressure was the most prevalent factor (51.4%), followed by abdominal obesity (28.3%) and high triglyceride level (26.9%).
The prevalences of high blood glucose and low HDL cholesterol were 23.7% and 8.6%, respectively.
In women, all individual components of metabolic syndrome were uncommon. High blood pressure was the most prevalent ab- normality (13.8%), followed by hyperglycemia (12.3%) and low
HDL cholesterol levels (7.6%). The prevalences of abdominal obe- sity (defined by a waist circumference ≥ 85 cm) and hypertriglyc- eridemia were 6.5% and 4.6%, respectively (Fig. 1). The rates of abnormal glucose and blood pressure measurements increased with age in both sexes.
Body composition data
Body composition data (as assessed by BIA) are shown in Table 4.
Lean body mass was higher in men than in women (53.5± 6.8 kg vs. 36.5± 3.9 kg, P<0.001). Whole body fat percentage was signifi- cantly lower in men than in women (23.2%± 5.8% vs. 29.5%±
5.5%, P<0.001). High body fatness, defined as a whole-body fat percentage ≥25% in men and ≥30% in women, was found in 35.9%
of men and 45.8% of women. Abdominal visceral fat area estimated by BIA was larger in men than in women (99.9±42.0 cm
2vs.
58.9±40.2 cm
2, P<0.001). Abdominal visceral obesity, defined as abdominal visceral fat area ≥ 100 cm
2, was three times more preva- lent in men than in women (P<0.001).
Handgrip strength
Handgrip strength of the dominant hand differed significantly between the sexes (P<0.001): 41.2±7.9 kg in men and 24.1±4.9 kg in women (Table 4). Weak handgrip strength, defined as lower than the 30th percentile of age- and sex-specific reference data (< 40 kg in men and < 25 kg in women)
25, was found in 42.1% of men and 56.9% of women.
In the correlation analysis, in both men and women, handgrip strength correlated positively with muscle mass (r= 0.589 and r=
0.397, respectively, both P<0.001) and negatively with body fat percentage (r= –0.220, P<0.001 and r=–0.096, P=0.017, respec- tively).
In simple correlation analysis, there was no significant correlation between handgrip strength and number of metabolic syndrome components. However, in partial correlation analysis adjusted for BMI, there was a significant negative correlation between handgrip strength and number of metabolic syndrome components in both men and women (r= –0.139, P=0.025 and r=–0.127, P=0.002, respectively).
Table 2. Past and current medical conditions, social factors, and family histories
Variable Total (%) Men (%) Women (%) P *
Antihypertensive medication (yr) 3.2 6.8 1.4 < 0.001
20–29 0.2 1.0 0.3
30–39 2.4 4.5 1.0
40–49 5.4 10.9 1.4
50–59 24.1 38.1 16.2
Antidiabetic medication (yr) 0.8 2.3 0.1 0.001
20–29 0.0 0.0 0.0
30–39 0.3 0.8 0.0
40–49 0.8 1.8 0.0
50–59 10.3 23.8 2.7
Lipid-lowering medication (yr) 3.1 6.1 1.8 0.001
20–29 0.8 1.0 0.8
30–39 2.4 4.5 1.0
40–49 7.0 10.9 4.1
50–59 19.0 28.6 13.5
Alcohol consumption < 0.001
Non-drinker 30.4 18.0 35.8
Current drinker 69.6 82.0 64.2
Substantial alcohol consumption
(≥ 30 g/day in men, ≥ 20 g/day in women) 8.2 14.5 5.4 < 0.001
Smoking status < 0.001
Non-smoker 93.6 81.4 99.0
Ex-smoker 3.4 9.3 0.8
Current smoker 2.9 9.3 0.1
Regular exercise, yes 20.0 16.1 21.7 0.041
Family history
Hypertension 16.6 12.5 18.4 0.022
Diabetes mellitus 10.4 8.0 11.5 0.119
Dyslipidemia 7.6 5.5 8.5 0.096
Cardiovascular disease 11.4 2.6 4.8 0.123
Cerebrovascular disease 5.3 4.2 5.8 0.362
*P-values are shown for comparison of variables between men and women.
Nutrient intake
Table 4 displays the daily nutrient intakes in men and women.
Daily energy intake was 2,004.4± 499.5 kcal in men and 1,525.0±
394.5 kcal in women. Men consumed 55.1% of their energy from carbohydrates, 17.1% from protein, and 27.7% from fat. Women consumed 54.8% of their energy from carbohydrates, 16.6% from
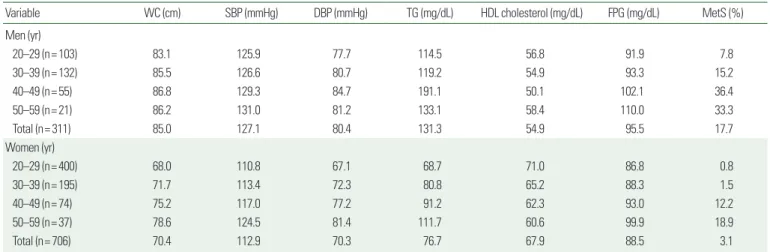
Table 3. Mean value of each component of metabolic syndrome and prevalence of metabolic syndrome according to sex and age groupVariable WC (cm) SBP (mmHg) DBP (mmHg) TG (mg/dL) HDL cholesterol (mg/dL) FPG (mg/dL) MetS (%)
Men (yr)
20–29 (n= 103) 83.1 125.9 77.7 114.5 56.8 91.9 7.8
30–39 (n= 132) 85.5 126.6 80.7 119.2 54.9 93.3 15.2
40–49 (n= 55) 86.8 129.3 84.7 191.1 50.1 102.1 36.4
50–59 (n= 21) 86.2 131.0 81.2 133.1 58.4 110.0 33.3
Total (n= 311) 85.0 127.1 80.4 131.3 54.9 95.5 17.7
Women (yr)
20–29 (n= 400) 68.0 110.8 67.1 68.7 71.0 86.8 0.8
30–39 (n= 195) 71.7 113.4 72.3 80.8 65.2 88.3 1.5
40–49 (n= 74) 75.2 117.0 77.2 91.2 62.3 93.0 12.2
50–59 (n= 37) 78.6 124.5 81.4 111.7 60.6 99.9 18.9
Total (n= 706) 70.4 112.9 70.3 76.7 67.9 88.5 3.1
Values are presented as mean or percentage.
WC, waist circumference; SBP, systolic blood pressure; DBP, diastolic blood pressure; TG, triglycerides; HDL, high-density lipoprotein; FPG, fasting plasma glucose; MetS, metabolic syndrome.
Figure 1. Age group- and sex-specific prevalences of the five individual components of metabolic syndrome in men (A) and women (B). Proportion of subjects with differ- ent numbers of metabolic syndrome components in men (C) and women (D). WC, waist circumference; TG, triglycerides; BP, blood pressure; HDL-C, high-density lipoprotein cholesterol.
A 100
80
60
40
20
0
Prevalence (%)
WC TG Glucose BP HDL-C
Men 20–29
30–39 40–49 50–59
B 100
80
60
40
20
0
Prevalence (%)
WC TG Glucose BP HDL-C
Women 20–29
30–39 40–49 50–59
C 0 1 2 3 4 Number of metabolic syndrome components 5
0 20 40 60 80 Prevalence (%)
Men D
0 1 2 3 4 5 Number of metabolic syndrome components
0 20 40 60 80 Prevalence (%)
Women
protein, and 28.6% from fat. Sodium intake was higher in men than in women (4,454.1±2,000.6 mg vs. 3,411.2±1,838.0 mg, P<
0.001).
DISCUSSION
In this hospital-based biobank cohort with 1,017 Korean partici- pants aged 20–59 years, the prevalence of metabolic syndrome was 7.6% overall, with a large difference between the sexes: 17.7% in men and 3.1% in women. All individual components of metabolic syndrome were also more prevalent in men than in women. In men, high blood pressure was the most prevalent abnormality (51.4%), and abdominal obesity and high triglyceride levels were next: 28.3% and 26.9%, respectively. In women, high blood pres-
sure was also the most prevalent abnormality (13.8%), while hy- perglycemia and low HDL cholesterol levels were next: 12.3% and 7.6%, respectively.
This study revealed that high blood pressure was the most preva- lent component of metabolic syndrome in both sexes. However, the second most prevalent abnormality was high triglyceride level in men but low HDL-cholesterol level in women. Similarly, the China Health and Nutrition Survey 2009 indicated that the preva- lence of metabolic syndrome according to the revised NCEP-ATP III criteria was 12.4% in young subjects (18–39 years old), with a large sex difference (15.7% in men and 9.5% in women).
26In that study, the most frequent abnormal component in men was high blood pressure (45.7%), as in the current study, but the most fre- quent abnormal component in women was high waist circumfer- ence (cutoff ≥ 80 cm; 56.0%). After high waist circumference, high blood pressure was the next most prevalent abnormality in women, followed by low HDL-cholesterol (31.0%).
Interestingly, the prevalence of metabolic syndrome was very low in our cohort. Tran et al.
27determined the prevalence of metabolic syndrome using KNHANES data from 2008 to 2013. Using the same diagnostic criteria for metabolic syndrome as those used in our study, they found that the prevalence of metabolic syndrome was 30.8% in men and 28.9% in women. The age of the partici- pants and the rates of smoking and alcohol intake were higher in their study than in ours. Furthermore, obesity (BMI ≥ 25 kg/m
2) was more prevalent in the KNHANES than in our biobank cohort (33.2% vs. 19.0%).
In our study, current and ex-smokers were extremely rare among Korean women (0.1% and 0.8%, respectively). This may have con- tributed to the significant difference in incidence of high blood pressure between the sexes: 51.4% in men but only 13.8% in wom- en. Lower sodium intake in women also may have contributed to their low incidence of hypertension in the present study.
28Further- more, previous KNHANES data indicated that metabolic syn- drome was more prevalent in housewives than in female office workers.
9These socioenvironmental factors likely contributed to the low prevalence of metabolic syndrome among women in this study. Other Asian surveys and meta-analyses have also shown that prevalence of metabolic syndrome tends to be higher in men than in women in young populations.
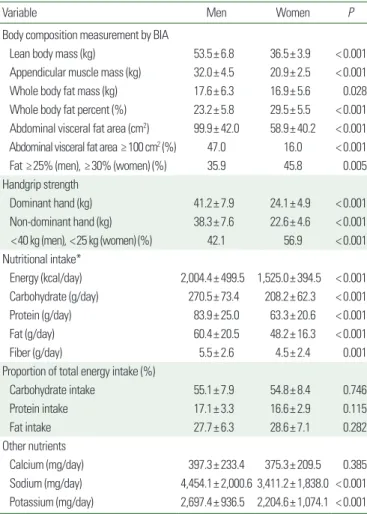
29,30Table 4. Body composition, handgrip strength, and nutrient intakes of study partic- ipants according to sex
Variable Men Women P
Body composition measurement by BIA
Lean body mass (kg) 53.5± 6.8 36.5± 3.9 < 0.001 Appendicular muscle mass (kg) 32.0± 4.5 20.9± 2.5 < 0.001 Whole body fat mass (kg) 17.6± 6.3 16.9± 5.6 0.028 Whole body fat percent (%) 23.2± 5.8 29.5± 5.5 < 0.001 Abdominal visceral fat area (cm2) 99.9± 42.0 58.9± 40.2 < 0.001 Abdominal visceral fat area ≥100 cm2 (%) 47.0 16.0 < 0.001
Fat ≥25% (men), ≥30% (women) (%) 35.9 45.8 0.005
Handgrip strength
Dominant hand (kg) 41.2± 7.9 24.1± 4.9 < 0.001
Non-dominant hand (kg) 38.3± 7.6 22.6± 4.6 < 0.001 <40 kg (men), <25 kg (women) (%) 42.1 56.9 < 0.001 Nutritional intake*
Energy (kcal/day) 2,004.4± 499.5 1,525.0± 394.5 < 0.001 Carbohydrate (g/day) 270.5± 73.4 208.2± 62.3 < 0.001 Protein (g/day) 83.9± 25.0 63.3± 20.6 < 0.001
Fat (g/day) 60.4± 20.5 48.2± 16.3 < 0.001
Fiber (g/day) 5.5± 2.6 4.5± 2.4 0.001
Proportion of total energy intake (%)
Carbohydrate intake 55.1± 7.9 54.8± 8.4 0.746
Protein intake 17.1± 3.3 16.6± 2.9 0.115
Fat intake 27.7± 6.3 28.6± 7.1 0.282
Other nutrients
Calcium (mg/day) 397.3± 233.4 375.3± 209.5 0.385 Sodium (mg/day) 4,454.1± 2,000.6 3,411.2± 1,838.0 < 0.001 Potassium (mg/day) 2,697.4± 936.5 2,204.6± 1,074.1 < 0.001 Values are presented as mean± standard deviation unless otherwise indicated.
*Nutrient intakes were assessed in 401 participants.
BIA, bioelectrical impedance analysis.