Copyright © 2021 Korean Stroke Society
This is an Open Access article distributed under the terms of the Creative Commons Attribution Non-Commercial License (http://creativecommons.org/licenses/by-nc/4.0/) which permits unrestricted non-commercial use, distribution, and reproduction in any medium, provided the original work is properly cited.
Letter to the Editor
Golden Hour Thrombolysis in Acute Ischemic Stroke:
The Changing Pattern in South Korea
Hyunsoo Kim,
aJoon-Tae Kim,
aJi Sung Lee,
bBeom Joon Kim,
cJong-Moo Park,
dKyusik Kang,
dSoo Joo Lee,
eJae Guk Kim,
eJae-Kwan Cha,
fDae-Hyun Kim,
fTai Hwan Park,
gSang-Soon Park,
gKyung Bok Lee,
hJun Lee,
iKeun-Sik Hong,
jYong-Jin Cho,
jHong-Kyun Park,
jByung-Chul Lee,
kKyung-Ho Yu,
kMi Sun Oh,
kDong-Eog Kim,
lWi-Sun Ryu,
lJay Chol Choi,
mJee-Hyun Kwon,
nWook-Joo Kim,
nDong-Ick Shin,
oSung Il Sohn,
pJeong-Ho Hong,
pMan-Seok Park,
aKang-Ho Choi,
aKi-Hyun Cho,
aJuneyoung Lee,
qHee-Joon Bae
ca
Department of Neurology, Chonnam National University Hospital, Chonnam National University Medical School, Gwangju, Korea
b
Clinical Research Center, Asan Institute for Life Sciences, Asan Medical Center, University of Ulsan College of Medicine, Seoul, Korea
c
Department of Neurology, Cerebrovascular Center, Seoul National University Bundang Hospital, Seoul National University College of Medicine, Seongnam, Korea
d
Department of Neurology, Nowon Eulji Medical Center, Eulji University, Seoul, Korea
e
Department of Neurology, Daejeon Eulji Medical Center, Eulji University, Daejeon, Korea
f
Department of Neurology, Dong-A University Hospital, Dong-A University College of Medicine, Busan, Korea
g
Department of Neurology, Seoul Medical Center, Seoul, Korea
h
Department of Neurology, Soonchunhyang University Hospital, Soonchunhyang University College of Medicine, Seoul, Korea
i
Department of Neurology, Yeungnam University Medical Center, Yeungnam University College of Medicine, Daegu, Korea
j
Department of Neurology, Inje University Ilsan Paik Hospital, Inje University College of Medicine, Goyang, Korea
k
Department of Neurology, Hallym University Sacred Heart Hospital, Hallym University College of Medicine, Anyang, Korea
l
Department of Neurology, Dongguk University Ilsan Hospital, Dongguk University College of Medicine, Goyang, Korea
m
Department of Neurology, Jeju National University Hospital, Jeju National University School of Medicine, Jeju, Korea
n
Department of Neurology, University of Ulsan College of Medicine, Ulsan, Korea
o
Department of Neurology, Chungbuk National University Hospital, Chungbuk National University College of Medicine, Cheongju, Korea
p
Department of Neurology, Keimyung University Dongsan Medical Center, Keimyung University School of Medicine, Daegu, Korea
q
Department of Biostatistics, Korea University College of Medicine, Seoul, Korea
Dear Sir:
Intravenous tissue plasminogen activator (IV-tPA) is pivotal for the treatment of acute ischemic stroke; however, the benefit of IV-tPA treatment declines rapidly soon after stroke onset.
1These results support intensive efforts to reduce both onset-to- treatment (OTT) time and door-to-treatment (DTT) time and serve as a basis for establishing an in-hospital and prehospital stroke care system. As these efforts require substantial expen- ditures of labor and capital, more real-world data are needed to assess the effect of golden hour thrombolysis for acute isch- emic stroke. Moreover, understanding the current status and secular changes in IV-tPA treatment will be important to es- tablish an appropriate stroke care system in the future. There- fore, we investigated the effect of golden hour thrombolysis
and secular changes in time-to-treatment variables for IV-tPA for acute ischemic stroke by analyzing a prospective registry of 16 stroke centers in South Korea.
This study was based on data from the Clinical Research Col-
laboration for Stroke in Korea registry of consecutive patients
with acute ischemic stroke or transient ischemic attack. From
the database, we analyzed the data of patients who were
treated with IV-tPA between April 2008 and March 2019. A
detailed description of the enrollment process and data collec-
tion process is shown in Supplementary Figure 1 and the Sup-
plementary methods. The time metrics, starting from onset or
arrival, were defined as follows: (1) onset-to-door (OTD) time
was defined as the time from onset (when the patient was last
known to be well) to arrival; (2) OTT time was defined as the
time from onset to IV-tPA treatment; and (3) DTT time was de-
OTT time (min) OTT ≤60 min (%) 140
120 100 80 60 40 20 0
14 12 10 8 6 4 2 2009 2010 2011 2012 2013 2014 2015 2016 2017 2018 Mar 0
2019
A
OTT ≤60 min OTT
2009 2010 2011 2012 2013 2014 2015 2016 2017 2018 Mar 2019
DTT time (min) DTT ≤30 min (%)
60 50 40 30 20 10 0
DTT ≤60 min DTT
B
50
40
30
20
10
0
Figure 1. Annual changes in intravenous tissue plasminogen activator treatment times. (A) Onset-to-treatment (OTT) time and the proportions of OTT times ≤60 minutes; (B) door-to-treatment (DTT) time and the propor- tions of DTT times ≤30 minutes; and (C) onset-to-door (OTD) time and the proportions of OTD times ≤30 minutes.
2009 2010 2011 2012 2013 2014 2015 2016 2017 2018 Mar 2019
OTD time (min) OTD ≤30 min (%)
90 80 70 60 50 40 30 20 10 0
30 25 20 15 10 5 0
C
OTD ≤30 min OTD
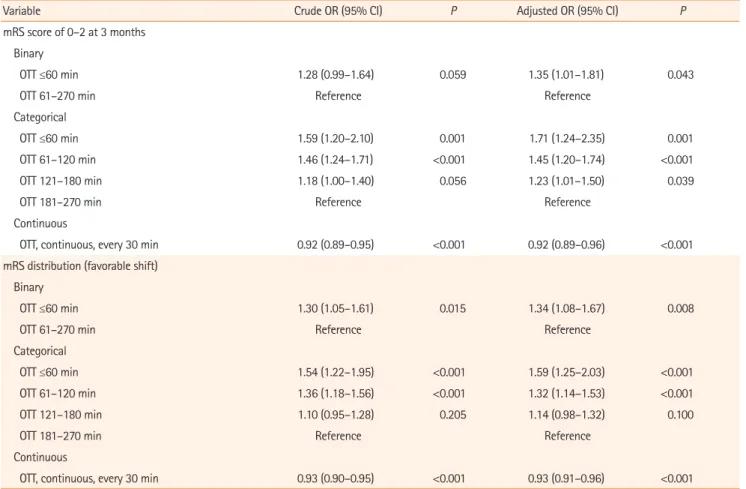
Table 1. Association of OTT time with functional outcomes at 3 months
Variable Crude OR (95% CI) P Adjusted OR (95% CI) P
mRS score of 0–2 at 3 months Binary
OTT ≤60 min 1.28 (0.99–1.64) 0.059 1.35 (1.01–1.81) 0.043
OTT 61–270 min Reference Reference
Categorical
OTT ≤60 min 1.59 (1.20–2.10) 0.001 1.71 (1.24–2.35) 0.001
OTT 61–120 min 1.46 (1.24–1.71) <0.001 1.45 (1.20–1.74) <0.001
OTT 121–180 min 1.18 (1.00–1.40) 0.056 1.23 (1.01–1.50) 0.039
OTT 181–270 min Reference Reference
Continuous
OTT, continuous, every 30 min 0.92 (0.89–0.95) <0.001 0.92 (0.89–0.96) <0.001
mRS distribution (favorable shift) Binary
OTT ≤60 min 1.30 (1.05–1.61) 0.015 1.34 (1.08–1.67) 0.008
OTT 61–270 min Reference Reference
Categorical
OTT ≤60 min 1.54 (1.22–1.95) <0.001 1.59 (1.25–2.03) <0.001
OTT 61–120 min 1.36 (1.18–1.56) <0.001 1.32 (1.14–1.53) <0.001
OTT 121–180 min 1.10 (0.95–1.28) 0.205 1.14 (0.98–1.32) 0.100
OTT 181–270 min Reference Reference
Continuous
OTT, continuous, every 30 min 0.93 (0.90–0.95) <0.001 0.93 (0.91–0.96) <0.001
Adjustment variables: age, male sex, initial National Institutes of Health Stroke Scale (NIHSS) score, history of stroke, hypertension, diabetes mellitus, atrial fi- brillation, prior statin use, systolic blood pressure, glucose, tissue plasminogen activator dose, and Trial of Org 10172 in Acute Stroke Treatment (TOAST) classi- fication.
OTT, onset-to-treatment; OR, odds ratio; CI, confidence interval; mRS, modified Rankin Scale.
fined as the time from arrival to IV-tPA treatment. The primary outcome was a good functional outcome at 3 months (a modi- fied Rankin Scale [mRS] score of 0–2). Other outcomes of in- terest are described in the Supplementary methods.
Multivariable logistic regression models using generalized linear mixed models to account for the effect of hospital (using a random intercept model) were used to explore the relation- ship between OTT time and the clinical outcome of interest. In addition, we explored the temporal trends in the OTT time, DTT time, and OTD time by calendar year.
A total of 4,248 patients (mean age 67.6±12.6 years; 62%
men) were included. In total, 282 (6.6%) patients had an OTT time between 0 and 60 minutes. The general characteristics of patients according to the four OTT windows (0–60, 61–
120, 121–180, and 181–270 minutes) are shown in Supple- mentary Table 1. The associations of OTT windows (as binary, categorical, and continuous variables) with outcomes are shown in Table 1 and Supplementary Table 2. Patients treated within 60 minutes of onset were associated with 35% higher odds of achieving good outcomes at 3 months than those treated beyond 60 minutes of onset (adjusted odds ratio [aOR], 1.35; 95% confidence interval [CI], 1.01 to 1.81). In addition, for every 30-minute delay in treatment, a favorable mRS shift was less likely to occur (OR, 0.93; 95% CI, 0.90 to 0.95) (Supplementary Figure 2).
From April 2008 to March 2019, the proportion of IV-tPA times within the golden hour increased modestly over time, from less than 6.9% in 2009 to 8.8% in 2019, with associa- tions of 12% higher odds for golden hour thrombolysis for ev- ery 1-year increase (aOR, 1.12; 95% CI, 1.03 to 1.21; P=0.005) (Figure 1 and Supplementary Table 3).
In an analysis of over 4,200 patients treated with IV-tPA from a nationwide multicenter stroke registry in South Korea, golden hour thrombolysis was associated with better function- al outcomes at 3 months than later treatment. The risk of death or symptomatic intracerebral hemorrhage was not asso- ciated with golden hour thrombolysis. Time to IV-tPA treat- ment is an important determinant of 90-day functional out- comes in acute ischemic stroke.
2In previous studies, golden hour thrombolysis was associated with a good functional out- come at discharge and 3 months.
1,3Therefore, our study sup- ports the previous results on the effects of golden hour throm- bolysis in real-world practice.
In addition, we found that annual rates of golden hour thrombolysis have substantially increased since 2009. These results seemed to be related to the decrease in DTT time or the increasing percentages of DTT time within 30 minutes.
Efforts to reduce DTT are the main goal of stroke, and our re-
sults support the hypothesis that stroke centers implement- ing quality improvement programs for in-hospital stroke care improve the workflow of tPA treatment.
4-7Unlike the results of DTT reduction, the proportion of patients with OTD <30 minutes decreased from that in 2009. This might be an un- solved problem in the stroke system in Korea, and further study is warranted.
This study has several limitations. First, the participating centers did not use uniform guidelines for diagnostic evalua- tion, patient selection, or IV-tPA treatment workflows. Addi- tionally, detailed hospital factors such as door-to-imaging time were not considered in the analyses. Third, we did not include patients who underwent endovascular thrombectomy. As they might have increased stroke severity, this exclusion could have affected the results. Fourth, our statistical adjustments for pa- tient differences may have been incomplete because of residual or unmeasured confounding variables.
In conclusion, our results show that golden hour thromboly- sis could improve the chances of a good outcome at 3 months.
Although the data supporting the improvement in in-hospital delay for IV-tPA treatment are clear, the results also suggest that additional efforts to implement more advanced stroke care systems are warranted to further improve acute stroke care in South Korea.
Supplementary materials
Supplementary materials related to this article can be found online at https://doi.org/10.5853/jos.2020.04658.
References
1. Kim JT, Fonarow GC, Smith EE, Reeves MJ, Navalkele DD, Grotta JC, et al. Treatment with tissue plasminogen activator in the golden hour and the shape of the 4.5-hour time-ben- efit curve in the national United States get with the guide- lines-stroke population. Circulation 2017;135:128-139.
2. Emberson J, Lees KR, Lyden P, Blackwell L, Albers G, Bluhmki E, et al. Effect of treatment delay, age, and stroke severity on the effects of intravenous thrombolysis with alteplase for acute ischaemic stroke: a meta-analysis of individual patient data from randomised trials. Lancet 2014;384:1929-1935.
3. Tsivgoulis G, Katsanos AH, Kadlecová P, Czlonkowska A, Ko- bayashi A, Brozman M, et al. Intravenous thrombolysis for ischemic stroke in the golden hour: propensity-matched analysis from the SITS-EAST registry. J Neurol 2017;264:912- 920.
4. Fonarow GC, Zhao X, Smith EE, Saver JL, Reeves MJ, Bhatt
DL, et al. Door-to-needle times for tissue plasminogen acti- vator administration and clinical outcomes in acute ischemic stroke before and after a quality improvement initiative.
JAMA 2014;311:1632-1640.
5. Kamal N, Holodinsky JK, Stephenson C, Kashayp D, Demchuk AM, Hill MD, et al. Improving door-to-needle times for acute ischemic stroke: effect of rapid patient registration, moving directly to computed tomography, and giving alteplase at the computed tomography scanner. Circ Cardiovasc Qual Out- comes 2017;10:e003242.
6. Kassardjian CD, Willems JD, Skrabka K, Nisenbaum R, Barna- by J, Kostyrko P, et al. In-patient code stroke: a quality im- provement strategy to overcome knowledge-to-action gaps in response time. Stroke 2017;48:2176-2183.
7. Heo JH, Kim YD, Nam HS, Hong KS, Ahn SH, Cho HJ, et al. A computerized in-hospital alert system for thrombolysis in acute stroke. Stroke 2010;41:1978-1983.
Correspondence: Joon-Tae Kim
Department of Neurology, Chonnam National University Hospital, Chonnam National University Medical School, 42 Jebong-ro, Dong-gu, Gwangju 61469, Korea
Tel: +82-62-220-6180 Fax: +82-62-228-3461 E-mail: [email protected] https://orcid.org/0000-0003-4028-8339 Co-correspondence: Hee-Joon Bae
Department of Neurology, Cerebrovascular Center, Seoul National University Bundang Hospital, Seoul National University College of Medicine, 82 Gumi-ro 173beon-gil, Bundang-gu, Seongnam 13620, Korea
Tel: +82-31-787-7467 Fax: +82-31-787-4059 E-mail: [email protected]
https://orcid.org/0000-0003-0051-1997 Received: November 23, 2020 Revised: January 13, 2021 Accepted: January 14, 2021
This study was supported by a grant (BCRI20020) from Chonnam National University Hospital Biomedical Research Institute. This study was supported by funding (2020ER620200#) from the Research of Korea Centers for Disease Control and Prevention.
The authors have no financial conflicts of interest.
Supplementary methods
Data collection
Demographic, clinical, imaging, and laboratory data were pro- spectively collected. Baseline data, including National Insti- tutes of Health Stroke Scale (NIHSS) scores, were collected from all patients, and the stroke subtypes were classified ac- cording to the Trial of Org 10172 in Acute Stroke Treatment (TOAST) criteria after complete diagnostic profiling. The follow- ing data were directly obtained from the registry database: (1) demographics, (2) medical history, (3) medication, (4) stroke characteristics and acute treatment, (5) laboratory data, and (6) in-hospital treatment data. For continuous variables, the data were imputed to the median values if <5% of the values were missing.
Outcome measures
The other outcomes of interest were the distribution of func- tional outcomes according to the 3-month modified Rankin Scale (mRS) score, an excellent functional outcome at 3 months (a mRS score of 0–1), symptomatic intracerebral hem- orrhage (SICH) within 3 months, and death within 3 months.
SICH was defined according to the Safe Implementation of Thrombolysis in Stroke-Monitoring Study criteria as a worsen- ing of neurological status (an increase in NIHSS score of 4 or more) with the appearance of new parenchymal hemorrhage (type 2) on brain imaging that was sufficient to cause neuro- logical deterioration.
Statistical analysis
The following parameters had missing data that were imputed to the median values: onset-to-treatment (OTT) time (0.6%), door-to-treatment (DTT) time (0.6%), body mass index (2.2%), creatinine (0.1%), hemoglobin (0.1%), white blood cell (WBC) count (0.1%), and initial random glucose (0.7%).
The baseline characteristics, workflow time metrics, and out- comes were compared among patients treated in the OTT win- dows of 0–60, 61–120, 121–180, and 181–270 minutes, and between patients treated within and beyond the golden hour (OTT window of 0–60 minutes). Multivariable logistic regres- sion models using generalized linear mixed models to account for the effect of hospital (using a random intercept model) were used to explore the relationship between OTT and the clinical outcome of interest. The adjusted models were con- trolled for predetermined variables with clinically relevant as- sociations with the outcome variables: age, male sex, initial NIHSS score, history of stroke, hypertension, diabetes mellitus, atrial fibrillation, pre-stroke statin use, systolic blood pressure, glucose, TOAST subtype, tissue plasminogen activator dose, and workflow time variables (OTT, DTT, and onset-to-door [OTD]
times). In addition, we explored the temporal trends in the OTT time (and proportion of OTT times ≤30 minutes), DTT time (and proportion of DTT times ≤30 minutes), and OTD time (and pro- portions of OTD times ≤30 minutes) by calendar year.
P-values <0.05 were considered statistically significant. Odds
ratios and 95% confidence intervals were calculated. Statisti-
cal analysis was performed using R version 3.2 (R Foundation
for Statistical Computing, Vienna, Austria).
Supplementary Table 1. General patient characteristics according to the time to IV-tPA treatment
Characteristic OTT ≤60 min OTT 61–120 min OTT 121–180 min OTT 181–270 min P OTT >60 min P
Number 282 1,764 1,301 901 3,966
Age (yr) 66.2±13.0 66.7±12.7 68.3±12.6 68.8±12.3 <0.001 67.7±12.6 0.046
Male sex 178 (63.1) 1,122 (63.6) 774 (59.5) 560 (62.2) 0.135 2,456 (61.9) 0.704
Pre-mRS score of 0–1 242 (85.8) 1,552 (88.0) 1,115 (85.7) 778 (86.3) 0.271 3,445 (86.9) 0.586
Initial NIHSS 8 (4–14) 7 (4–13) 6 (4–12) 7 (4–12) 0.001 7 (4–12) 0.016
BMI (kg/m2) 23.7 (3.4) 23.9 (3.4) 23.4 (3.4) 23.5 (3.5) 0.005 23.6 (3.4)
Situation <0.001 0.007
Wake-up 5 (1.8) 44 (2.5) 80 (6.1) 74 (8.2) 198 (5.0)
During sleep 3 (1.1) 20 (1.1) 41 (3.2) 34 (3.8) 95 (2.4)
During activity 233 (82.6) 1,452 (82.3) 928 (71.3) 569 (63.2) 2,949 (74.4)
Unknown 41 (14.5) 248 (14.1) 252 (19.4) 224 (24.9) 724 (18.3)
Workflow times (min)
OTT 52 (48–56) 90 (75–103) 150 (135–165) 218 (198–240) <0.001 130 (92–178) <0.001
DTT 26 (20–32) 38 (29–50) 42 (30–57) 41 (30–58) <0.001 40 (29–53) <0.001
OTD 25 (18–31) 48 (34–63) 105 (85–125) 173 (148–197) <0.001 80 (48–132) <0.001
TOAST 0.054 0.025
LAA 61 (21.6) 487 (27.6) 391 (30.1) 278 (30.9) 1,156 (29.1)
SVO 27 (9.6) 219 (12.4) 155 (11.9) 101 (11.2) 475 (12.0)
CE 102 (36.2) 568 (32.2) 397 (30.5) 258 (28.6) 1,223 (30.8)
OE 7 (2.5) 36 (2.0) 23 (1.8) 11 (1.2) 70 (1.8)
UD 85 (30.1) 454 (25.7) 335 (25.7) 253 (28.1) 1,042 (26.3)
Previous TIA 4 (1.4) 34 (1.9) 23 (1.8) 11 (1.2) 0.581 68 (1.7) >0.999
Previous stroke 45 (16.0) 262 (14.9) 239 (18.4) 139 (15.4) 0.063 640 (16.1) >0.999
History of CAD 32 (11.3) 174 (9.9) 138 (10.6) 87 (9.7) 0.767 399 (10.1) 0.475
History of PAD 0 (0.0) 12 (0.7) 9 (0.7) 0 (0.0) 0.022 21 (0.5) 0.395
HTN 164 (58.2) 1,126 (63.8) 867 (66.6) 604 (67.0) 0.018 2,597 (65.5) 0.014
DM 61 (21.6) 460 (26.1) 368 (28.3) 276 (30.6) 0.009 1,104 (27.8) 0.027
Dyslipidemia 62 (22.0) 517 (29.3) 340 (26.1) 253 (28.1) 0.036 1,110 (28.0) 0.032
Recent smoking 84 (29.8) 537 (30.4) 390 (30.0) 265 (29.4) 0.957 1,192 (30.1) 0.947
Atrial fibrillation 97 (34.4) 578 (32.8) 380 (29.2) 268 (29.7) 0.084 1,226 (30.9) 0.231
Prior antiplatelet 82 (29.1) 493 (27.9) 377 (29.0) 232 (25.7) 0.389 1,102 (27.8) 0.631
Prior anticoagulation 11 (3.9) 53 (3.0) 57 (4.4) 20 (2.2) 0.032 130 (3.3) 0.604
Prior antihypertensive 131 (46.5) 837 (47.4) 686 (52.7) 457 (50.7) 0.019 1,980 (49.9) 0.268
Prior statin 54 (19.1) 317 (18.0) 210 (16.1) 162 (18.0) 0.456 689 (17.4) 0.465
Prior antidiabetic 48 (17.0) 328 (18.6) 261 (20.1) 196 (21.8) 0.161 785 (19.8) 0.278
Multiterritory lesions 33 (11.7) 225 (12.8) 192 (14.8) 148 (16.4) 0.037 565 (14.2) 0.250
IV-tPA dose 0.043 0.470
0.6 mg/kg 57 (20.2) 407 (23.1) 281 (21.6) 237 (26.3) 925 (23.3)
0.9 mg/kg 225 (79.8) 1,357 (76.9) 1,020 (78.4) 664 (73.7) 3,041 (76.7)
Laboratory finding
WBC (103/µL) 8.05±2.76 8.03±2.78 8.32±3.01 8.67±3.23 <0.001 8.27±2.97 0.220
Hb (g/dL) 13.8±1.9 13.9±1.9 13.7±1.9 13.6±1.9 0.003 13.8±1.9 0.611
Platelets (103/µL) 220.4±67.1 224.2±68.3 227.4±67.6 224.0±69.2 0.335 225.2±68.3 0.252
Glucose (mg/dL) 132.3±44.7 138.0±51.3 144.8±60.0 147.5±58.8 <0.001 142.4±56.1 <0.002
LDL-C (mg/dL) 106.1±34.3 110.1±35.1 110.1±36.5 108.4±35.9 0.234 109.7±35.7 0.103
PT (INR) 1.04±0.17 1.03±0.14 1.04±0.29 1.03±0.13 0.266 1.03±0.20 0.496
SBP (mm Hg) 147.0±25.4 152.6±28.5 149.8±27.3 148.8±26.9 <0.001 150.8±27.8 0.015
Values are presented as mean±standard deviation, number (%), or median (interquartile range). P-values are from Pearson’s chi-square test, Fisher’s exact test, analysis of variance (ANOVA), or a Kruskal-Wallis test, where appropriate.
IV-tPA, intravenous tissue plasminogen activator; OTT, onset-to-treatment; mRS, modified Rankin Scale; NIHSS, National Institutes of Health Stroke Scale;
BMI, body mass index; DTT, door-to-treatment; OTD, onset-to-door; TOAST, Trial of Org 10172 in Acute Stroke Treatment; LAA, large artery atherosclerosis;
SVO, small vessel occlusion; CE, cardioembolism; OE, other etiology; UD, undetermined etiology; TIA, transient ischemic attack; CAD, coronary artery disease;
PAD, peripheral artery disease; HTN, hypertension; DM, diabetes mellitus; WBC, white blood cell; Hb, hemoglobin; LDL-C, low density lipoprotein cholesterol;
PT, prothrombin time; INR, international normalization ratio; SBP, systolic blood pressure.
Supplementary Table 2. Association between OTT time and functional and safety outcomes
Variable Crude OR (95% CI) P Adjusted OR (95% CI) P
mRS 0–1 at 3 months Binary
OTT ≤60 min 1.24 (0.97–1.58) 0.085 1.24 (0.94–1.63) 0.123
OTT 61–270 min Reference Reference
Categorical
OTT ≤60 min 1.43 (1.09–1.87) 0.009 1.42 (1.05–1.92) 0.025
OTT 61–120 min 1.30 (1.11–1.53) 0.002 1.25 (1.04–1.51) 0.016
OTT 121–180 min 1.09 (0.92–1.30) 0.334 1.09 (0.90–1.33) 0.364
OTT 181–270 min Reference Reference
Continuous
OTT, continuous, for every 30-min increase 0.94 (0.91–0.97) <0.0001 0.94 (0.91–0.98) 0.001 Death
Binary
OTT ≤60 min 0.87 (0.56–1.36) 0.547 0.81 (0.50–1.30) 0.376
OTT 61–270 min Reference Reference
Categorical
OTT ≤60 min 0.74 (0.46–1.18) 0.207 0.67 (0.40–1.13) 0.136
OTT 61–120 min 0.75 (0.58–0.99) 0.040 0.77 (0.57–1.04) 0.090
OTT 121-180 min 0.86 (0.65–1.14) 0.285 0.82 (0.60–1.12) 0.216
OTT 181–270 min Reference Reference
Continuous
OTT, continuous, for every 30-min increase 1.07 (1.01–1.12) 0.018 1.07 (1.01–1.13) 0.030
SICH Binary
OTT ≤60 min 0.87 (0.35–2.15) 0.757 0.87 (0.35–2.18) 0.761
OTT 61–270 min Reference Reference
Categorical
OTT ≤60 min 1.23 (0.44–3.49) 0.693 1.22 (0.42–3.48) 0.716
OTT 61–120 min 1.63 (0.87–3.05) 0.130 1.55 (0.82–2.93) 0.180
OTT 121–180 min 1.45 (0.74–2.82) 0.277 1.47 (0.75–2.88) 0.267
OTT 181–270 min Reference Reference
Continuous
OTT, continuous, for every 30-min increase 0.91 (0.81–1.02) 0.101 0.92 (0.81–1.03) 0.144
Adjustment variables: age, male sex, initial National Institutes of Health Stroke Scale score, history of stroke, hypertension, diabetes mellitus, atrial fibrillation, prior statin use, systolic blood pressure, glucose, tissue plasminogen activator dose, and Trial of Org 10172 in Acute Stroke Treatment (TOAST) classification.
OTT, onset-to-treatment; OR, odds ratio; CI, confidence interval; mRS, modified Rankin Scale; SICH, symptomatic intracerebral hemorrhage.
Supplementary Table 3. Annual trend in time-to-treatment variables
Year No. OTT (min) DTT (min) OTD (min) DTT ≤30 min (%) OTT ≤60 min (%) OTD ≤30 min (%)
2009 102 126.5 (90 to 160) 53.5 (40 to 75) 58.5 (30 to 107.8) 12.75 6.86 24.51
2010 113 114 (85 to 150.5) 48 (35 to 67) 60 (36.5 to 90) 15.04 4.42 15.93
2011 349 120 (91 to 156) 42 (34 to 54) 73 (45 to 110) 17.19 2.58 11.17
2012 417 130 (90 to 175) 41 (31 to 52) 84 (45 to 131) 22.30 4.32 13.43
2013 464 125 (88 to 175) 35 (27 to 46) 81.5 (49 to 133.8) 35.99 5.39 11.85
2014 565 124 (85 to 180) 36 (28 to 48) 76 (40.5 to 140) 33.98 8.32 15.22
2015 509 125 (82 to 174) 36 (26 to 48) 79 (43 to 133) 36.54 6.68 10.81
2016 554 128 (82.8 to 187) 36 (25 to 53) 77 (44 to 137.5) 35.20 8.84 9.93
2017 504 122 (86 to 181.5) 40 (29 to 56) 70 (40 to 124) 28.17 8.73 13.49
2018 477 121 (85 to 170) 38 (29 to 53) 70 (40 to 124) 28.51 6.71 12.16
Mar 2019 125 120 (85.5 to 178) 37 (27 to 49) 76 (46 to 124) 36.80 8.80 10.40
Per 1 year (95% CI) 0.19 (–1.12 to 1.50) –0.53 (–1.58 to 0.53) 0.67 (–0.42 to 1.77) NA NA NA
OR (per 1 yr, 95% CI) NA NA NA 1.09 (0.96 to 1.24) 1.12 (1.03 to 1.21) 0.97 (0.93 to 1.01)
P 0.774 0.327 0.229 0.171 0.005 0.192
Values are presented as median (interquartile range). P-value by generalized estimating equations linear regression or logistic regression models adjusted for age, sex and initial National Institutes of Health Stroke Scale scores.
OTT, onset-to-treatment; DTT, door-to-treatment; OTD, onset-to-door; CI, confidence interval; NA, not applicable; OR, odds ratio.
Supplementary Figure 1. Selection of the study population. TIA, transient ischemic attack; CRCS-K, Clinical Research Collaboration for Stroke in Korea; IV- tPA, intravenous tissue plasminogen activator; OTT, onset-to-treatment; DWI, diffusion weighted imaging; mRS, modified Rankin Scale.
Supplementary Figure 2. Unadjusted (A) and adjusted (B) modified Rankin Scale (mRS) score distributions according to onset-to-treatment (OTT) time. OR, odds ratio.
3,863 Patients excluded
2,415 Endovascular therapy (+/- IV-tPA treatment) 708 IV-tPA treatment at an outside hospital 331 OTT time >270 minutes
24 Unclear onset to IV-tPA treatment time 187 Stroke mimic or no ischemic lesions on DWI 198 No mRS score at 3 months
72,751 Patients with acute ischemic stroke or TIA in the CRCS-K registry (April 2008–March 2019)
8,111 Patients treated with acute reperfusion therapy
4,248 Patients included in the primary analysis
Unadjusted analysis
OR for favorable mRS shift 1.30 (1.05–1.61) OTT >60 min
OTT 0–60 min
▒0 ▒1 ▒2 ▒3 ▒4 ▒5 ▒6
▒0 ▒1 ▒2 ▒3 ▒4 ▒5 ▒6 OTT >180 min
OTT 121–180 min OTT 61–120 min OTT 0–60 min
20.73 21.89 16.19 13.31 10.72 7.94 9.23
26.24 21.63 16.67 13.83 8.51 4.96 8.16
18.20 18.99 23.30
20.87 22.14
22.22 14.32
16.37 17.01
16.20 12.99
12.07 10.65
11.45 10.20
8.99 8.69
6.86 10.77
9.38 8.33 26.24 21.63 16.67 13.83 8.51 4.96 8.16
A
Adjusted analysis
OR for favorable mRS shift 1.34 (1.08–1.67)
▒0 ▒1 ▒2 ▒3 ▒4 ▒5 ▒6
OTT >60 min 12.96 19.96 19.30 17.61 13.66 8.66 7.85
OTT 0–60 min 16.95 23.27 19.75 16.06 11.36 6.75 5.85
▒0 ▒1 ▒2 ▒3 ▒4 ▒5 ▒6 OTT 121–180 min
OTT 61–120 min OTT 0–60 min
OTT >180 min 11.03 18.02 18.70 18.23 14.96 9.86 9.19 12.32
14.24 19.38
21.18 19.18
19.62 17.85
17.17 14.06
12.84 9.00
7.92 8.19 7.02 23.24 19.81 16.12 11.39 6.765.83
B
16.84