J. KOSAE Vol. 30, No. 2 (2014) pp. 161~174 Journal of Korean Society for Atmospheric Environment DOI: http://dx.doi.org/10.5572/KOSAE.2014.30.2.161
상향식 자료를 이용한 온실가스 인벤토리의 품질 개선 방향 - 화학 , 금속 분야를 중심으로 -
Quality Improvement of Greenhouse Gas Inventories by the Use of Bottom-Up Data
최 은 화1)∙신 은 섭2)∙이 승 묵1),2),*
1)서울대학교 아시아에너지환경지속가능발전연구소
2)서울대학교 보건대학원 환경보건학과
(2014년 2월 8일 접수, 2014년 2월 25일 수정, 2014년 2월 25일 채택)
Eunhwa Choi
1), Eunseop Shin
2)and Seung-Muk Yi
1),2)*
1)
Asian Institute of Energy, Environment and Sustainability, Seoul National University
2)
Department of Environmental Health, Graduate School of Public Health, Seoul National University
(Received 8 February 2014, revised 25 February 2014, accepted 25 February 2014)
Abstract
The methodology report ‘2006 IPCC Guidelines for National Greenhouse Gas Inventories’ shows higher tier method can be a good practice, which uses country-specific or plant-specific data when calculating greenhouse gas emissions by country. We review the methodology report to present principles of using plant-level data and also examine examples of using plant-level data in chemical and metal industry in 20 countries for the purpose of quality improvement of national greenhouse gas inventories. We propose that Korea consider utilizing plant-level data, as reported according to ‘Greenhouse gas and Energy Target Management Scheme’, in the following order as a preference. First, the data can be utilized for quality control of Korea’s own parameters, when Tier 2 method is adopted and bottom-up approach is not applicable. Second, both plant-level data and IPCC default data can be used together, combining Tier 1 method with Tier 3 method. Third, we can also use acquired plant-level data and country specific parameters, combining Tier 2 method with Tier 3 method. Fourth, if the plant-level data involves all categories of emissions and the data is proven to be representative, we can apply Tier 3 method. In this case, we still need to examine the data to check its reliability by a consistent framework, including appropriate quality control.
Key words : Bottom-up, Greenhouse gas, Inventory, Plant-level data, Quality control
*Corresponding author.
Tel : +82-(0)2-880-2736, E-mail : [email protected]
1. 서 론
유엔기후변화협약 당사국 중 기후변화협약의 부속 서 I 국가로 분류되어 있는 선진국들은 2015년부터
‘국가 온실가스 인벤토리에 대한 2006 IPCC 가이드 라인(2006 IPCC 가이드라인)’에 따라 국가 온실가스 인벤토리를 작성하여 제출하여야 한다. 우리나라를 포함한 비부속서 I 국가 또한 매 2년을 주기로 국가 온실가스 인벤토리를 업데이트하여 제출하여야 하므 로 세계 각국은 가이드라인이 제시하는 원칙에 준하 여 온실가스 배출량을 산정하고 관련 체계를 정비하 기 위한 노력을 기울이고 있다. 신뢰성 있는 온실가 스 인벤토리를 구축하는 것은 온실가스 배출량을 감 축하기 위한 방안을 모색하고 다양한 감축정책의 효 과를 모니터링하기 위해 필요하므로 정확한 온실가 스 인벤토리의 구축은 매우 중요한 이슈라 하겠다. 각 국의 온실가스 인벤토리가 국제적인 신뢰성을 확보 하기 위해서는 유엔기후변화협약에서 제시한 투명성 (Transparency), 정확성 (Accuracy), 완전성 (Comple- teness), 일관성 (Consistence), 비교가능성 (Comparabi- lity)의 5원칙이 지켜져야 하며, 이러한 원칙은 국가 온실가스 인벤토리에 대한 품질보증 (Quality Assur- ance, QA)과 품질관리 (Quality Control, QC) 활동에 의해 구현될 수 있다 (IPCC, 2006). IPCC 가이드라인 에서 분류하고 있는 5대 배출원 카테고리 즉, 에너지, 산업공정, 농업, 산림과 토지이용 및 변화, 폐기물 중 산업공정 부문의 국가 온실가스 인벤토리는 우리나 라의 경우 통계 작성기관에서 생산하는 활동자료의 비중이 32.5%에 불과하여 5대 배출원 분류 중 활동 자료의 신뢰성이 가장 취약하다고 할 수 있다 (SRI, 2011). 그러나 2010년 기준 우리나라 총 온실가스 배 출량 중 산업공정 부문의 배출량은 약 9.4%로 에너 지 부문에 이어 2번째로 높은 배출 비중을 차지하고 있으므로 (GIR, 2012), 산업공정 부문 온실가스 인벤 토리에 대한 신뢰성 향상 대책이 시급한 실정이다. 더 욱이 2006 IPCC 가이드라인에 따라 금속, 화학부문 공 정 배출량을 산정하기 위해 필요한 대부분의 활동자 료는 국가 승인 통계가 아닌 관련 협회 혹은 개별 사 업장으로부터 수급이 가능하여 (KEMCO, 2012) 비회 원사의 정보 누락, 신규 사업장 정보 누락 등 다양한 문제점을 내포하고 있다(GIR, 2013; KEMCO, 2012).
이러한 가운데, 인벤토리의 정확도 향상을 위한 방안 으로 최근 국제적으로 활발히 논의되고 있는 상향식 자료의 활용을 고려해 볼 수 있다(IPCC, 2011). 국내 한 연구에서는 시군구 단위의 통계자료를 바탕으로 지자체별 온실가스 배출량을 비교한 바 있으나 (Lee
et al., 2008), IPCC 가이드라인에서 제시하는 사업장
수준의 자료를 활용하는 인벤토리 구축 방향이나 품 질개선에 대한 고찰은 전무하였다. 우리나라는 이미 온실가스∙에너지 목표관리제를 정착시켰고 배출권 거래제의 도입을 준비하고 있으므로 사업장 수준의 온실가스 정보를 인벤토리에 활용하여 활동자료 수 급문제, 우리나라 사업장의 공정특성을 반영한 인벤 토리 구축 등 수준 높은 단계(higher tier)에 의한 인 벤토리 구축과 품질개선을 꾀할 수 있을 것으로 판 단된다.본 연구에서는 2006 IPCC 가이드라인과, 부속서 I 국가가 2013년 유엔기후변화협약 사무국으로 제출 한 국가 온실가스 인벤토리 보고서를 중심으로 산업 부문 중 화학 및 금속 배출원 카테고리에서 상향식 자료의 직접 활용과 품질관리에의 활용을 분석하였 다. 그리고 우리나라에서 사업장 수준의 상향식 자료 를 활용하여 국가 온실가스 인벤토리의 신뢰성 개선 에 적용하기 위한 방안에 대해 고찰하였다.
2. 연구 방법
2. 1 2006 IPCC
가이드라인상의 상향식 자료 이용IPCC 가이드라인은 온실가스 인벤토리 작성의 전 단계에 걸쳐 품질을 담보하기 위한 가이던스를 제공 함으로써 국가 온실가스 인벤토리가 품질측면에서 평가되고 개선될 수 있도록 지원하는 역할을 한다 (IPCC, 2006). 본 연구에서는 2006 IPCC 가이드라인 에서 제시하고 있는 상향식 자료의 직접 이용방법과 화학, 금속분야 카테고리에 대한 품질관리 (Tier 2 QC) 방법을 살펴보았다.
2. 2
온실가스 인벤토리 보고서상의 상향식 자료 이용유엔기후변화협약 부속서 I 국가는 매년 국가 온실 가스 인벤토리 보고서를 작성하여 제출하고 있으며
이 가운데 가장 최근인 2013년에 제출된 20개국 (표 1)의 국가 인벤토리 보고서를 분석하여 화학, 금속분 야에서 사업장 단위의 정보를 이용한 인벤토리의 품 질개선 방법을 살펴보았다.
2. 3
사업장 수준의 온실가스 정보 보고제도와자료의 활용
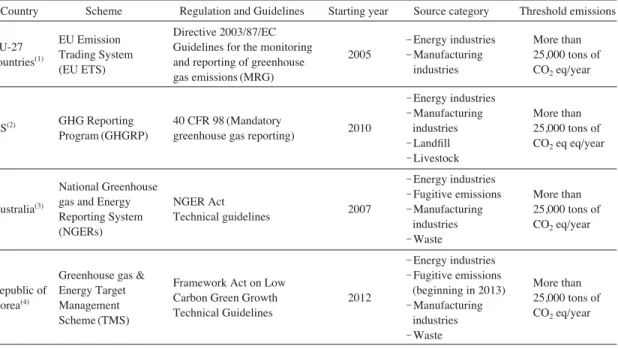
EU 27개국은 2005년부터 EU Emission Trading Scheme (EUETS)을 시작하였고, 미국은 2010년부터 Greenhouse Gas Reporting Programme (GHGRP)을, 호주는 2007년부터 National Greenhouse and Energy Reporting System (NGERs)를 시작하여 일정량 이상 의 온실가스를 배출하는 사업장을 대상으로 사업장 단위의 온실가스 배출량을 매년 보고받고 있다 (표
2). 우리나라에서는 저탄소 녹색성장기본법에 따라 2012년부터 온실가스∙에너지 목표관리제 (목표관리 제)를 실시하고 있으므로, EUETS, GHGRP, NGERs 의 사례로부터 상향식 자료의 인벤토리 활용방안을 고찰해 보고자 한다.
3. 결과 및 고찰
3. 1 2006 IPCC
가이드라인에 따른 상향식 자료의 이용2006 IPCC 가이드라인에서는 상향식 자료를 국가 인벤토리에 활용하기 위한 방안을 제공하고 있는데, 다음과 같이 정리될 수 있다. 첫째, 측정된 사업장 수
Table 1. Examined Annex I countries.
Countries
Annex I Austria, Australia, Canada, Denmark, Finland, Germany, Greece, Hungary, Iceland, Ireland, Italy, Japan, Netherlands, New Zealand, Norway, Poland, Portugal, Sweden, Switzerland, United Kingdom
Table 2. Greenhouse gas reporting scheme related to plant level data.
Country Scheme Regulation and Guidelines Starting year Source category Threshold emissions
EU Emission Directive 2003/87/EC
-Energy industries More than EU-27
Trading System Guidelines for the monitoring
2005 -Manufacturing 25,000 tons of countries(1)
(EU ETS) and reporting of greenhouse
industries CO2eq/year gas emissions (MRG)
-Energy industries
GHG Reporting 40 CFR 98 (Mandatory -Manufacturing More than
US(2)
Program (GHGRP) greenhouse gas reporting) 2010 industries 25,000 tons of
-Landfill CO2eq eq/year
-Livestock
National Greenhouse -Energy industries
gas and Energy NGER Act -Fugitive emissions More than
Australia(3)
Reporting System 2007 -Manufacturing 25,000 tons of
(NGERs)
Technical guidelines
industries CO2eq/year -Waste
-Energy industries Greenhouse gas &
Framework Act on Low -Fugitive emissions
More than Republic of Energy Target
Carbon Green Growth 2012 (beginning in 2013)
25,000 tons of Korea(4) Management
Technical Guidelines -Manufacturing
CO2eq/year
Scheme (TMS) industries
-Waste
(1)
EU (2013)
(2)
US EPA (2013a)
(3)
Department of the Environment (2013)
(4)
Ministry of Environment (2012a; 2012b)
준의 자료가 2~3 사업장 정도로 상향식 접근을 하 기에는 충분치 않을 경우 Tier 2 방법으로 기존에 적 용하고 있는 국가 고유 파라미터와 비교하여 국가 고유 변수의 합리성과 대표성을 검토한다. 둘째, 사업 장 수준의 자료가 해당 배출원 카테고리를 모두 포 함할 경우 Tier 3 방법으로 적용한다. 셋째, 측정된 사
업장 수준의 자료를 국가고유 변수와 함께 사용하여 Tier 2와 Tier 3을 함께 적용한다. 넷째, 주요 배출원 (key category)이 아닐 경우 사업장 수준의 자료를 IPCC 기본값과 함께 사용하여 Tier 1과 Tier 3을 함 께 적용한다. 이러한 내용은 고정연소 배출원을 예 로, 사업장 수준의 데이터 활용과 배출량 산정의 적
Fig. 1. Decision tree for estimating GHG emissions from stationary combustion (IPCC, 2006). Activity Data (AD)
정수준을 결정하는 의사결정도를 통해서도 확인할 수 있다(그림 1).
3. 2 2006 IPCC
가이드라인에 따른 국가 인벤토리의 품질관리온실가스 인벤토리의 일반적 품질관리 (Tier 1 QC) 는 데이터 수집, 계산, 가공, 문서화 등 모든 배출원과 흡수원 카테고리에 해당되는 반면, 특정 카테고리 품 질관리 (Tier 2 QC)는 일반적 품질관리 외에 추가적 으로 주요 배출원 (key category), 방법적인 수정이나 데이터 수정이 발생한 카테고리에 대해 적용하며 해 당 특정 카테고리에 대한 기술적 이해를 바탕으로 이루어진다.
2006 IPCC 가이드라인에서 제시하는 상향식 자료 를 이용한 Tier 2 품질관리, 혹은 상향식 자료에 대한 품질관리 내용은 다음과 같이 정리할 수 있다(IPCC, 2006). 첫째, 사업장 수준에서 개발된 배출계수는 현 장간 비교, IPCC 기본값이나 국가 고유값과 비교하 고 개발된 값 혹은 국가 고유 계수의 합리성과 대표
성을 검토한다. 둘째, 사업장에서 직접 측정된 데이터 의 특이사항에 대해서는 현장 담당자와 논의하고 현 장 자료에 유의한 불확실성이 있을 경우 보충적인 QC 활동을 장려한다. 또한 측정 절차가 공인된 국가 혹은 국제 기준에 부합하는지를 검토한다. 셋째, 활동 자료에 대해 현장간, 그리고 국가 데이터와 비교하여 주요한 누락이나 과산정을 검토한다. 현장의 생산량 을 플랜트 용량과 비교하여 생산데이터의 합리성을 가늠할 수 있고, 사업장 활동자료의 생산과 소비 밸 런스를 이용해서 합리성을 검토할 수도 있다.
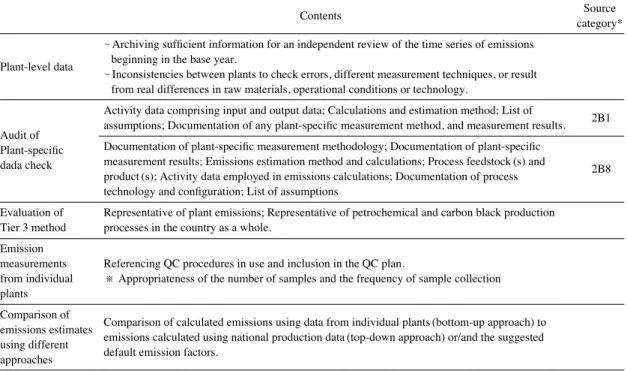
표 3과 표 4는 각각 2006 IPCC 가이드라인에서 제시하고 있는 화학, 금속 카테고리에서 적용될 수 있는 Tier 2 수준의 품질관리를 살펴본 것으로 앞서 설명된 상향식 자료와 관련된 품질관리 내용 외에 화학, 금속 배출원의 특징을 바탕으로 사업장 수준의 상향식 자료를 이용한 품질관리 방법을 요약하였다.
배출원 카테고리에 표기가 없는 것은 화학, 금속 각 각의 모든 배출원에 적용될 수 있는 품질관리 방법 임을 뜻한다.
Table 3. Tier 2 QC using plant level data in chemical industry.
Contents Source
category*
-Archiving sufficient information for an independent review of the time series of emissions Plant-level data beginning in the base year.
-Inconsistencies between plants to check errors, different measurement techniques, or result from real differences in raw materials, operational conditions or technology.
Activity data comprising input and output data; Calculations and estimation method; List of
2B1 Audit of assumptions; Documentation of any plant-specific measurement method, and measurement results.
Plant-specific Documentation of plant-specific measurement methodology; Documentation of plant-specific dada check measurement results; Emissions estimation method and calculations; Process feedstock (s) and
product (s); Activity data employed in emissions calculations; Documentation of process 2B8 technology and configuration; List of assumptions
Evaluation of Representative of plant emissions; Representative of petrochemical and carbon black production Tier 3 method processes in the country as a whole.
Emission
measurements Referencing QC procedures in use and inclusion in the QC plan.
from individual ※ Appropriateness of the number of samples and the frequency of sample collection plants
Comparison of
Comparison of calculated emissions using data from individual plants (bottom-up approach) to emissions estimates
emissions calculated using national production data (top-down approach) or/and the suggested using different
default emission factors.
approaches
*2B1 Ammonia Production; 2B2 Nitric Acid Production; 2B3 Adipic Acid Production; 2B4 Caprolactam, Glyoxal and Glyoxylic Acid Production;
2B5 Carbide Production; 2B6 Titanium Dioxide Production; 2B7 Soda Ash Production; 2B8 Petrochemical and Carbon Black Production; 2B9
Fluorochemical Production
3. 3
온실가스 인벤토리 보고서상의 상향식 자료의 이용20개 국가에서 2013년 제출한 국가 온실가스 인벤 토리 보고서로부터 화학, 금속 분야에서 수행된 Tier 2 품질관리는 다양한 형태로 분류될 수 있으나 (Shin
et al., 2013) 그 중에서 상향식 자료를 이용한 품질관
리와 인벤토리 활용사례를 살펴보고 구체적 내용을 표 5와 표 6에서 요약하였다(UNFCCC, 2013).유럽 국가들은 EUETS 제도하에 있는 기업의 상향 식 자료를 활용하고 뉴질랜드와 같이 자국 내 ETS 데이터를 활용하기도 한다. 이탈리아는 PRTR (Pollu- tant release and transfer register) 레지스트리에 보고된 값, 독일은 공동이행제도 (Joint Implementation, JI) 사 업의 결과와 비교하면서 품질관리를 수행한다. 노르 웨이는 EUETS 외에도 자발적 협약에 속한 사업장의 보고 자료를 인벤토리에 활용하고 있으며, 스웨덴은 사업장의 연례 환경보고서를 통해 배출량을 보고받 아 활용하고 있다. 그리스는 사업장별 정보를 취합하 여 인벤토리 시스템의 입력파일로 사용하고 있으며 온실가스 배출량의 산출을 위해서 해당 사업장과 협 력체계를 구축하고 있다고 밝혔다. 헝가리 또한 암모 니아, 질산, 알루미늄 생산 사업장으로부터 직접 획득 한 데이터의 이용으로 배출량의 품질과 신뢰성이 크
게 개선되었다고 한다. 노르웨이는 알루미늄 생산 사 업장이 자발적 협약에 따라 보고한 배출량과 활동자 료를 인벤토리 팀이 검토하는데, 오류가 발견되면 사 업장에 연락을 취해 보고된 데이터에 대해 논의하고 알루미늄 산업 관계자와 연례 회의 개최, 사업장에 대 한 정기 감사 수행 등 밀접한 관계를 유지하고 있다.
3. 4
사업장 수준의 온실가스 배출량보고제도와 자료의 활용
사업장 수준의 데이터가 인벤토리에 적절히 활용 된다면 무엇보다 데이터의 공간적 시간적 해상도 개 선과 데이터 카테고리의 세분화, 완화 영향의 산출 개선, 불확도 자체의 감소 등을 기대해 볼 수 있다 (IPCC, 2011). 사업장 온실가스 정보를 인벤토리에 활용하는 대표적 사례는 EU, 호주, 미국으로, 법적 근 거 하에 수집된 상향식 자료를 배출량, 활동자료, 배 출계수 측면에서 인벤토리에 활용하고 있다.
3. 4. 1 EU 배출권거래제도
2005년 EU 배출권거래제의 시작으로 EU 27개 국가 는 에너지산업, 제조산업에서 연간 25,000 CO2톤 eq.
를 초과하는 온실가스 배출 사업장을 대상으로 CO2
는 2005년부터, N2O는 2010년, 그 외 기체는 2013년 이후 보고하면서 그 범위를 점차 확대하고 있다
Table 4. Tier 2 QC using plant level data in metal industry.
Contents Source
category*
Check on double-counting or omission of emissions from reducing agents and process materials.
Review on inconsistencies between sites to check errors, different measurement techniques, or 2C1~
real differences in emissions, operational conditions or technology. 2C2
*Particularly relevant to the plant-specific estimates of amounts of reducing agents or reported 2C5~
carbon content of process materials. 2C6
Magnesium production volumes and process types; Cover gas with global warming potential
consumption/composition or magnesium production; Plant-level QA/QC results; Calculations 2C4 and estimation method; A list of assumptions
Comparison of aggregated plant-level estimates to industry totals for process materials consumption. 2C1
Aggregation of emissions estimates from each smelter to estimate total national emissions. 2C3 Comparison of aggregated individual plant-level estimate to national magnesium production data or (in the case of SF6) national consumption data attributed to magnesium use. 2C4
Assessment of
Review on the level of QC associated with the underlying data.
emission factors
*2C1 Iron and Steel Production; 2C2 Ferroalloys Production; 2C3 Aluminium Production; 2C4 Magnesium Production; 2C5 Lead Production; 2C6 Zinc Production
Site-specific activity data check
Comparison of emissions estimates using different approaches
(IPCC, 2011). EUETS 데이터는 특정 카테고리의 배 출량으로 직접 활용하거나 활동자료와 배출계수를 그대로 활용하는 등 다양한 방식으로 EU 온실가스 인벤토리 구축에 기여하고 있다 (IPCC, 2011; 표 7).
2010년에 제출된 EU 국가의 인벤토리 보고서를 살펴 보면 같이 24개 국가가 ETS 데이터를 품질관리/품질 보증 목적으로 사용하였으며 15개 국가가 ETS에 따 라 사업장별로 보고한 배출량을 직접 사용하고, 16개 국가는 국가고유 배출계수 개발을 목적으로, 10개 국 가는 활동자료를 국가 인벤토리에 활용하였다(IPCC, 2011; 표 7). 품질관리에 사용한 예는 앞서 살펴본 표 5와 표 6에서 더 자세히 확인할 수 있다.
3. 4. 2 호주 NGERS
Sturgiss (2010)는 호주의 국가 인벤토리가 대표성 있는 국가 고유계수를 사용하는 Tier 2 방법에서 NGERS의 도입으로 사업장별 배출계수를 새롭게 활 용하는 Tier 3 방법으로 전환 중이라고 밝혔다. 호주의 국가 온실가스 인벤토리는 주로 에너지, 산업공정, 폐 기물에서 Tier 2 방법을 사용 중이며, 예외적으로 전 기 생산을 위해 소모되는 연료와 지하 석탄광의 탈 루성 배출에 Tier 3 방법이 이미 사용되고 있는데, 이 는 NGERS 배출량의 약 50%를 차지한다 (Sturgiss, 2010). NGERS를 통해 역청탄, 갈탄, 천연가스, 탄층 메탄 연소의 탄소함량에 대한 사업장 수준의 상당한
Table 5. Nations’ Tier 2 QC using plant level data in chemical industry.
Country Source-specific Quality Control Source
category*
Australia Quality control assessment of the fulltime series of activity data, EFs and emissions estimates reported under NGERS.
Austria Natural gas input from energy balance checked for plausibility with ammonia production figures using the plant specific, conversion factor 0.451 t natural gas per tonne NH
3. 2B1
All activity data are site-specific and reported to industrial output statistics or reported due to
2B2, 2B10 monitoring of environmental or emissions permit of a company.
Finland Production data or calculated emission data of plants been checked with EU-ETS data or
2B2, 2B10 industrial output statistics.
Emission factors are based on accurate measurements of a company representing the best possible knowledge of that production process and equipment. 2B2
Only emissions figures among Information provided by producers be listed in the CRF tables due to Germany confidentiality protection. 2B3
The results of JI project compared with the inventory data.
All the information received by the plants is archived in the Input File of the Greek Inventory system.
Greece The main source for the estimation of emissions is the data received directly by the one plant 2B2 operating in Greece.
Emissions been checked with the relevant process operators and with data reported to the national 2B1, 2B2,
Italy EPER/E-PRTR registry. 2B3, 2B10
Emissions and activity data been checked against the relevant information reported by operator to 2B1,
the national competent authority for the ETS. 2B2, 2B3
Netherland The N
2O emissions of HNO
3production verified by EU-ETS. 2B2
The plant reports as required by the voluntary agreement and inventory team tracks emissions 2B1,
Norway and AD for the plants. 2B5, 2B6
The plants are covered by the EU ETS and their emissions are verified annually. Inventory team 2B2,
tracks the emissions and AD for the plants. 2B8, 2B10
Sweden Emissions are reported in the plant-specific environmental reports and studied annually to retrieve the most appropriate data for the GHG inventory.
*2B1 Ammonia Production; 2B2 Nitric Acid Production; 2B3 Adipic Acid Production; 2B4 Caprolactam, Glyoxal and Glyoxylic Acid Production;
2B5 Carbide Production; 2B6 Titanium Dioxide Production; 2B7 Soda Ash Production; 2B8 Petrochemical and Carbon Black Production; 2B9
Fluorochemical Production; 2B10 Other chemical industry
데이터가 수집되었고, 연료별 CO2배출계수를 기존 Tier 2 파라미터와 비교하여 일치성을 검토하였다 (Sturgiss, 2010).
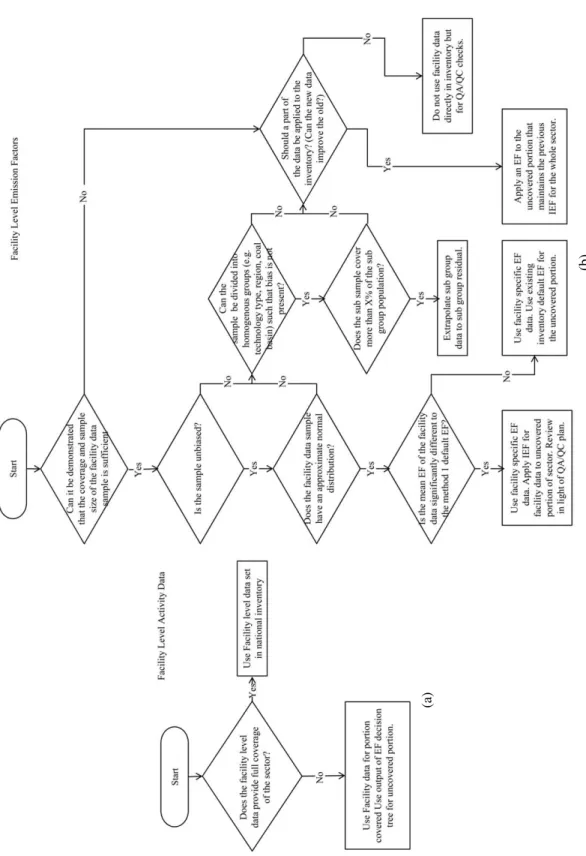
Sturgiss (2010)는 사업장 단위의 온실가스 배출 데 이터를 일관되게 사용하기 위하여 의사결정도를 제 시하였는데 (그림 2), 앞서 살펴본 2006 IPCC 가이드 라인과는 달리 Tier 1 배출계수의 활용을 고려하지 않고 있다. 또한, 사업장 수준의 데이터를 이용하기에 앞서 다음의 조건에 대한 검토가 필요함을 제시하고 있다. 첫째, 보고하는 사업장 수준의 데이터 샘플이
전체 모집단을 고려하여 합리적인 비율을 차지함으 로써 유의미해야 한다. 둘째, 샘플은 대표성을 갖추어 야 한다. 셋째, 샘플은 대략적으로 정규분포하고 균질 해야 한다. 그림 2에서와 같이 이러한 세 가지 조건 의 만족 여부에 따라 사업장 수준의 배출계수의 부 분적 사용, 사업장 수준 배출계수의 외삽을 통한 사 용을 결정하게 되며, 사용시 인벤토리를 개선할 수 없다면 인벤토리에 직접 사용되지 못하고 국가고유 계수의 합리성을 검토하기 위한 QA/QC 툴로써 사용 된다. 활동자료의 경우, 사업장 수준의 데이터가 전체
Table 6. Nations’ Tier 2 QC using plant level data in metal industry.
Country Source-specific quality control Source
category*
Germany Specific PFC emissions during anode effects were determined via industry measurements carried out in 1996 and 2001 at all plants in Germany. 2C3
In order to ensure the quality of the estimation, each plant’s reports are checked in two ways: following the time-series trend of the specific plant; comparing each plant’s report with the general trend for
the current year. 2C1
Greece All the data gathered in the Input File of the Inventory at the end of the annual inventory circle.
Plant specific production data collected by the inventory team whenever available.
In the recent years, the estimations of both CO
2and PFCs emissions from aluminum production being conducted in close cooperation with the respective Greek plant. 2C3
Emissions from the sector checked with the relevant process operators.
Production supplied by national statistics and the only national producer ALCOA, in addition with data
reported in a site-specific study, been checked. 2C3
Italy Emissions been checked with data reported under EU-ETS.
Emissions from magnesium foundries annually compared with those reported in the national EPER/
E-PRTR registry while for the iron and steel sector emissions reported in the national EPER/E-PRTR 2C1 registry and under the Emissions Trading Scheme. 2C4
New Zealand Reported estimates of CO
2emissions verified with data provided by the two steel producers under the NZ ETS. 2C1
The plant is covered by the EU ETS and their emissions are verified annually. Inventory team tracks 2C1 Norway emissions, AD and IEF for the plant.
The plants report as required by the voluntary agreement. Inventory team tracks emissions and AD 2C2,
for the plants. 2C3, 2C7
Poland Data on selected production compared to data collected from installations/entities covered by the EUETS.
All plants report their emissions in environmental reports. For plants included in the EU ETS
the report data is scrutinized and compared to EU ETS data. 2C1
Sweden Detailed carbon mass balances compiled for plants under EU ETS.
CO
2emissions reported by the plant. 2C2
Both plants report their emissions in yearly environmental reports. For the one plant included in the EU-ETS the reported activity data and emissions are analysed and compared to EU-ETS data. 2C7
*2C1 Iron and Steel Production; 2C2 Ferroalloys Production; 2C3 Aluminium Production; 2C4 Magnesium Production; 2C5 Lead Production; 2C6
Zinc Production; 2C7 Other
섹터를 포함할 경우 국가 인벤토리에 그대로 사용될 수 있으나 부분적일 경우 배출계수에 대한 의사결정 도에서와 같은 검토를 거쳐 이용될 수 있다.
3. 4. 3 미국의 온실가스 보고 프로그램
40 CFR 98은 GHGRP의 의무적 온실가스 보고에 대해 규정하고 있다. 미국 내 8,000곳 이상의 사업장 이 GHGRP에 참여함에 따라 미국 총 온실가스 배출 량의 약 85~90%가 관리되고 있다(US EPA, 2013a).
또한, 시멘트, 알루미늄 생산, 암모니아 생산 등 일부 산업부문의 경우 모든 사업장이 배출량을 보고하게 되어 있어 상향식 자료를 이용한 국가 온실가스 인벤 토리화가 가능하다 (IPCC, 2011). 온실가스 데이터는 e-GGRT (The Electronic Greenhouse Gas Reporting Tool)를 통해 전자적인 형태로 EPA로 보고되며, 보고 된 자료는 웹 페이지(FLIGHT, Facility Level Informa- tion on GreenHouse gas Tool)를 통해 대중에게 공개 되고 있으며 주별, 사업장별, 온실기체별, 산업 그룹별,
Table 7. Use of ETS data for the purposes of the national GHG inventory (IPCC, 2011)*.
Member state Status of use of
Use of emissions Use of activity data Use of emission Use for quality
ETS data factors assurance
Austria Used
Belgium Used
Bulgaria Not analyzed
Cyprus Used
Czech Republic Used
Denmark Used
Planned to use for Estonia verification in 2011
submission
France Used
Finland Used
Germany Used
Greece Used
Hungary Used
Ireland Used
Italy Not analyzed
Latvia Used
Lithuania Not indicated
Luxembourg Not analyzed
Malta Used
Netherlands Used
Poland Not analyzed
Portugal Used
Romania Used
Slovakia Used
Slovenia Used
Spain Used
Sweden Used
United Kingdom Used
*Analyzed based on 2010 submissions
Fig. 2. Decision tree for selecting plant level data (a) plant level activity data; (b) plant level emission factor (Sturgiss, 2 010).
(a) (b)
배출량 범위별로 검색이 가능하다(US EPA, 2013b).
4. 우리나라의 국가 인벤토리 품질개선 방향
4. 1
우리나라의 화학,
금속 배출원2010년 기준 우리나라의 온실가스 총 배출량은 669백만 CO2톤 eq.이며 이중 산업공정은 62.67백만 CO2톤 eq.으로 9.4%를 차지하고, 화학과 금속의 배 출량은 각각 약 0.87백만 CO2톤 eq., 0.20백만 CO2
톤 eq.으로 총 배출량 중 0.13%, 0.03%를 차지한다 (GIR, 2012; 그림 3). 이러한 배출비중은 산업공정 카 테고리 내 화학과 금속산업의 공정배출만을 대상으 로 한 것이며, 화학과 금속산업에서 비롯되지만 인벤 토리의 고정연소 배출원에서 계상되는 온실가스 배 출량을 고려한다면 약 5.25%, 12.02%의 배출량이 추 가되어야 한다(GIR, 2012). 목표관리제에서 보고되는 온실가스 배출량은 해당 배출원의 고정연소와 공정 배출을 포함한 사업장별 온실가스 배출량이지만 국 가 인벤토리에서 고정연소는 에너지부문에서, 공정배 출은 산업공정 부문으로 구분되어 온실가스 배출량 이 산정 및 보고되고 있는 실정이다.
우리나라의 국가 온실가스 인벤토리는 현재까지 IPCC Good Practice Guidance and Uncertainty Mana- gement in National Greenhouse Gas Inventories (2000 GPG) 수준에서 작성되고 있는데 우리나라가 2006
IPCC 가이드라인에 따라 인벤토리를 구축할 경우 추 가적으로 고려하여야 하는 화학, 금속분야 배출원을 표 8에서 비교하였다. 2012년에 작성된 국가 인벤토 리 보고서를 기준으로 인벤토리에서 산정되고 있는 배출원은 목표관리제에서 모두 보고되고 있으며 목 표관리제는 2006 IPCC 가이드라인에서 추가된 배출 원을 다수 포함하고 있음을 알 수 있다.
4. 2
상향식 자료를 이용한 품질개선 방향우리나라는 저탄소 녹색성장기본법에 근거하여 제 도 운영에 필요한 절차와 방법을 담은「온실가스∙
에너지 목표관리 운영 등에 관한 지침」(환경부 고시 제2012~211호)을 고시하였다 (MOE, 2012a). 업체별 감축목표의 설정, 온실가스 배출량의 산정∙보고∙검 증(MRV) 방법 등에 관한 세부기준과 절차가 마련되 고, 국가 온실가스 배출량의 2/3를 차지하는 대규모 관리업체가 감축목표를 이행함으로써 2012년부터 목표관리제가 본격적으로 시행되었다(MOE, 2012b).
우리나라는 2006 IPCC 가이드라인에 따른 온실가 스 인벤토리 구축을 준비하고 있으나, 화학, 금속 분 야 온실가스 배출량을 산정하기 위한 활동자료가 국 가 통계화 되어 있지 않아 인벤토리 구축에 큰 걸림 돌이 되고 있다(GIR, 2013). 제품 생산량이나 원료사 용량 등의 활동자료를 국가 통계화하는 방안을 논의 하고 있는 가운데, 앞서 살펴본 각국 사례와 같이 우 리나라의 목표관리제를 통해 보고되는 사업장별 활 동자료 혹은 배출량의 직접 활용방안을 고려해 볼 수
Fig. 3. Sectoral GHG emissions in Korea in 2010 (a) Sectoral GHG emissions (unit: million tons of CO
2equivalent; %);
(b) GHG emissions in Industrial Process and Product Use (unit: million tons of CO
2equivalent).
(a) (b)
Industrial process and
product use (62.67, 9.4%) Agriculture (21.26, 3.2%)
Waste (14.18, 2.1%)
Mineral products (30.80)
Chemical industry (0.87)
Metal production (0.20) Consumption of
halocarbons and SF
6(30.80)
Energy
(570.70, 85.3%)
있을 것이다. 미국의 알루미늄, 암모니아 생산과 같이 국가 인벤토리와 사업장 수준에서 보고되는 대상 사 업장이 동일한 경우 활동자료와 배출량을 직접 사용 할 수 있다 (IPCC, 2011). 노르웨이의 경우 사업장이 배출 허용량, EUETS, 자발적 협약에 따라 연간보고 서를 전자적으로 제출하기 때문에 인벤토리 작성자 가 철강, 합금철 생산, 1차 알루미늄, 니켈 생산, 전극 (Anode) 제조 등 많은 카테고리에 대한 사업장 데이 터의 접근이 가능하다고 한다(UNFCCC, 2013). 인벤 토리 보고서와 함께 제출되는 CRF (Common Report- ing Format)에 보고된 합금철 생산의 활동자료는 사 업장이 보고한 데이터를 활용한 것이다 (UNFCCC, 2013). 우리나라의 예를 살펴 보자면, 금속산업 중 납
은 국내에서 한 곳, 아연의 경우 두 곳에서만 생산되 며 목표관리제에 따라 관련 정보를 보고하고 있어, 이 활동자료와 배출량을 이용한다면 해당 배출원 카 테고리에서는 Tier 3 방법에 의한 인벤토리 구축이 가 능하다. 비철금속 산업의 경우 2006 IPCC 가이드라 인의 공정과 국내 공정 특성이 달라서 가이드라인에 서 제시하는 기본 배출계수를 이용한 배출량 산정이 적절하지 않으므로 (MOE, 2014), Tier 3 수준의 인벤 토리 작성에 대한 적극적인 검토가 요구된다. 국내 석유화학 배출원 역시, 동일 물질을 생산하지만 에너 지 효율 극대화를 위하여 개별 기업 차원의 공정 최 적화를 진행한 결과, 생산현장에 따라 서로 다른 공 정과 기술이 적용되므로, IPCC 가이드라인의 적용은
Table 8. Comparisons of source categories covered in 2006 IPCC guidelines, 2000 good practice guidance, national
inventory report of ROK, and target management scheme (GIR, 2012; IPCC, 2000; IPCC, 2006; MOE, 2012a).
2000 Inventory of Target 2006 IPCC Guideline
GPG* ROK Management
(as of 2012 NIR) Scheme 2B Chemical Industry
2B1 Ammonia Production 2B2 Nitric Acid Production 2B3 Adipic Acid Production
2B4 Caprolactam, Glyoxal and Glyoxylic Acid Production 2B5 Carbide Production
2B6 Titanium Dioxide Production 2B7 Soda Ash Production
2B8a Methanol NE
2B8b Ethylene
2B8c Ethylene Dichloride and Vinyl Chloride 2B8 Petrochemical and Carbon
Monomer Black Production
2B8d Ethylene Oxide 2B8e Acrylonitrile 2B8f Carbon Black 2B9 Fluorochemical Production 2B9a By-product Emissions
2B9b Fugitive Emissions 2B10 Other (please specify)
2C Metal Industry
2C1 Iron and Steel Production
2C2 Ferroalloys Production
2C3 Aluminium Production
2C4 Magnesium Production
2C5 Lead Production
2C6 Zinc Production
2C7 Other (please specify)
물론 국가 고유 파라미터의 적용도 적절치 않은 상 황이다 (MOE, 2014). 따라서, 사업장 수준의 자료를 이용하는 Tier 3 방법에 의해 인벤토리를 구축하는 것 이 국내 화학, 금속 산업 공정상의 특수성을 반영할 수 있는 최선의 방법임을 짐작할 수 있다.
그러나, 이와 같이 모든 배출원 카테고리에 사업장 수준의 데이터로 인벤토리를 구축할 수 있는 것은 아 니다. 목표관리제 대상 관리업체는 연간 25,000 CO2 톤 eq. 이상의 배출량을 보고하고 있으나 인벤토리는 소규모 배출 사업장을 포함하고 있다. 즉, 상향식 자 료가 배출원 카테고리별로 인벤토리상의 모든 배출 원을 포함하고 있다면 그대로 이용할 수 있으나 그 렇지 않은 경우 일관된 프레임웍에 따른 활용 방법 을 결정해야 한다. 호주는 그림 2와 같은 의사결정도 에 따라 사업장 수준의 자료 이용방법을 채택하고 있 다. 그러나 호주는 인벤토리에서 국가 고유 배출계수 를 사용하는 경우가 일반적이고 우리나라는 국가 인 벤토리에서 고유 배출계수를 적용하고 있는 배출원 이 매우 적으므로 2006 IPCC 가이드라인에서 고정연 소 배출원에 대해 제시하고 있는 의사결정도(그림 1) 를 이용하여 상향식 자료의 활용을 점차 확대해 갈 수 있다. 첫 단계로, 상향식 접근을 하기에 충분치 않 을 경우 Tier 2 방법으로 적용하고 있는 국가 고유 파 라미터의 품질관리에의 활용, 두 번째, 사업장 수준의 자료를 IPCC 기본값과 함께 사용하여 Tier 1과 Tier 3을 병용, 세 번째, 측정된 사업장 수준의 자료를 국 가고유 변수와 함께 사용하여 Tier 2와 Tier 3 병용, 네 번째, 사업장 수준의 자료가 해당 배출원 카테고 리를 모두 포함하고 대표성이 충분할 경우 Tier 3 방 법으로 적용하는 것이다.
두 데이터 간의 영역차이 이외에 목표관리제와 같 은 사업장 수준의 데이터 이용시 고려해야 할 점은 에너지 관련 배출원과 산업공정 배출원의 구분으로 인한 차이이다. 산업 생산시설에 포함된 연료 연소와 공정 배출에 의한 활동자료와 배출량이 목표관리제 에서는 세부 자료와 함께 통합 보고되는 반면, 국가 인벤토리에서는 에너지 부문과 산업공정 부문으로 구분되어지므로 사업장 수준의 자료를 국가 인벤토 리에 활용하기 위해서는 목표관리제에 따라 보고된 세부내역을 이용한 재할당이 필요하다 (MOE, 2012a;
IPCC, 2011). 해상도가 높은 사업장 수준의 자료를 이 용하여 인벤토리에서 부문간 할당의 정확성을 높이는
데 활용하는 것이다. 다음으로 고려할 것은 이용되는 배출계수와 배출량 산정방법의 차이이다 (GIR, 2012;
MOE, 2012a). 현재 시점에서 국가 인벤토리는 2000 GPG 수준에서 작성되고 있으나 목표관리제에 적용된 배출원과 배출량 산정방법은 이에 준하고 있지 않은 경우가 대부분이다. 배출계수 또한 2006 IPCC 가이드 라인에 근거하여 제시된 경우가 많고 사업장 자체적 으로 개발한 사업장 고유 배출계수를 이용하는 경우 도 점차 늘어가고 있어 기본값을 이용하는 인벤토리 와는 결과값에 차이가 발생할 수 밖에 없다. 따라서, 사업장 수준의 자료를 활용하고자 한다면, 적용된 배 출량 산정방법과 배출계수 적용의 일치성과 시계열 상의 일관성을 확인하여 사용여부와 사용방법을 결 정하여야 한다.
위 사항을 모두 고려한다 할지라도 사업장 수준의 자료 활용시 주의해야 할 점이 있다. 그것은 상향식 자료라고 하여 보다 정확하다고 전제해서는 안 되며, 사업장 운영자와의 논의를 포함할 수 있는 적절한 품 질관리에 대한 검토를 거쳐야 한다는 것이다 (IPCC, 2011). 2006 IPCC 가이드라인에서 제시한 상향식 자 료의 Tier 2 QC 절차(표 3, 4)를 거친 후 상향식 자료 의 품질이 우수하다고 판단된다면 일관된 프레임웍 에 따라 국가 인벤토리에 직접 활용 혹은 품질관리 에 활용할 수 있을 것이다.
5. 결 론
온실가스 인벤토리의 품질을 개선하기 위한 국제 적인 노력은 최근 축적되어 가고 있는 상향식 자료 와 국가 인벤토리 간의 조화, 상향식 자료의 적극적 활용방안을 모색하는 데에 모아지고 있다. 본 연구에 서는 활동자료의 국가 승인통계 비율이 낮은 화학, 금속산업에 중점을 두어 목표관리제 등에서 확보될 수 있는 사업장 수준의 온실가스 자료를 활용하는 방안에 대해 검토하였다. 우리나라에서도 일관된 의 사결정 프레임웍을 확립하고 사업장 수준의 자료에 대한 품질과 대표성 등을 검토한 후, 품질관리에의 활용에서부터 Tier 1 방법과 Tier 3의 혼합, Tier 2 방 법과 Tier 3의 혼합, 단일 Tier 3 방법 사용을 단계별 로 시도해 볼 수 있을 것이다. 사업장 수준 온실가스 자료는 활동자료의 수급문제를 해결하거나 품질관리
에 이용될 수 있으며, 국내 산업공정의 특수성을 반 영한 배출량 보고를 가능하게 하므로 사업장 수준의 온실가스 자료 이용 계획을 수립하여 인벤토리 구축 방식을 단계적으로 고도화시켜 나가야 한다.
감사의 글
본 연구는 환경부 “기후변화대응 환경기술개발사 업”의 지원을 받아 수행된 연구이며 이에 감사드립 니다.
References
Department of the Environment (2013) Technical guidelines, http://www.climatechange.gov.au/climate-change/
greenhouse-gas-measurement/national-greenhouse- and-energy-reporting/(accessed 14.02.06).
EU (2013) EU ETS fact sheet, http://ec.europa.eu/clima/pub lications/docs/factsheet_ets_en.pdf/(accessed 14.02.
06).
Greenhouse gas Inventory and Research center of Korea (2012) 2012 National greenhouse gas inventory of Korea.
Greenhouse gas Inventory and Research center of Korea (2013) Study on prediction of national greenhouse gas emis- sions considering 2006 IPCC guidelines and new sources. (in Korean)
IPCC (2000) IPCC Good Practice Guidance and uncertainty management in national greenhouse gas inventories.
IPCC (2006) 2006 IPCC guidelines for national greenhouse gas inventories.
IPCC (2011) Use of models and facility-level data in greenhouse gas inventories (Report of the IPCC expert meeting on use of models and measurements in GHG Inven- tories, 9-11 August 2010, Sydney, Australia) eds:
Eggleston H.S., Srivastava N., Tanabe K., Baasan-
suren J., Fukuda M., Pub. IGES, Japan 2011.
Korea Energy Management Corporation (2012) Final report on build up of compilation system of greenhouegas inventory in industrial process (chemical and metal industry). (in Korean)
Lee, S.B., J.H. Hong, D.G. Kim, S.H. Lee, J.A. Lee, and S.A.
Lee (2008) Development of GHG emission inven- tory by bottom-up approach and analysis of emis- sion characteristics, Proceeding of the 47thMeeting of KOSAE. (in Korean with English Abstract) Ministry of Environment (2012a) Guidelines on target manage-
ment of greenhouse and energy. (in Korean) Ministry of Environment (2012b) 2012 White paper of Envi-
ronment of Korea.
Ministry of Environment (2014) Development of technology for advancing GHG inventory in IPPU for the appli- cation of 2006 IPCC Guidelines.
Rob Sturgiss (2010) The use of facility-specific emission fac- tor data in Australia’s national Inventory, Invited background paper to the IPCC Experts Meeting, Sydney, Australia, 9-11 August 2010.
Shin, E.S., E.H. Choi, and S.M. Yi (2013) A case study on sector-specific quality assurance and quality control on national greenhouse gas inventory in industrial sector, Proceeding of the 56thMeeting of KOSAE.
(in Korean with English Abstract)
Statistical Research Institue (2011) Basic study for improve- ment of greenhouse gas inventory (industrial pro- cess). (in Korean)
UNFCCC (2013) National inventory submissions, http://unfccc.
int/national_reports/annex_i_ghg_inventories/natio nal_inventories_submissions/items/6598.php/(acce- ssed 14.02.06).
US EPA (2013a) GHGRP fact sheet, http://www.epa.gov/
ghgreporting/documents/pdf/2009/FactSheet.pdf/
(accessed 14.02.06).
US EPA (2013b) 2012 Greenhouse Gas Emissions from Large Facilities, http://ghgdata.epa.gov/(accessed 14.02.
06).