1. Introduction
In spite of the abundance and wide variety of its water resources, the Philippines still confronts serious problems concerning water quality, accessibility, water shortage and temporal distribution.
According to World Fact Book, the Philippines, an archipelago of some 7,107 islands, only 2,000 of which are inhabited, is geographically considered a medium-sized nation with a total area of 300,000 km
2: 298,170 km
2land area and 1,830 km
2water area. There are three major island groups in the country, namely:
Luzon, which has seven regions; Visayas, with only three regions; and Mindanao which has six regions. The islands are home to almost 88 million people with a population growth rate of
1.84 percent (Central Intelligence Agency, 2005).
The country is abundant in terms of water resources. Overall, the Philippines' total available freshwater resource is at 145,990 MCM/year (million cubic meter per year) based on the 80 percent probability for surface water, and groundwater recharge or extraction at 20,200 MCM/year.
2. Water Resources
Philippines, as reported by Philippine Environment Monitor, is endowed with rich natural resources, including water, which is essential for the country’s economic development.
The country is classified into 12 water resources regions, which are defined by hydrological boundaries, physiographic features and climate
필리핀의 수자원 평가
Rubio, Christabel Jane * / 이 주 헌 ** / 정 상 만 ***
+Water Resources Evaluation in the Philippines
Rubio, Christabel Jane / Lee, Joo Heon / Jeong, Sang Man***
+Abstract : This paper sought to provide information regarding the water resources in the Philippines, focusing on the issues of water quality, status of water use and water scarcity, and other threats to water availability. Although the country has sufficient amount of water resources, it was found out that water availability is still threatened by some major water resources problems: increasing water demand due to drastic growth in population, water resources pollution, droughts and flooding and weak institutional framework to address these problems. Water quality problems include increasing groundwater and surface water pollution. Moreover, drought and flooding have also increased damages in recent years due to deteriorating watersheds and high economic and population growth. In relation to these, the government enacted national laws to define and deal with water control and quality management. The objective of this research was to present and evaluate current conditions and issues on Philippine water resources.
Keywords : water scarcity, drought, flooding, Philippines
+ Corresponding author : [email protected]
* Graduate Student, Department of Civil and Environmental Engineering, Kongju National University
** Member, Assistant Professor, Department of Civil and Environmental Engineering, Joongbu University
*** Member, Corresponding Author, Professor, Department of Civil and Environmental Engineering, Kongju National University
homogeneity, total of which is 1,830 km
2, about 0.61% of the total area (World Bank Group, 2003; Department of Environment and Natural Resources, 1999). Water resources of the Philippines include rainfall, inland freshwater (rivers, lakes, and groundwater), and marine (bay, coastal, and oceanic waters).
State of Water Resources in the Philippines reports that as a tropical country, rainfall ranges from 1,000 mm in some sheltered valleys to 5,000 mm in the mountainous parts of the country per year, of which 1,000-2,000 mm are collected as runoff by a natural topography with significant variation from one area to another due to the direction of the moisture-bearing winds and the location of the mountain ranges (Greenpeace, 2007).
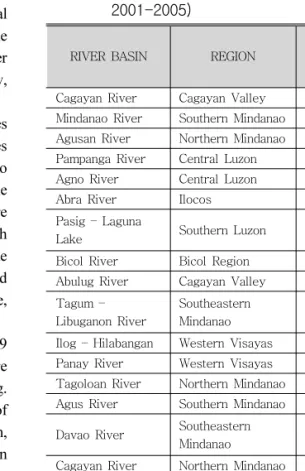
There are 421 principal river basins in 119 proclaimed watersheds. Of these, 18 are considered major river basins as illustrated in Fig.
1 and shown in Table 1. These are sources of municipal and domestic water supply, irrigation, and power generation. Cagayan River Basin in Cagayan Valley is the largest with a drainage area of 25,649 km
2.
Fig. 1. Major River Basins and 12 Water Regions in the Philippines
Table 1. Major River Basins in the Philippines (Environmental Management Bureau, 2001-2005)
RIVER BASIN REGION
DRAINAGE AREA
(km
2) Cagayan River Cagayan Valley 25,649 Mindanao River Southern Mindanao 23,169 Agusan River Northern Mindanao 10,921 Pampanga River Central Luzon 9,759
Agno River Central Luzon 5,952
Abra River Ilocos 5,125
Pasig – Laguna
Lake Southern Luzon 4,678
Bicol River Bicol Region 3,771
Abulug River Cagayan Valley 3,372 Tagum –
Libuganon River
Southeastern
Mindanao 3,062
Ilog – Hilabangan Western Visayas 1,945 Panay River Western Visayas 1,843 Tagoloan River Northern Mindanao 1,704 Agus River Southern Mindanao 1,645 Davao River Southeastern
Mindanao 1,623
Cagayan River Northern Mindanao 1,521 Jalaud River Western Visayas 1,503 Buayan –
Malungun River
Southeastern
Mindanao 1,434
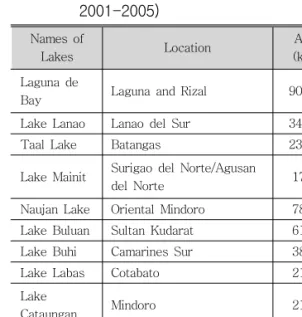
The Bureau of Fisheries and Aquatic Resources reports that there are 79 lakes in the country mostly utilized for fish production. In fact, 10 are considered major host for aquaculture production as presented in Table 2.
Laguna Lake is the largest with a total area of 3,813.2 km
2(including watershed area and lake proper) and is also one of the largest lakes in Southeast Asia. Lake Lanao, the largest lake in Mindanao, is one of the 17 ancient lakes on earth and is a major source of hydropower (Environmental Management Bureau, 2001-2005).
As indicated in the Philippine Environment
Monitor (PEM) – Water Quality, the country has
extensive reservoir in terms of groundwater, with
an aggregate area of 50,000 km
2. Groundwater is
replenished or recharged by rain and seepage from
Table 2. Ten Major lakes in the Philippines (Environmental Management Bureau, 2001-2005)
Names of
Lakes Location Area
(km
2) Laguna de
Bay Laguna and Rizal 900.00
Lake Lanao Lanao del Sur 347.00
Taal Lake Batangas 233.56
Lake Mainit Surigao del Norte/Agusan
del Norte 17.43
Naujan Lake Oriental Mindoro 78.99 Lake Buluan Sultan Kudarat 61.34
Lake Buhi Camarines Sur 38.00
Lake Labas Cotabato 21.40
Lake
Cataungan Mindoro 21.11
Lake Bato Camarines Sur 18.00
TOTAL 1,903.71
rivers. It contributes 14 percent of the total water resource potential in the Philippines. As noted in Table 3, the recharge or extraction potential is estimated at 20,200 MCM/year. Based on the water rights granted by the National Water Resources Board (NWRB) since 2002, 49 percent
of groundwater is consumed by the domestic sector, and the remaining shared by agriculture (32 percent), industry (15 percent) and other sectors (4 percent). In terms of sectoral demand, agriculture has a high demand of 85 percent, while the industry and domestic have a combined demand of only 15 percent (World Bank Group, 2003).
Philippine maritime territorial waters cover about 2.2 million km
2, wherein 267,000 km
2are coastal waters and 1.934 million km
2are oceanic waters within the exclusive economic zone (EEZ).
The country's total discontinuous coastline is approximately 32,400 kilometers with eighty percent of the provinces and 65 percent of the cities and municipalities sharing the coast.
3. Quality of Water Resources 3.1 Water Quality Classification
Data from the Environmental Management Bureau (EMB) show that as of 2005, it has classified 525 water bodies in terms of best usage and water quality, representing 62.5 percent of the inventoried water bodies in the country. Of these
Water Resources Region Ground water Potential
Surface Water Potential
Total Water Resources Potential
Percent Groundwater to
Total Potential
X Northern Mindanao 2,116 29,000 31,116 6.80
VI Western Visayas 1,144 14,200 15,344 7.45
IX Western Mindanao 1,082 12,100 13,182 8.21
XII Southern Mindanao 1,758 18,700 20,458 8.59
XI Southeastern Mindanao 2,375 11,300 13,675 17.37
III Central Luzon 1,721 7,890 9,611 17.91
IV Southern Tagalog 1,410 6,370 7,780 18.12
VIII Eastern Visayas 2,557 9,350 11,907 21.47
II Cagayan Valley 2,825 8,510 11,335 24.92
V Bicol 1,085 3,060 4,145 26.18
I Ilocos 1,148 3,250 4,498 27.75
VII Central Visayas 879 2,060 2,939 29.91
TOTAL 20,200 125,790 145,990 13.84
Table 3. Groundwater Availability (in MCM) (World Bank Group, 2003)
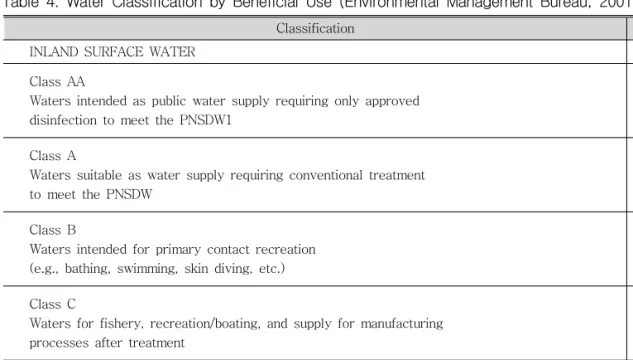
Table 4. Water Classification by Beneficial Use (Environmental Management Bureau, 2001-2005)
Classification Number
INLAND SURFACE WATER Class AA
Waters intended as public water supply requiring only approved disinfection to meet the PNSDW1
5
Class A
Waters suitable as water supply requiring conventional treatment to meet the PNSDW
203
Class B
Waters intended for primary contact recreation (e.g., bathing, swimming, skin diving, etc.)
149
Class C
Waters for fishery, recreation/boating, and supply for manufacturing processes after treatment
231
Class D
Waters intended for agriculture, irrigation, livestock watering, etc.) 23 Note: There are 133 water bodies with two or more classification.
1
PNSDW Philippine National Standard Drinking Water
water bodies, 263 are principal rivers, 213 are minor rivers, seven are lakes, and 42 are coastal and marine waters.
Table 4 presents the breakdown of classified inland surface water bodies in the country. Of these 525 water bodies, 133 have distinct classification based on their upstream, midstream, and downstream sections, hence, the total number of classifications made reach 611.
3.2 Water Quality Assessment
On its report entitled Water Quality, Philippines Environment Monitor presented an overview of the country’s water quality and availability status, water pollution conditions of surface, ground and coastal waters, and the responses being made by the Philippine Government, given by Table 5.
As shown, the country is facing a serious problem regarding the quality of the water resources therefore affecting the availability of drinking water. The report also stated that by the
year 2025, water availability deficit would take place in several river basins such as in Pampanga and Agno, in Pasig-Laguna, in Cagayan Valley, all other regions in Luzon, in Jalaur and Ilog-Hilabangan, and in the island of Cebu as a result of climate change impacts (World Bank Group, 2003).
In relation to these, there are national laws that define policy and deal with the abatement, control, and water quality management, some of which are: Philippine Environmental Code (PD 1151); Republic Act No. 9275, Clean Water Act (2004); Commonwealth Act 383, Anti-Dumping Law (1938); Presidential Decree 984, Pollution Control Law (1976); Republic Act No. 9003, Ecological Solid Waste Management Act of 2000.
The Philippine Clean Water Act of 2004 is the
law that provides for a comprehensive water
management program to protect the country’s
water bodies from land based sources of pollution
such as industries, mining, agricultural operations,
as well as community household activities.
Table 5. Philippine Water at a Glance (World Bank Group, 2003)
Issues/Topics Status Priority
Pollutants/Parameters
Biochemical Oxygen Demand
(BOD)
→64% of the river Biochemical Oxygen Demand (BOD) exceeded public water supply criterion.
→Critical areas are Metro Manila, Southern Tagalog, and Central Luzon.
→BOD levels of Pasig River from 1998 to 2001 show improvement.
→Laguna Lake meets BOD for fishery, but half of the rivers that feed the lake have high BOD values.
High
Sources of BOD Loading and other Pollutants
Domestic
→Metro Manila: 58 percent; Central Luzon and Southern Tagalog: 51 percent of the total BOD for the region (330,000 metric tons).
→Metro Manila, Southern Tagalog, and Central Luzon are critical areas
High
Industrial
→Metro Manila 42 percent of the total BOD for the region.
→Mining areas of CAR and CARAGA1 contribute pollution to the receiving bodies of water.
→Toxic pollution and contributions are not monitored routinely.
High
Agricultural
→Southern Tagalog: 35 percent; Ilocos region: 58 percent; and Central Visayas: 46 percent of the total for the region.
→Contributions of pesticides and fertilizers residues need to be better quantified and controlled.
Medium
Solid Waste/Garbage
→Contribution to BOD and other pollutants not quantified or well regulated.
→Open dumpsites are still operated in Metro Manila and all over the Philippines in spite of the laws.
→Metro Manila: BOD contribution is over 150,000 Metric tons per year.
High
Responses Monitoring
and Analysis
→Strategic and focused monitoring for critical areas is needed.
→Monitoring and analysis of data from agencies need improvement.
→Public access to information is limited and participation is generally during crisis situations only.
High
Enforcement
→Inadequate allocation of Government resources.
→Weak enforcement of water-related legislation and rules.
→Constraints in capacity.
High
Policies and Interagency Coordination
→Delineation/clarification of function for many agencies.
→Operation of effective regulatory framework for urban sanitation.
→Clean Water Act is proposed but not passed.
Medium
1