논 문
* 경북대학교 농업토목공학과 교수 ([email protected])
** 경북대학교 농업토목공학과 ([email protected])
키워드 : 비점원오염, BOD, TN, TP
낙동강 상류유역의 지역별 비점오염부하 특성
Regional Characteristics of Nonpoint Source Pollutant Loads in the Upstream Watersheds of Nakdong River
Abstract
The characteristics of nonpoint source pollutant loads in upstream of Nakdong River were studied through analysis of pollutant loads of 10 sub-watersheds divided based on administrative district. The discharge and pollutant concentration of each sub-watershed were collected from Nakdong-River Water Research Institute and Daegu Regional Environmental Office, respectively. Pollution items analysed in this study were BOD, T-N and T-P. The delivery loads of the nonpoint source pollutions of each sub-watershed were calculated after analysing the concentration of the pollution of each site. Several points were found from the results. Firstly, in general, city areas including Sangju, Andong showed higher degree of nonpoint pollution than country areas including Cheongsong, Yeongyang. The sub-watesheds located upstream side, such as Yeongju, Bonghwa, necessarily show better water quality than the sub-watersheds located downstream side, such as Mungyeong, Uiseong. This result indicates that a given pollution condition within the watershed can be more sensitive than location factor to the level of water quality. Secondly, the delivery load and area of watershed were not necessarily correlated in the sense of water quality, while the discharge was shown to be highly correlated to the delivery load of pollution. Lastly, sewage and waste caused from population and livestock, as well as landuse factor, were found to significantly contribute to the water pollution. Alternative solutions for controlling pollution sources, therefore, should be provided to meet target levels of water quality in these regions.
Ⅰ. 서 론
Lee, Haeng Woo ∙ Choi, Kyung-SookㆍSon, Seung-Ho∙ Park, Kwang Soo 손 성 호** 박 광 수****
최 경 숙*
이 행 우*
한국관개배수 제13권 제2호
KCID J. VOL. 13, No.2 (2006. 12) pp.95-104
Ⅱ. 연구 방법
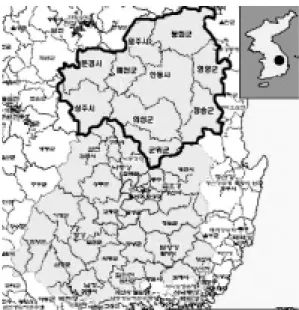
Fig. 1. Location of the study area and regional boundary
Table 1. Area, population, and landuse within the study area
Watershed (Sampling sites)
Andong
(Nakbon C) 61,667 173,519 97.8
(6.4)
141.1 (9.3)
1075.2 (70.7)
47.7 (3.1)
158.6 (10.4)
1,520.4 (100.0) Yeongju
(Nesung A) 43,423 120,882 77.1 (11.5)
78.9 (11.8)
443.2 (66.3)
32.2 (4.8)
37.4 (5.6)
668.9 (100.0) Sangju
(Nakbon D) 42,900 112,003 187.5 (14.9)
96.3 (7.7)
839.8 (66.9)
43.2 (3.4)
88.0 (7.0)
1,254.8 (100.0) Mungyeong
(Gumcheon A) 29,642 79,052 71.5 (7.8)
64.1 (7.0)
710.2 (77.9)
27.5 (3.0)
38.9 (4.3)
912.2 (100.0) Gunwi
(Wicheon A) 12,035 28,012 45.2 (7.4)
46.9 (7.6)
464.9 (75.7)
17.1 (2.8)
40.1 (6.5)
614.2 (100.0) Uiseong
(Wicheon B) 27,445 65,736 136.0 (11.6)
90.6 (7.7)
835.7 (71.1)
34.4 (2.9)
79.2 (6.7)
1,175.9 (100.0) Cheongsong
(Yongjeon A) 12,611 29,840 32.5 (3.9)
66.4 (7.9)
692.4 (82.2)
14.5 (1.7)
36.7 (4.4)
842.5 (100.0) Yeongyang
(Banbyun A) 8,308 20,093 21.9
(2.7)
56.3 (6.9)
699.1 (85.8)
11.4 (1.4)
26.4 (3.2)
815.1 (100.0) Yecheon
(Nesung B) 18,720 51,825 111.0 (16.8)
86.5 (13.1)
367.4 (55.6)
32.6 (4.9)
63.3 (9.6)
660.7 (100.0) Bonghwa
(Nakbon B) 20,617 37,194 47.3
(3.9)
96.7 (8.1)
993.5 (82.7)
26.0 (2.2)
37.4 (3.1)
1,201.0 (100.0)
Total 292,511 791,229 827.8
(8.6)
823.8 (8.5)
7121.4 (73.7)
243.4 (3.0)
606.0 (6.3)
9,665.7 (100.0) Paddy Upland Forest Resident
area Others Household Population
(person)
Land use (㎢)
Total
Ⅲ. 결과 및 고찰
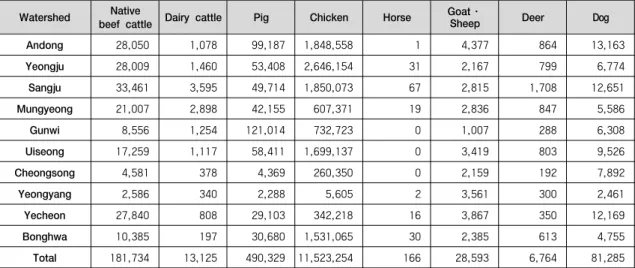
Table 2. Livestock breeding within the study area
Watershed Native
beef cattle Dairy cattle Pig Chicken Horse Goat∙
Sheep Deer Dog
Andong 28,050 1,078 99,187 1,848,558 1 4,377 864 13,163
28,009 1,460 53,408 2,646,154 31 2,167 799 6,774
33,461 3,595 49,714 1,850,073 67 2,815 1,708 12,651
21,007 2,898 42,155 607,371 19 2,836 847 5,586
8,556 1,254 121,014 732,723 0 1,007 288 6,308
17,259 1,117 58,411 1,699,137 0 3,419 803 9,526
4,581 378 4,369 260,350 0 2,159 192 7,892
2,586 340 2,288 5,605 2 3,561 300 2,461
27,840 808 29,103 342,218 16 3,867 350 12,169
10,385 197 30,680 1,531,065 30 2,385 613 4,755
181,734 13,125 490,329 11,523,254 166 28,593 6,764 81,285
Yeongju Sangju Mungyeong
Gunwi Uiseong Cheongsong
Yeongyang Yecheon Bonghwa Total
Fig. 2. Location of sampling sites
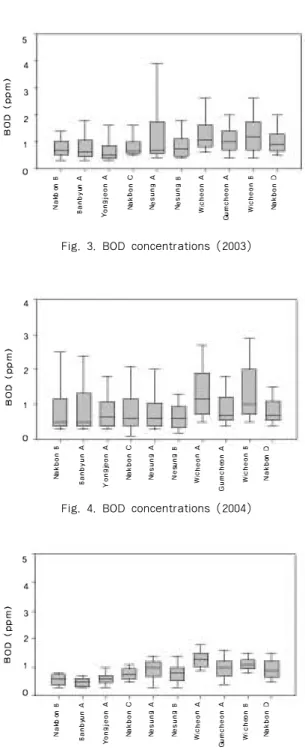
Fig. 3. BOD concentrations (2003)
Fig. 4. BOD concentrations (2004)
Fig. 5. BOD concentrations (2005)
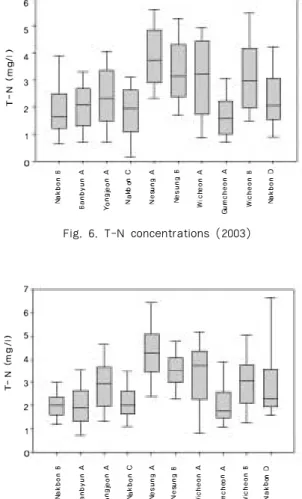
Fig. 6. T-N concentrations (2003)
Fig. 7. T-N concentrations (2004)
Fig. 8. T-N concentrations (2005)
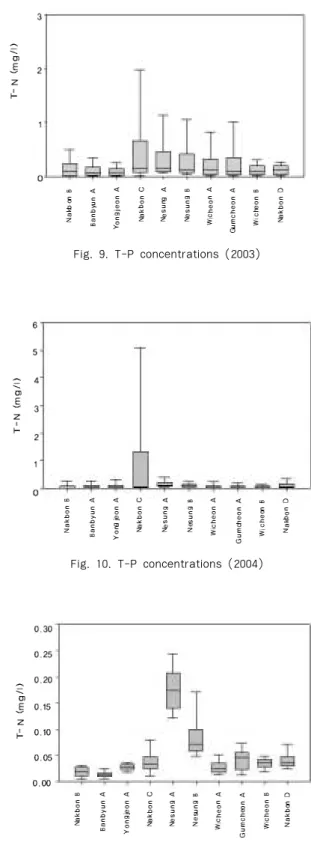
Fig. 9. T-P concentrations (2003)
Fig. 10. T-P concentrations (2004)
Fig. 11. T-P concentrations (2005)
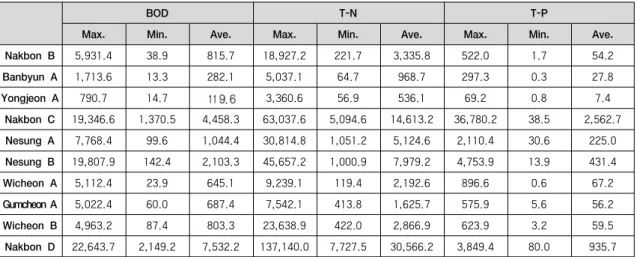
Table 3. Delivery loads of BOD, T-N and T-P (unit: kg/day)
BOD T-N T-P
Max. Min. Ave. Max. Min. Ave. Max. Min. Ave.
Nakbon B 5,931.4 38.9 815.7 18,927.2 221.7 3,335.8 522.0 1.7 54.2
Banbyun A 1,713.6 13.3 282.1 5,037.1 64.7 968.7 297.3 0.3 27.8
Yongjeon A 790.7 14.7 3,360.6 56.9 536.1 69.2 0.8 7.4
Nakbon C 19,346.6 1,370.5 4,458.3 63,037.6 5,094.6 14,613.2 36,780.2 38.5 2,562.7 Nesung A 7,768.4 99.6 1,044.4 30,814.8 1,051.2 5,124.6 2,110.4 30.6 225.0 Nesung B 19,807.9 142.4 2,103.3 45,657.2 1,000.9 7,979.2 4,753.9 13.9 431.4 Wicheon A 5,112.4 23.9 645.1 9,239.1 119.4 2,192.6 896.6 0.6 67.2 Gumcheon A 5,022.4 60.0 687.4 7,542.1 413.8 1,625.7 575.9 5.6 56.2
Wicheon B 4,963.2 87.4 803.3 23,638.9 422.0 2,866.9 623.9 3.2 59.5
Nakbon D 22,643.7 2,149.2 7,532.2 137,140.0 7,727.5 30,566.2 3,849.4 80.0 935.7
Fig. 12. Unit delivery loads of BOD, T-N and T-P
Ⅳ. 결 론
본 논문은 2004년도 경북대학교 연구비에 의하여 연구되었음.
1. 경상북도, 2004, 경상북도 통계연보.
2. 공동수, 2005, 우리나라의 수질총량관리 현황 및 전망, 한국수자원학회지, 38(3), pp.14-22.
3. 권순국, 1998, 우리나라 비점원 수질오염 관리의 문제점과 개선방안, 대한환경공학회지, 20(11), pp.1497-1510.
4. 변주대, 2004, 비점오염현황과 국내정책, 2004년 춘 계전문학술 워크샵‘수질보존을 위한 비점오염원 관리방안’, 한국환경농학회, pp.9-15.
5. 환경부, 1999, 낙동강 물관리종합대책.
6. 환경부, 2003, 낙동강수계 비점오염원 관리방안 마 련을 위한 조사사업 보고서.