ORIGINAL ARTICLE
An Effectiveness of Simultaneous Measurement of PM10, PM2.5, and PM1.0 Concentrations in Asian Dust and Haze Monitoring
Changbum Cho*, Gilun Park, Baekjo Kim
Policy Research Laboratory, National Institute of Meteorological Research/Korea Meteorological Administration, Seoul 156-720, Korea
Abstract
This study introduces a novel approach to the differentiation of two phenomena, Asian Dust and haze, which are extremely difficult to distinguish based solely on comparisons of PM10 concentration, through use of the Optical Particle Counter (OPC), which simultaneously generates PM10, PM2.5 and PM1.0 concentration.
In the case of Asian Dust, PM10 concentration rose to the exclusion of PM2.5 and PM1.0 concentration. The relative ratios of PM2.5 and PM1.0 concentration versus PM10 concentration were below 40%, which is consistent with the conclusion that Asian Dust, as a prime example of the coarse-particle phenomenon, only impacts PM10 concentration, not PM2.5 and PM1.0 concentration. In contrast, PM10, PM2.5 and PM1.0 concentration simultaneously increased with haze. The relative ratios of PM2.5 and PM1.0 concentration versus PM10 concentration were generally above 70%. In this case, PM1.0 concentration varies because a haze event consists of secondary aerosol in the fine-mode, and the relative ratios of PM10 and PM2.5 concentration remain intact as these values already subsume PM1.0 concentration.
The sequential shift of the peaks in PM10, PM2.5 and PM1.0 concentrations also serve to individually track the transport of coarse-mode versus fine-mode aerosols. The distinction in the relative ratios of PM2.5 and PM1.0 concentration versus PM10 concentration in an Asian Dust versus a haze event, when collected on a national or global scale using OPC monitoring networks, provides realistic information on outbreaks and transport of Asian Dust and haze.
Key words : Asian dust, Haze, The ratios of PM2.5 and PM1.0 versus PM10
1. Introduction1)
The many types of aerosols that exist in the actual atmosphere are usually classified, according to bi-modal size distributions associated with particle size and concentration, into coarse- and fine-mode particles. Particle diameters within the range of 1.0-2.5 µm separate these two modes; that is, the coarse-mode corresponds to particles above this range, while the fine-mode corresponds to particles
below this range (Pöschl, 2005; Wilson and Suh, 1997).
Coarse-mode aerosol mostly consists of dust, pollen, sea spray, cloud droplet, and volcanic ash;
these are called primary or natural aerosols. By contrast, most fine-mode aerosol consists of nitrate, sulfate, ammonium, and elemental/organic carbon compounds, also called secondary or anthropogenic aerosols ― these fine particles arise chiefly through phase conversion (i.e., gas to aerosol) or accumulation
Received 4 February, 2013; Revised 24 April, 2013;
Accepted 8 May, 2013
*Corresponding author : Changbum Cho, Policy Research Lab., NIMR/KMA, 61 16 Yeouidaebang-ro, Dongjak-gu, Seoul 156-720, Republic of Korea
Phone: +82-70-7850-6556 E-mail: [email protected]
ⓒ The Korean Environmental Sciences Society. All rights reserved.
This is an Open-Access article distributed under the terms of the Creative Commons Attribution Non-Commercial License (http://
creativecommons.org/licenses/by-nc/3.0) which permits unrestricted non-commercial use, distribution, and reproduction in any medium, provided the original work is properly cited.
of debris (Seinfeld and Pandis, 1997).
Asian Dust is a representative weather phenomenon associated with coarse-mode particles observed in the atmosphere around the Korean Peninsula (Choi et al., 2002; Kim and Choi, 2002; Lee and Cho, 2007). It originates over wide arid or semi-arid regions of China and Mongolia, with wind erosion as the main trigger of dust outbreak. Long-range transport may be observed with Asian Dust as well: it may cross the North Pacific and eventually reach North America (Husar et al., 2001).
Haze, a weather phenomenon, degrades visibility due to light scattering by secondary aerosol (Ghim et al., 2005; Sun et al., 2006). It often arises from a mixture of aerosols and photochemical smog (AMS, 2000; Kang et al., 2004; Kim et al., 2007). Like Asian Dust, haze is frequently observed over large areas covering thousands of kilometers under certain favorable conditions such as a stationary high pressure system over East Asia; haze mainly forms in stable and calm weather conditions from January through June (Chun et al., 2003; Liu et al., 2004; Wang et al., 2006).
Not only do Asian Dust and haze both pose a health risk (Brunekreef and Forsberg, 2005; Hong et al., 2002; Suh et al., 2000; Wilson and Suh, 1997), but the two phenomena are extremely difficult to distinguish relying solely on comparisons of PM101) concentration, a single-spectrum value generated by the β-ray attenuation method or the Tapered Element Oscillation Method (TEOM), a representative method in the field of aerosol monitoring (NIMR2), 2008;
NIMR, 2009).
This study introduces a novel approach to the differentiation of Asian Dust and haze through use of
the Optical Particle Counter (OPC), which simultaneously generates multi-spectrum aerosol concentrations defined as PM10, PM2.53), and PM1.04) (Cha et al., 2005; Hinds, 1999; McMurry, 2000; Pérez et al., 2008). Locally, these multi-spectrum aerosol concentrations facilitate correct observations of Asian Dust and haze, and the aggregate of these observations (taken at each site that make up the observing networks) enable international monitoring of long-range transport of these phenomena.
2. Materials and Methods 2.1. Materials
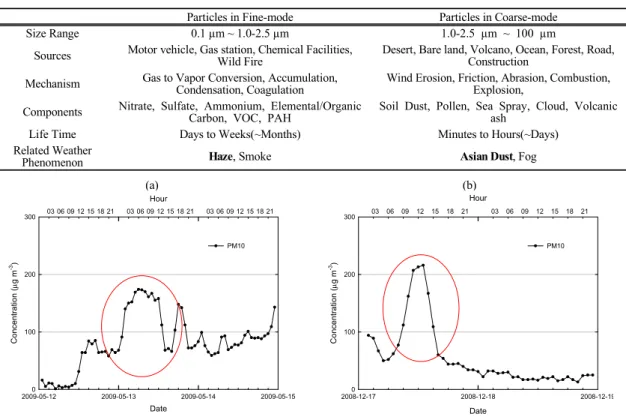
Generally, atmospheric aerosol exhibits bi-modal size distributions according to particle size and concentration. Table 1 describes the characteristics of the bi-modal size distributions designated as coarse- and fine-mode. It is notable that the differences of chemical and physical properties between the two modes are clearly classified, but also that Asian Dust and haze are a representative weather phenomenon in each mode.
Fig. 1 shows the variation of PM10 concentrations generated by a β-ray gauge with respect to Asian Dust and haze at Baengnyeongdo. Even though hourly mean PM10 concentrations are shown to exceed the average ― which is 44.8 µg m-3 at Baengneyeongdo for 2005-2007 according to NIMR (2009) ― by a factor of 3 to 5 in Fig. 1(a)-(b) (red circles), the PM10 concentrations alone failed to differentiate between Asian Dust and haze, as they are limited to variations in concentrations of aerosol with a diameter less than 10 µm.
1) PM (Particulate Matter) is often used in atmospheric environmental science to refer to aerosol. In this sense, PM10 defines aerosol with a diameter less than 10 µm.
2) NIMR : National Institute of Meteorological Research 3) Aerosol with a diameter less than 2.5 µm
4) Aerosol with a diameter less than 1.0 µm
(a) (b)
Date
2009-05-12 2009-05-13 2009-05-14 2009-05-15
Hour
03 06 09 12 15 18 21 03 06 09 12 15 18 21 03 06 09 12 15 18 21
Concentration (mg m-3)
0 100 200 300
PM10
Date
2008-12-17 2008-12-18 2008-12-19
Hour
03 06 09 12 15 18 21 03 06 09 12 15 18 21
Concentration (mg m-3)
0 100 200 300
PM10
Fig. 1. Time series of PM10 concentration generated using the β-ray gauge (FH62C14, Thermo) with respect to (a) Asian Dust and (b) haze events at Baengneyeongdo.
(a) (b)
Fig. 2. Schematic diagrams showing the distinctions between (a) Asian Dust and (b) haze revealed after application of multi-spectrum aerosol concentrations.
Particles in Fine-mode Particles in Coarse-mode
Size Range 0.1 µm ~ 1.0-2.5 µm 1.0-2.5 µm ~ 100 µm
Sources Motor vehicle, Gas station, Chemical Facilities, Wild Fire
Desert, Bare land, Volcano, Ocean, Forest, Road, Construction
Mechanism Gas to Vapor Conversion, Accumulation, Condensation, Coagulation
Wind Erosion, Friction, Abrasion, Combustion, Explosion,
Components Nitrate, Sulfate, Ammonium, Elemental/Organic Carbon, VOC, PAH
Soil Dust, Pollen, Sea Spray, Cloud, Volcanic ash
Life Time Days to Weeks(~Months) Minutes to Hours(~Days)
Related Weather
Phenomenon Haze, Smoke Asian Dust, Fog
Table 1. Comparison of aerosol characteristics with respect to coarse- and fine-mode particles
Fig. 2 is a schematic diagram representing the distinction that is revealed in the relative ratios of PM2.5 and PM1.0 concentration versus PM10 concentration once multi-spectrum values are applied to Asian Dust and haze monitoring. As Asian Dust is
a representative weather phenomenon associated with coarse-mode particles, it affects PM10 concentration to the exclusion of PM2.5 and PM1.0 concentrations, as shown in Fig. 2(a). On the other hand, in the figure representing concentrations during a haze event,
Specifications OPC
Manufacture / Model No. Grimm GmbH&Co. / #365, #180 Particle counting principle Single particle light scattering method
Mass producing principle Calculation
Mass production / Range PM10, PM2.5, PM1.0 / 1.0-1500 µg m-3
Channel / Range
31 / 0.25-, 0.28-, 0.3-, 0.35-, 0.4-, 0.45-, 0.5-, 0.58-, 0.65-, 0.7-, 0.8-, 1.0-, 1.3-, 1.6-, 2.0-, 2.5-, 3.0-, 3.5-, 4.0-, 5.0-, 6.5-, 7.5-, 8.5-, 10.0-, 12.5-, 15.0-, 17.5-, 20.0-, 25.0-, 30.0-, 32.0 µm
Reproducibility 3% in max. range
Sample flow 1.2 l min-1
Vacuum pump 230 V, 60 Hz, 14 l min-1 Membrane pump 230 V, 60 Hz, 4.6 l min-1
Humidity control / Threshold Nafion membrane-tube / 70% (adjustable) Table 2. Specifications of OPC with multi-spectrum aerosol concentrations
PM1.0 concentration is the only one that grows, while the relative ratios of the PM2.5 and PM10 concentrations remain intact. This is due to the fact that haze consists of secondary aerosol in the fine- mode. If PM10, PM2.0, and PM1.0 concentrations were monitored in Fig. 1, one could decisively conclude that Fig. 1(a) represents data of an Asian Dust day (13 May 2009) while Fig. 1(b) records data of a haze day (17 December 2008). That is, PM10, PM2.5, and PM1.0 concentrations can effectively resolve and characterize aerosol properties described in Table 1.
Their simultaneous application is crucial to improving understanding of Asian Dust as opposed to haze.
2.2. Methods 2.2.1. Instrument
2.2.1.1. General description
This study is based on observations taken with the OPC (Dust Monitor #365 and #180, Grimm GmbH&
Co.), which simultaneously generates number (# cm-3) and multi-spectrum mass concentrations (PM10, PM2.5, and PM1.0 concentration) (Table 2). The OPC applies the single particle light scattering technique for aerosol count. Particle signal scattered by laser light is collected on a side mirror and transferred to a recipient diode. This signal passes through a multi-channel size classifier after undergoing amplification. A pulse height analyzer counts the
number of particles using 31 channels.
Moreover, the OPC applies a nafion membrane- tube for humidity control instead of a hot-coil heating system. As this is meant to prevent outgasing of vulnerable organic matters, the dehumidification system works only when RH exceeds the user-specified threshold of 70% (Grimm GmbH&Co., 2006).
2.2.1.2. PM10, PM2.5, and PM1.0 production Primarily, the OPC is designed to count a particle number concentration (# cm-3) from 0.25 µm to 32 µm with 31 channels. Here, PM10, PM2.5, and PM1.0 concentration is calculated for three types of spectrum by allocating an individual channel base on Channels No. 1 ~ 24 as follows:
× × ×
× ×
×
× ×
×
(1)
where is the concentration (M L-3), is the channel No., and is the number of particles (# L-3).
is the diameter (L) and ρ is the representative aerosol density (M L-3). M and L indicate the dimensions of mass and length, respectively.
For example, PM1.0 concentration is calculated
using the sum of mass concentrations with 12 channels from 0.25 µm to 1.0 µm. Mass concentration on an individual channel is derived from the number concentration, the mean diameter, and aerosol density.
Similarly, 16 channels from 0.25 µm to 2.5 µm are used in the calculation of PM2.5 concentration and 24 channels from 0.25 µm to 10 µm are used in the computation of PM10 concentration.
2.2.2. Monitoring Network
Six OPC measurement sites are in operation in South Korea (bottom of Fig. 3). All sites are located at local weather stations on the western side of the Korean Peninsula. These sites, situated at likely entry points of Asian Dust and megacities, were selected for optimal Asian Dust and haze monitoring. Observation operations began in Seoul (37.57°E 126.97°N) on 1 November 2007, at Baengnyeongdo (37.97°E 124.63N°N) on 1 February 2008, in Munsan (37.89°E 126.75°N) on 1 August 2008, in Gunsan (36.00°E 126.76°N) on
Fig. 3. Korea-China Joint Sand and Dust Storm monitoring network (top) and OPC monitoring network in South Korea (bottom).
1 August 2008, and Cheolwon (38.15°E 127.30°N) and Heuksando (34.69°E 125.50°N) on 30 June 2009.
For long-range transport of Asian Dust and haze, this study sampled data from five OPCs (#180, Grimm), which have been in operation in Erenhot (43.39°E 112.0°N), Chifeng (42.27°E 118.93°N), Dandong (40.03°E 124.2°N), and Qingdao (36.07°E 120.3°N) since 28 March 2007 (top panel of Fig. 3).
These Korea-China Joint Sand and Dust Storm Monitoring Stations were established through partnerships between Korean and Chinese authorities to strengthen capability for Asian Dust monitoring in source regions.
3. Results
3.1. Differentiation of Asian Dust and Haze
Unlike Fig. 1(a)-(b), Fig. 4-5 clearly show how PM10, PM2.5, and PM1.0 concentrations vary during Asian Dust and haze. The differences between the two weather phenomena are evident in these trends.
Fig. 4 is a time series of PM10, PM2.5 and PM1.0 concentrations and relative ratios of PM2.5 and PM1.0 concentration versus PM10 concentration for the same period as Fig. 1(a). PM10 concentration rose at 00 LST 13 May 2009 after staying below 40 µg m-3. It recorded the maximum concentration of 164.5 µg m-3 at 11 LST and reverted to its former level around 16 LST on the same day. However, neither PM2.5 nor PM1.0 concentrations show a noticeable change during that period. Fig. 4(b) shows relative ratios to be below 40% (of PM2.5 and PM1.0 concentration versus PM10 concentration). This means that Asian Dust, composed of coarse-particles, passed through Baengnyeongdo during that period, with the OPC successfully capturing the beginning and the end of the event.
Fig. 5 represents the same factors as in Fig. 4, although in this case, the time period is identical to th
(a) (b)
Date
2008-12-17 2008-12-18 2008-12-19
Hour
03 06 09 12 15 18 21 03 06 09 12 15 18 21
Concentration (mg m-3)
0 100 200 300
PM10 PM2.5 PM1.0
Date
2008-12-17 2008-12-18 2008-12-19
Hour
03 06 09 12 15 18 21 03 06 09 12 15 18 21
Ratio (%)
0 20 40 60 80 100
PM2.5 vs PM10 PM1.0 vs PM10
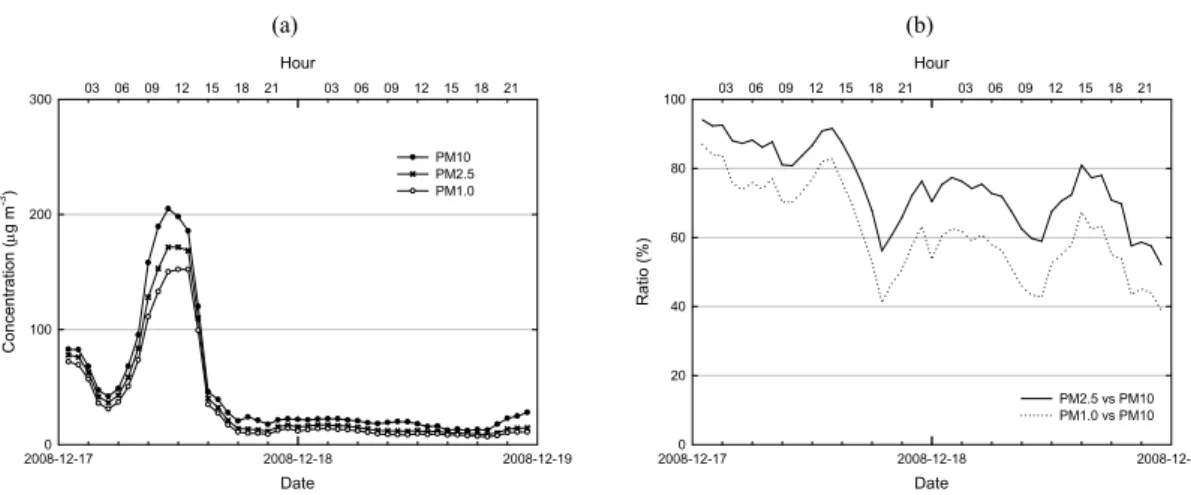
Fig. 5. Time series of (a) OPC-generated PM10, PM2.5 and PM1.0 concentrations and (b) relative ratios of PM2.5 and PM1.0 concentration versus PM10 concentration for the same period represented in Fig. 1(b).
(a) (b)
Date
2009-05-12 2009-05-13 2009-05-14 2009-05-15
Hour
03 06 09 12 15 18 21 03 06 09 12 15 18 21 03 06 09 12 15 18 21
Concentration (mg m-3)
0 100 200 300
PM10 PM2.5 PM1.0
Date
2009-05-12 2009-05-13 2009-05-14 2009-05-15
Hour
03 06 09 12 15 18 21 03 06 09 12 15 18 21 03 06 09 12 15 18 21
Ratio (%)
0 20 40 60 80 100
PM2.5 vs PM10 PM1.0 vs PM10
Fig. 4. Time series of (a) OPC-generated PM10, PM2.5 and PM1.0 concentrations and (b) relative ratios of PM2.5 and PM1.0 concentration versus PM10 concentration for the same period represented in Fig. 1(a).
at for Fig. 1(b). Fig. 5(a) shows that PM10, PM2.5 and PM1.0 concentrations simultaneously rose from 05 LST 17 December 2009 after recording 41.9 µg m-3, 36.6 µg m-3, and 30.9 µg m-3, respectively, and the maximum concentrations of 204.9 µg m-3, 171.6 µg m-3, and 150.1 µg m-3 were recorded 6 hours later, at 11 LST. They once again fell to below 40 µg m-3 at 16 LST, and this trend persisted for 24 more hours.
Moreover, the relative ratio of PM2.5 concentration versus PM10 concentration exceeding 80% for that period is evident in Fig. 5(b). In other words, the
number of fine particles associated with PM1.0 concentrations increased in the ambient air, indicating a haze event occurred at the site from 05 LST through 16 LST 17 December 2009.
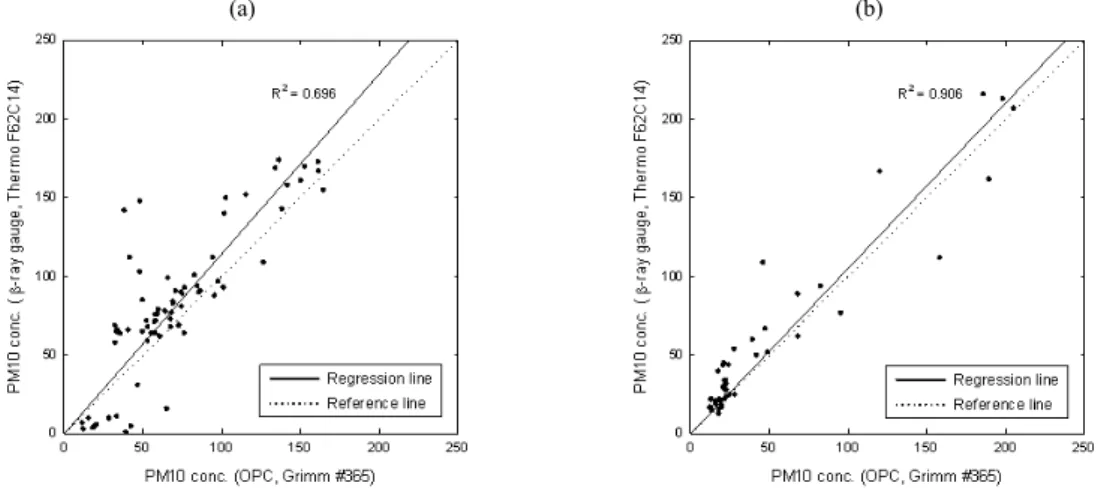
Fig. 6(a) and Fig. 6(b) compare the PM10 concentrations from Fig. 4 with those in Fig. 1(a) and those from Fig. 5 with those in Fig. 1(b). PM10 concentrations generated by the β-ray gauge in both figures were slightly higher than those from the OPC.
As the disparity between the two instruments was noticeable with Asian Dust as opposed to a haze
(a) (b)
Fig. 6. Comparisons of PM10 concentrations generated by the β-ray gauge and the OPC during the period from 0000 LST 12 to 0000 LST 15 May 2009 as Fig. 1(a) and from 0000 LST 17 to 0000 LST 19 Dec 2008 as Fig. 1(b).
event, a calculation of the coefficients of determination (R2) yielded 0.696 for Fig. 6(a) and 0.906 for Fig.
6(b).
When the β-ray gauge generated the maximum concentration of 174.0 µg m-3 at 06 LST, PM10 concentration generated by the OPC increased, recording 136.3 µg m-3. On the other hand, PM10 concentration generated by the β-ray gauge was on a decline, recording 155.1 µg m-3, when the OPC generated the maximum concentration of 164.5 µg m-3 at 11 LST; that is, the β-ray gauge which has a flow rate of 16.7 l/min quickly responded to Asian Dust dominated by coarse particles and generated slightly higher concentrations than the OPC which has a flow rate of 1.2 l/min. The disparity may be due to both a slight phase shift between the two results and an underestimation of the second peak from 17 LST through 20 LST 13 May.
3.2. Transport Monitoring
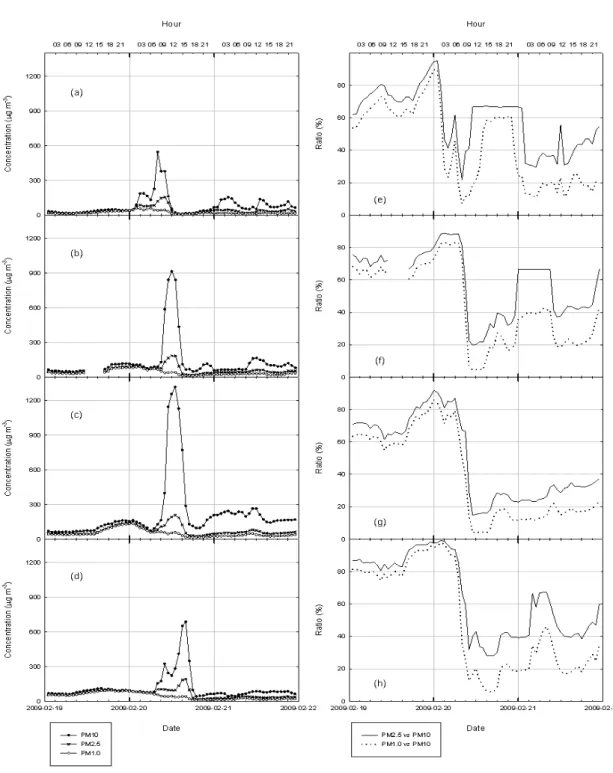
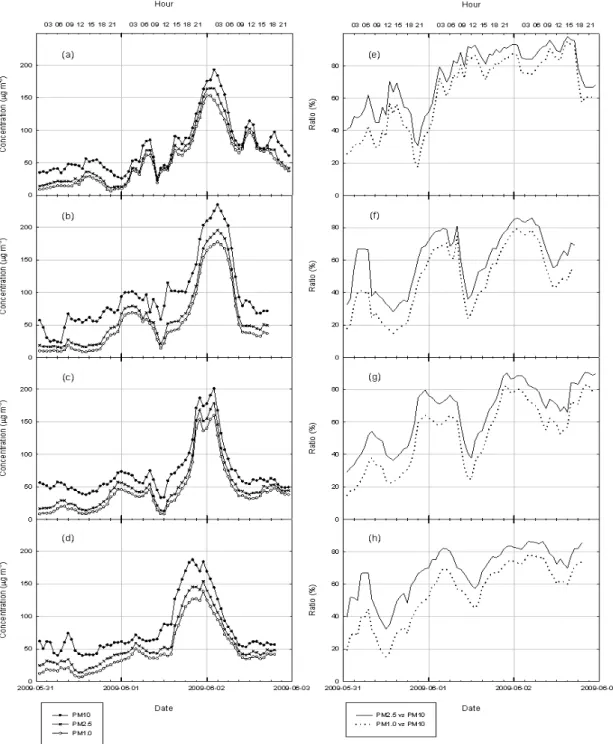
Both Figs. 7-8 show time series graphs of PM10, PM2.5, and PM1.0 concentrations, and relative ratios of PM2.5 and PM1.0 concentration versus PM10 concentration in the case of local transport of Asian Dust and haze. Fig. 7 faithfully captures local transport
of Asian Dust. Each plot was based on multi- spectrum aerosol data from 19 February to 22 February 2009 at Baengnyeongdo, and in Munsan, Seoul, and Gunsan. Only PM10 concentration rose, while PM2.5 and PM1.0 concentration did not exhibit a noticeable change as in Fig. 4. Moreover, the relative ratios of PM2.5 and PM1.0 concentration versus PM10 concentration fell below 40% on 20 February 2009 (see Figs. 7(e)-(h)). The maximum concentration of 544.6 µg m-3 was recorded at Baengnyeongdo, 915.0 µg m-3 in Munsan, 1316.1 µg m-3 in Seoul, and 686.9 µg m-3 in Gunsan, and the time points when these peaks appeared shifted from 08 LST, to 12 LST, to 13 LST, and to 16 LST in lower latitudes. This pattern suggests a southward or southeastward movement of the Asian Dust phenomenon (see Fig.
7(a)-(d)).
Fig. 8 represents a local-scale haze event, and each plot was based on the same parameters observed at the same sites as in Fig. 7 for the period of 31 May through 2 June 2009. PM10, PM2.5 and PM1.0 concentrations simultaneously rose and the relative ratios of PM2.5 and PM1.0 concentration versus PM10 concentration exceeded 70% from 1 June through 2 June. A maximum concentration of 193.2
Fig. 7. Time series of PM10, PM2.5, and PM1.0 concentrations and relative ratios of PM2.5 and PM1.0 concentration versus PM10 concentration monitored at (a)/(e) Baengnyeongdo, (b)/(f) Munsan, (c)/(g) Seoul, and (d)/(h) Gunsan from 19 February to 21 February 2009. Asian Dust was observed on 20 February 2009 in South Korea.
Fig. 8. Time series of PM10, PM2.5, and PM1.0 concentrations and relative ratios of PM2.5 and PM1.0 concentration versus PM10 concentration monitored at (a)/(e) Baengnyeongdo, (b)/(f) Munsan, (c)/(g) Seoul, and (d)/(h) Gunsan from 31 May to 2 June 2009. Haze was observed from 1 June to 2 June 2009 in South Korea.
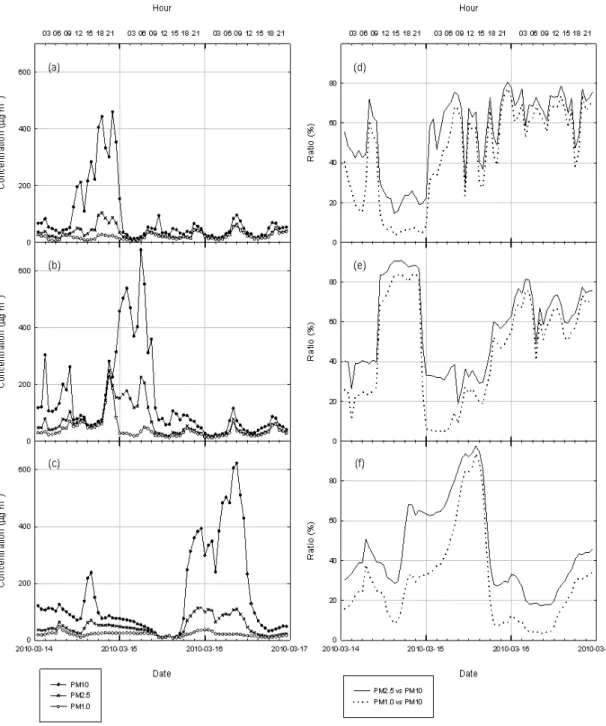
Fig. 9. Time series of PM10, PM2.5, and PM1.0 concentrations and relative ratios of PM2.5 and PM1.0 concentration versus PM10 concentration monitored at (a)/(d) Erenhot, (b)/(e) Chifeng, (c)/(f) Seoul from 14 March to 16 March 2010. The Asian Dust event originated over Mongolia and Inner Mongolia, and was observed from 15 March to 16 March in South Korea after passing through Manchuria and North Korea.
µg m-3 was recorded at Baengnyeongdo, 234.8 µg m-3 in Munsan, 201.2 µg m-3 in Seoul and 187.0 µg m-3 in Gunsan (see Figs. 8(a)-(d)) ― according to NIMR (2009), the average PM10 concentrations at the β-ray gauge PM10 monitoring stations on the Korean Peninsula ranged from 30.5 µg m-3 to 61.6 µg m-3 for 2005-2007. Moreover, the maximum values tended to be concentrated in higher latitudes, as shown in the peaks, observed at 20 LST 1 June in Gunsan, 02 LST 1 June in Seoul, 03 LST 2 June in Munsan, and 02 LST 2 June at Baengnyeongdo (see Figs. 8(e)-(h)).
Fig. 9 shows time series graphs of multi-spectrum aerosol concentrations for a long-range transport event of Asian Dust. Only the PM10 concentration rose, with no changes in PM2.5 and PM1.0 concentrations at Erenhot and Chifeng (see Figs.
9(a)-(b)). In addition, the relative ratios of PM2.5 and PM1.0 concentration versus PM10 concentration from March 14 through 15 fell below 40% (see Figs.
9(d)-(e)). About 12 hours later, as with the previous observing stations, only the PM10 concentration in Seoul increased while the relative ratios fell below 40% (see Fig. 9(c) and Fig. 9(f)). This suggests the occurrence of an Asian Dust event over the border area between Mongolia and Inner Mongolia, which then passed over Seoul from 15 March to 16 March after moving southeast toward southern Manchuria.
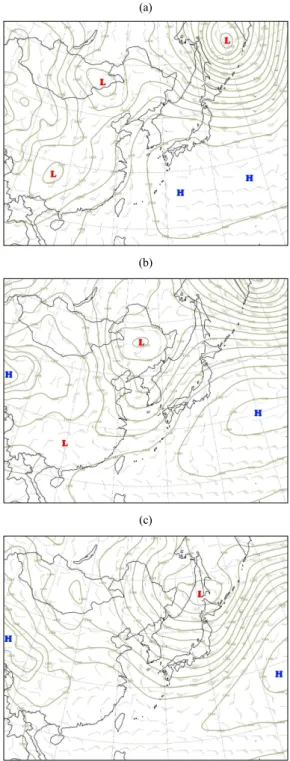
850 hPa geopotential height (GPM) and wind flag changes from weather charts support this conclusion.
Figs. 10(a)-(b) illustrate a strong wind field developing over Mongolia and Inner Mongolia and Fig. 10(c) shows the Korean Peninsula to be under the influence of northwesterlies from 15 March to 16 March.
Fig. 11 shows an OPC monitoring result on a long-range transport event of haze. PM10, PM2.5, and PM1.0 concentrations simultaneously increased like the other haze cases in Fig. 5 and Fig. 8. The relative ratios of PM2.5 and PM1.0 concentration versus
(a)
(b)
(c)
Fig. 10. 850 hPa geopotential height (GPM) and wind flag changes at (a) 0900 LST 14, (b) 0900 LST 15, (c) 0900 LST 16 March 2010 during the period of Fig.
9, respectively.
Fig. 11. Counterpart of Fig. 9 for (a)/(d) Qingdao, (b)/(e) Seoul, and (c)/(f) Dandong from 11 August to 17 August 2009. Haze was observed from 13 August to 17 August in South Korea.
(a) (c)
(b) (d)
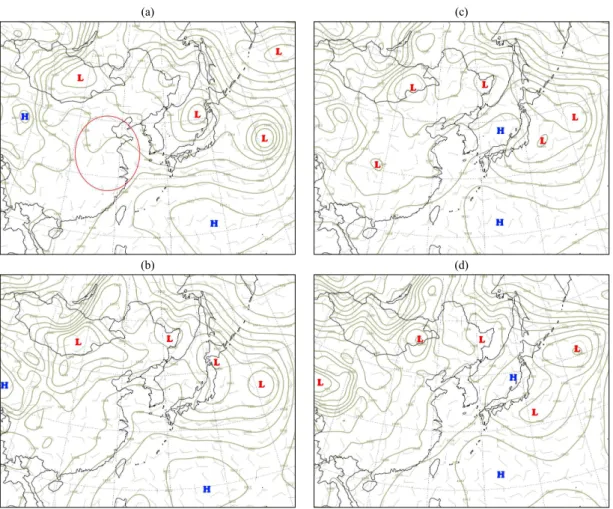
Fig. 12. Surface pressure (hpa) and wind flag changes at (a) 0900 LST 13, (b) 2100 LST 13, (c) 0900 LST 14, (d) 2100 LST 14 August 2009 during the period of Fig. 11, respectively.
PM10 concentration almost exceeded 80% in Qingdao, and 70% in Seoul and Dandong. As the haze event observed at each station lasted 24-36 hours, allowing sufficient time for long-range transport. The first peaks in concentrations were recorded at 00 LST 13 August in Qingdao, 19 LST 13 August in Seoul, and 10 LST 14 August in Dandong, suggesting that haze initially developed around the southern regions of China and crossed the Yellow Sea to North Korea and China's northwest.
In fact, surface weather charts and MODIS (Moderate Resolution Imaging Spectroradiometer) RGB (Red-Green-Blue) composite images from the
Aqua/Terra Satellite support the above conclusion.
Fig. 12(a) indicates that favorable weather conditions formed over the southern regions of China early on 13 August, with a stable and benign pressure system
― a dominant upper-level ridge (see the area marked with a red circle). Southwesterlies blowing toward the Yellow Sea to North Korea formed from 13 August through 15 August as the distance between isobars decreased (i.e., the pressure gradient increased) due to an upper-level trough developing over Mongolia and an expanding North Pacific High (NPH) (see Fig.
12(b)-(d)). MODIS RGB composite images provide conclusive evidence of a this haze transport.
(a)
(b)
(c)
Fig. 13. MODIS RGB composite images over the Korean Peninsula at (a) 1346 LST 13, (b) 1110 LST 14, (c) 1334 LST 15 August 2009 during the period of Fig. 11, respectively.
A haze event along the east coast of China is clearly observed on the image from 1346 LST 13 August (Fig. 13(a)). The image from 1110 LST 14 August shows the haze moved further east, while the image from 1334 LST 15 August shows that haze crossed the Yellow Sea to North Korea and the northwest reaches of China (Figs. 13(b)-(c)).
4. Discussion and Conclusions
It is impossible to conclusively determine whether an Asian Dust or a haze event has occurred based solely on single-spectrum values (which, in most cases, are PM10 concentrations generated by the β -ray gauge). This study suggests a new approach using OPC-generated multi-spectrum aerosol concentrations. This approach, when applied to the monitoring of Asian Dust or haze, yields the following results:
1) Asian Dust and haze events exhibit easily distinguishable patterns when variations in PM10, PM2.5, and PM1.0 concentrations are considered. In the case of Asian Dust, PM10 concentration rose to the exclusion of PM2.5 and PM1.0 concentration.
The relative ratios of PM2.5 and PM1.0 concentration versus PM10 concentration were below 40%, which is consistent with the conclusion that Asian Dust, as a prime example of coarse-particle phenomenon, only impacts PM10 concentration, not PM2.5 and PM1.0 concentration.
2) In contrast with 1), PM10, PM2.5, and PM1.0 simultaneously increased during a haze event. The relative ratios of PM2.5 and PM1.0 concentration versus PM10 concentration were generally above 70%. In this case, PM1.0 concentration varies because haze consists of secondary aerosol in the fine-mode, and the relative ratios of PM10 and PM2.5 concentration remain intact as these values
already subsume PM1.0 concentration.
3) PM10, PM2.5, and PM1.0 concentrations clearly represent the sequential shift of the concentration peaks. The distinction in the relative ratios of PM2.5 and PM1.0 concentration versus PM10 concentration in an Asian Dust versus a haze event discussed above in conclusions 1) and 2), when collected on a national or global scale using OPC monitoring networks, provides realistic information on outbreaks and transport of Asian Dust and haze.
This study conclusively demonstrates the effectiveness of a multi-spectrum aerosol concentration approach in understanding characteristics of the actual atmosphere in which many types of aerosols co-exist.
In addition, this approach has implications beyond the monitoring of Asian Dust and haze; it can be of significant help in fields calling for finer-grained distinctions of the phenomenon at hand such as air quality monitoring in urban settings, monitoring of volcanic activity, aerosol monitoring over coastal areas, and air monitoring through vessels of opportunity.
Acknowledgements
This work was supported by the R&D Project of the Korea Meteorological Administration “Development and application of technology for weather forecast”
(grant no.: NIMR-2013-B-1).
References
American Meteorological Society, 2000, AMS Glossary of Meteorology, http://amsglossary.allenpress.com/
glossary.
Brunekreef, B., Forsberg, B., 2005, Epidemiological evidence of effects of coarse airborne particles on health, Europe. Respiratory J., 26(2), 309-318.
Cha, J. W., Choi, B. C., Choi, J. C., Chung, S. B., 2005,
Characteristics on the two automatic PM10 analyzer of the different measuring method and analysis of the comparing observation data of the analyzers, J.
Korean Meteor. Soc., 41(1), 139-148. (in Korean with English abstract)
Choi, J. C., Cha, J. W., Bang, S. Y., Youn, Y. H., 2002, A study on physical and chemical characteristics of yellow sand at Anmyeon-do, Chungnam, J. Korean Meteor. Soc., 38(2), 105-117. (in Korean with English abstract)
Chun, Y., Lim, J. Y., 2003, The recent characteristics of Asian Dust and haze events in Seoul, Korea, Meteor.
Atmos. Phys., 87(1-3), 143-152.
Ghim, Y. S., Moon, K. C., Lee, S., Kim, Y. P., 2005, Visibility trends in Korea during the past two decades, J. Air Waste Manage. Assoc., 55, 73-82.
Grimm GmbH&Co., 2006, Ambient dust monitor #365 user manual, 47.
Hinds, W. C., 1999, Aerosol Technology, Wiley-Interscience, 483.
Hong, Y. C., Lee, J. T., Kim, H., Ha, E. H., Schwartz, J.
Christiani, D. C., 2002, Effects of air pollutions on acute stroke mortality, Environ. Health Perspec., 110, 187-191.
Husar, R. B., Tratt, D. M., Schichtel, B. A., Falke, S. R., Li, F., Jaffe, D., Gasso, S., Gill, T., Laulainen, N. S., Lu, F., Reheis, M. C., Chun, Y., Westphal, D., Holben, B. N., Gueymard, C., McKendry, I., Kuring, N., Feldman, G. C., McClain, C., Frouin, R. J., Merrill, J., DuBois, D., Vignola, F., Murayama, T., Nickovic, S., Wilson, W. E., Sassen, K., Sugimoto, N., Malm, W. C., 2001, Asian Dust events of April 1998, J. Geophys. Res., 105, D16, 18317-18339.
Kang, C. M., Lee, H. S., Kang, B. W., Lee, S. K., Sunwoo, Y., 2004, Chemical characteristics of acidic gas pollutants and PM2.5 species during hazy episodes in Seoul, South Korea, Atmos. Environ., 38, 4749-4760.
Kim, H. W., Huh, J. B., Hopke, P. K., Holsen, T. M., Yi, S. M., 2007, Characteristics of the major chemical constituents of PM2.5 and smog events in Seoul, Korea in 2003 and 2004, Atmos. Environ., 41, 6762-6770.
Kim, J., Choi, B. C., 2002, Aerosol size distributions and their regional characteristics over Korea, J.
Korean Meteor. Soc., 38(2), 95-104. (in Korean with English abstract)
Liu, L. Y., Shi, P. J., Gao, S. Y., Zou, X. Y., Erdon, H., Yan, P., Li, X. Y., Ta, W. Q., Wang, J. H., Zhang, C.
L., 2004, Dustfall in China’s western loess plateau as influenced by dust storm and haze events, Atmos.
Environ., 38, 1699-1703.
Lee, Y. G., Cho, C. H., 2007, Characteristics of aerosol size distribution for a severe Asian Dust event observed at Anmyeon, Korea in april 2006, J.
Korean Meteor. Soc., 43(2), 87-96.
McMurry, P. H., 2000, A review of atmospheric aerosol measurements, Atmos. Environ., 34, 1959-1999.
NIMR, 2008, Comprehensive monitoring of hwangsa in East Asia and development of next-generation hwangsa prediction model (Ⅱ), NIMR 11-1360395- 000072-01. (in Korean with English abstract) NIMR, 2009, Development and application of the
techniques on Asian Dust monitoring and prediction(1), NIMR 11-1360395-000185-10. (in Korean with English abstract)
Pérez, N., Pey, J., Querol, X., Alastuey, A., López, J.
M., Viana, M., 2008, Partitioning of major and trace
components in PM10–PM2.5–PM1 at an urban site in Southern Europe, Atmos. Environ., 42, 1677- 1691.
Pöschl, U., 2005, Atmospheric areosol: composition, transformation, climate and health effects, Angew.
Chem. Int. Ed., 44, 7520-7540.
Seinfeld, J. H., Pandis, S. N., 1997, Atmospheric Chemistry and Physics, Wiley-Interscience, 1326 pp.
Sun, Y., Zhuang, G., Tang, A., Wang, Y., An, A., 2006, Chemical characteristics of PM2.5 and PM10 in haze-fog episodes in Beijing, Environ. Sci. Technol., 40, 3148-3155.
Suh, H. H., Bahadori, T., Vallarino, J., Spengler, J. D., 2000, Criteria air pollutants and toxic air pollutants, Environ. Health Perspec., 108(4), 625-633.
Wang, Y., Zhuang, G., Sun, Y., An, Z., 2006, The variation of characteristics and formation mechanisms of aerosols in dust, haze, and clear days in Beijing, Atmos. Environ., 40, 6579-6591.
Wilson, W. E., Suh, H. H., 1997, Fine and coarse particles: concentration relationships relevant to epidemiologic studies, J. Air Waste Manage. Assoc., 47, 1238-1249.