© 2014 The Korean Ophthalmological Society
This is an Open Access article distributed under the terms of the Creative Commons Attribution Non-Commercial License (http://creativecommons.org/licenses /by-nc/3.0/) which permits unrestricted non-commercial use, distribution, and reproduction in any medium, provided the original work is properly cited.
Original Article
Predictive Findings of Visual Outcome in Spectral Domain Optical Coherence Tomography after Ranibizumab Treatment in Age-related
Macular Degeneration
Yoon Hyung Kwon1,2, Dong Kyu Lee2, Hyung Eun Kim2, Oh Woong Kwon2
1Department of Ophthalmology, Dong-A University College of Medicine, Busan, Korea
2Retina Center, Nune Eye Hospital, Seoul, Korea
Purpose: To investigate which spectral domain optical coherence tomography (SD-OCT) findings predict visual outcome after anti-vascular endothelial growth factor (VEGF) treatment in neovascular age-related macular degeneration (NV-AMD).
Methods: We reviewed the medical records of patients with treatment-naïve NV-AMD who underwent three or more consecutive anti-VEGF injections. The patients were divided into three groups according to their changes of visual acuity (VA); improved (group I), static (group S), or worsened (group W). We assessed the incidences and values of all available SD-OCT findings of these groups, compared these findings between the three groups and compared the initial values with the post-treatment values.
Results: Better initial VA and longer external limiting membrane (ELM) length were associated with less change in VA after anti-VEGF treatment. The initial VA was mildly correlated with initial photoreceptor inner and outer segment junction (IS/OS) length and initial ELM length. The final VA was also mildly correlated with the final IS/
OS length and the final ELM length. VA was significantly changed after anti-VEGF treatment in groups W and I. With regard to incidence, disruption of the IS/OS (IS/OS-D), disruption of the ELM (ELM-D) and ELM length differed significantly between the three groups, particularly ELM-D. The incidences of IS/OS-D and ELM-D in group I were significantly lower than those in groups S and W, and those in group S were also lower than those in group W. The ELM length in group I was significantly longer than it was in groups S and W, and the ELM length in group S was longer than that for group W. However, these three findings did not change after the anti-VEGF treatment.
Conclusions: Initial IS/OS-D, ELM length and particularly ELM-D can be useful predictors of the visual outcome after anti-VEGF treatment in NV-AMD patients.
Key Words: Choroidal neovascularization, Macular degeneration, Optical coherence tomography
In developed countries, neovascular age-related macular degeneration (NV-AMD) is a major cause of acquired blindness in elderly patients. NV-AMD is characterized by abnormal choroidal neovascularization (CNV); it causes hemorrhage and exudation, leading to subfoveal scarring and photoreceptor cell damage. Several treatments for
Received: August 28, 2013 Accepted: February 12, 2014
Corresponding Author: Oh Woong Kwon, MD, PhD. Retina Center, Nune Eye Hospital, #404 Seolleung-ro, Gangnam-gu, Seoul 135-841, Korea. Tel: 82-2-2086-7792, Fax: 82-2-2086-7779, E-mail: owkwon0301@
yuhs.ac
resolving the exudative change have been reported, including anti-vascular endothelial growth factor (VEGF) therapy [1-3] and photodynamic therapy [4-6]. Anti-VEGF therapy has become a first-line treatment of choice for NV- AMD because not only is the initial visual outcome imp- roved, but this improvement can also be maintained via periodic intravitreal injections.
In the diagnosis and monitoring of NV-AMD, spectral domain optical coherence tomography (SD-OCT) with a resolution of 5 μm has allowed layer-by-layer assessment of intraretinal microstructures, including the photoreceptor inner and outer segment junction (IS/OS) and the external limiting membrane (ELM). In some studies, the IS/OS line on the SD-OCT images was reportedly a good indicator for predicting visual acuity (VA) in NV-AMD patients treated with photodynamic therapy [7] or anti-VEGF [8].
ELM status is another useful SD-OCT parameter during the evaluation of retinal morphology and function in patients with NV-AMD [9]. However, these previous studies evaluated post-treatment VA according to changes in only one or two SD-OCT parameters.
SD-OCT provides various information in addition to that relating to the IS/OS and ELM. Therefore, we investigated all accessible SD-OCT parameters of NV- AMD patients quantitatively, both before and after anti- VEGF treatment, and evaluated the changes in these parameters in conjunction with the changes in VA after anti-VEGF treatment. Using these results, we aimed to identify any SD-OCT parameters that could predict VA improvement after anti-VEGF treatment in NV-AMD patients.
Materials and Methods
The medical records of patients with treatment-naïve NV-AMD who visited the Nune Eye Hospital and under- went three or more consecutive intravitreal ranibizumab (Lucentis; Genetech, South San Francisco, CA, USA) injections from March 2009 to May 2011 were reviewed retrospectively. The study was approved by our Instit- utional Review Board. Sixty-two eyes of 59 patients were studied. All participants underwent best-corrected VA, intraocular pressure assessment, fundus photography, fluorescein angiography, and indocyanine green angio- graphy. VA was measured with an ETDRS (Early Treat-
ment Diabetic Retinopathy Study) chart and converted to a logarithm of the minimal angle of resolution (logMAR) units for statistical analysis.
A SD-OCT (Heidelberg Engineering, Dossenheim, Germany) examination was performed at the initial visit and again each month throughout treatment with three consecutive monthly ranibizumab intravitreal injections.
Horizontal scans of the macula were recorded for each eye.
The eye tracking system of the SD-OCT guaranteed the same position of the scans before and after treatment. The
Fig. 2. Inner and outer segment junction (IS/OS) and external limiting membrane (ELM) line lengths in spectral domain opti- cal coherence tomography (SD-OCT). These lines were measured within 1 mm from the foveal center. The dashed white arrow represents the ELM line, and the black arrow represents the IS/
OS line. In this SD-OCT image, the length of the ELM is 1,292 µm, and the length of the IS/OS is 492 µm.
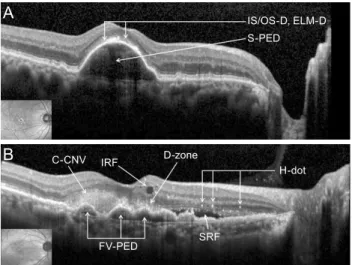
Fig. 1. Spectral domain optical coherence tomography images. (A) IS/OS-D = disruption of the inner segment/outer segment junc- tion; ELM-D = disruption of the external limiting membrane;
S-PED = serous pigment epithelium detachment. (B) C-CNV
= clas sic choroidal neovascularization; IRF = intraretinal fluid;
D-zone = dense zone of the outer retina; H-dot = hyper-reflective dot; FV-PED = fibrovascular pigment epithelium detachment;
SRF = subretinal fluid.
1 mm 1 mm
IS/OS-D, ELM-D S-PED
C-CNV IRF D-zone
H-dot
FV-PED SRF
Foveal center
ELM line IS/OS line
A
B
foveal center was manually defined during the exam- ination. The SD-OCT findings that we analyzed were the serous pigment epithelium detachment (S-PED), fibrovascular pigment epithelium detachment (FV-PED), classic choroidal neovascularization (C-CNV), subretinal fluid (SRF), intraretinal fluid (IRF), dense zone of the outer retina (D-zone), hyper-reflective dots (H-dots), disruption of the IS/OS (IS/OS-D), disruption of the ELM (ELM-D), the length of the intact IS/OS line (IS/OS length), the length of the intact ELM (ELM length), and the mean central foveal thickness (CFT) (Fig. 1). All SD- OCT findings were measured within 1 mm from the fovea center to both sides (nasal and temporal) because the diameter of the physiologic fovea is 1.85 mm [9].
The IS/OS length and ELM length were measured manually using an SD-OCT caliper tool (Fig. 2). IS/OS-D and ELM-D were defined as disruption to these lines of 50% or more. Mean CFT was measured by an automated program that is a component of the SD-OCT equipment, which calculates the average retinal thickness within the circle defined by a 500-μm radius from the foveal center.
Participants were divided into three groups according to the changes in VA from pre-treatment to post-treatment.
Eyes in which the VA decreased were classified as the worsened group (group W), while eyes in which it remained unchanged were placed in the static group (group S). The improved group (group I) was made up of eyes in which VA increased.
Two blinded authors (DKL and YHK) obtained the SD- OCT measurements and categorized the participants into groups. When there were discrepancies in the judgments of parameters, the third author (OWK) made the final decision.
All statistical analyses were performed using the SPSS ver. 18.0 (SPSS Inc., Chicago, IL, USA). All values are
reported as the mean ± standard deviation. The paired t-test was used for comparisons of the VA, CFT, IS/OS length, and ELM length before and after treatment. The correlations between parameters were quantified via Pearson’s correlation analysis. The parameter values derived from the OCT images were compared using a chi- square test incorporating the three groups. Measurements from each group were compared using one-way analysis of variance. A p-value of < 0.05 was considered to be statistically significant.
Results
Sixty-two eyes of 59 patients with treatment-naïve NV- AMD were included in this study. The patient demograp- hics are shown in Table 1. The mean age and initial VA did not have a statistically significant difference among the three groups. At the initial examination, all eyes exhibited distinguishing features of NV-AMD upon SD-OCT and marked exudative change. The exudative change of eyes in all groups was resolved after anti-VEGF treatment.
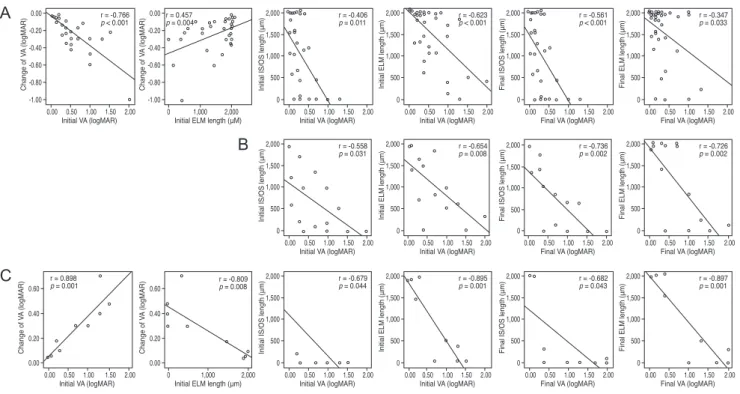
The correlation analysis results are shown in Fig. 3.
Interestingly, in groups I and W, better initial VA and initial ELM lengths were associated with less change in VA after treatment. Therefore, a better initial VA did not assure a better visual outcome. The initial IS/OS length was not correlated with the change in VA after treatment in all groups. A better initial VA was associated with a longer initial IS/OS length and initial ELM length in all groups. The final VA was also significantly correlated with the final IS/OS and ELM length in all groups, in the same manner as the initial VA. These results are concordant with those of a previous study [10] and suggest that IS/OS length and ELM length correlate with visual function.
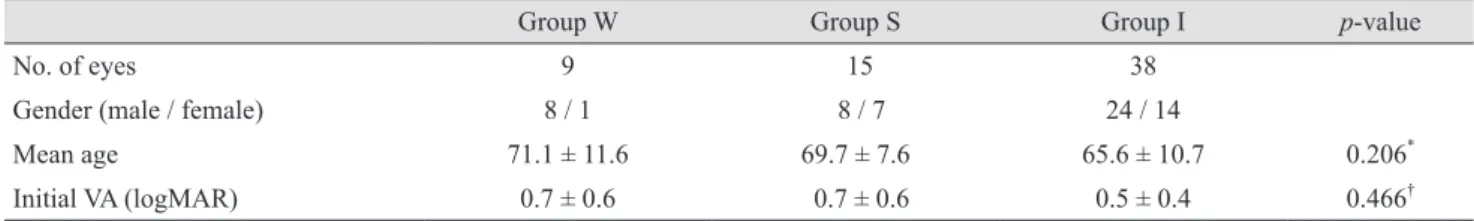
Table 1. Demographic characteristics of the three groups
Group W Group S Group I p-value
No. of eyes 9 15 38
Gender (male / female) 8 / 1 8 / 7 24 / 14
Mean age 71.1 ± 11.6 69.7 ± 7.6 65.6 ± 10.7 0.206*
Initial VA (logMAR) 0.7 ± 0.6 0.7 ± 0.6 0.5 ± 0.4 0.466†
Group W = worsened group; Group S = static group; Group I = improved group; VA = visual acuity; logMAR = logarithm of the minimal angle of resolution.
*Chi-square test; †One-way analysis of variance.
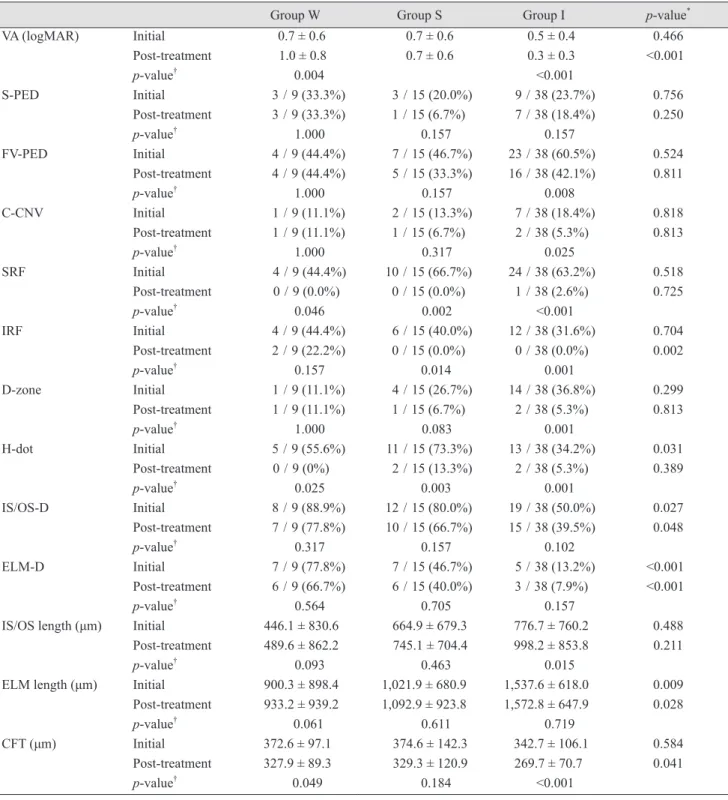
Table 2 shows the incidence of all SD-OCT determ- inations and measurements. The p-values in the columns are related to comparisons between initial and post- treatment SD-OCT findings, and those in the rows are related to comparisons between the three groups. Initial and post-treatment VA differed with statistical significance in groups W and I, and the post-treatment VA between the three groups was also different. FV-PED, C-CNV, D-zone, and IS/OS length were improved in group I only; however, initial and post-treatment values did not differ significantly between the three groups. SRF decreased in all groups after treatment, and IRF decreased in groups S and I; these parameters did not differ significantly between the three groups. Initial and post-treatment S-PED did not differ significantly between the three groups. All groups showed a significant difference for H-dot, but it did not differ significantly between the three groups. With regard to values obtained at the initial visit, only three parameters, IS/OS-D, ELM-D and ELM length, differed significantly between the three groups. These parameters also separated
the three groups in conjunction with differences between the initial and post-treatment VA values, suggesting that they could be used to predict post-treatment visual outcomes. A lower incidence of IS/OS-D and ELM-D and a longer ELM length at the initial visit were associated with better visual outcomes at the final visit. CFT differed significantly between the three groups post-treatment but not at the initial visit.
Discussion
In this study, we investigated the incidences and measu- rements of all available SD-OCT parameters in conju- nction with VA changes after anti-VEGF injection in age- related macular degeneration (AMD) patients, with the aim of identifying initial SD-OCT findings that might predict visual outcomes. Only three parameters, IS/OS-D, ELM-D and ELM length, differed significantly between the three groups at the initial visit and post-treatment.
-1.00
0.00 0.50 1.00 Initial VA (logMAR)
r = -0.766 p < 0.001
Change of VA (logMAR)
1.50 2.00 -0.80
-0.60 -0.40 -0.20 0.00
-1.00
0 1,000 2,000
Initial ELM length (μM) r = 0.457 p = 0.004
Change of VA (logMAR)
-0.80 -0.60 -0.40 -0.20 0.00
0 500 1,000 1,500 2,000
0.00 0.50 1.00 Initial VA (logMAR)
r = -0.406 p = 0.011
Initial IS/OS length (μm)
1.50 2.00 0 500 1,000 1,500 2,000
0.00 0.50 1.00 Initial VA (logMAR)
r = -0.623 p < 0.001
Initial ELM length (μm)
1.50 2.00 0 500 1,000 1,500 2,000
0.00 0.50 1.00 Final VA (logMAR)
r = -0.561 p < 0.001
Final IS/OS length (μm)
1.50 2.00 0 500 1,000 1,500 2,000
0.00 0.50 1.00 Final VA (logMAR)
r = -0.347 p = 0.033
Final ELM length (μm)
1.50 2.00
0 500 1,000 1,500 2,000
0.00 0.50 1.00 Initial VA (logMAR)
r = -0.558 p = 0.031
Initial IS/OS length (μm)
1.50 2.00 0 500 1,000 1,500 2,000
0.00 0.50 1.00 Initial VA (logMAR)
r = -0.654 p = 0.008
Initial ELM length (μm)
1.50 2.00 0 500 1,000 1,500 2,000
0.00 0.50 1.00 Final VA (logMAR)
r = -0.736 p = 0.002
Final IS/OS length (μm)
1.50 2.00 0 500 1,000 1,500 2,000
0.00 0.50 1.00 Final VA (logMAR)
r = -0.726 p = 0.002
Final ELM length (μm)
1.50 2.00
0.00 0.20 0.40 0.60
0.00 0.20 0.40 0.60
0.00 0.50 1.00 Initial VA (logMAR) r = 0.898 p = 0.001
Change of VA (logMAR)
1.50 2.00 0 1,000 2,000
Initial ELM length (μm) r = -0.809 p = 0.008
Change of VA (logMAR)
0 500 1,000 1,500 2,000
0.00 0.50 1.00 Initial VA (logMAR)
r = -0.679 p = 0.044
Initial IS/OS length (μm)
1.50 2.00 0 500 1,000 1,500 2,000
0.00 0.50 1.00 Initial VA (logMAR)
r = -0.895 p = 0.001
Initial ELM length (μm)
1.50 2.00 0 500 1,000 1,500 2,000
0.00 0.50 1.00 Final VA (logMAR)
r = -0.682 p = 0.043
Final IS/OS length (μm)
1.50 2.00 0 500 1,000 1,500 2,000
0.00 0.50 1.00 Final VA (logMAR)
r = -0.897 p = 0.001
Final ELM length (μm)
1.50 2.00
Fig. 3. Correlations between the three groups. (A) Group I: the initial visual acuity (VA) and initial external limiting membrane (ELM) length were correlated with a change in VA. The initial VA was significantly correlated with the initial inner and outer segment junction (IS/OS) and ELM length, and the final VA was also significantly correlated with the final IS/OS and ELM length. (B) Group S: the change in VA was 0, and the initial VA was significantly correlated with the initial IS/OS and ELM length. The final VA was also significantly correlated with the final IS/OS and ELM length. (C) Group W: the initial VA and the initial ELM length were correlated with a change in VA, and the initial VA was correlated with initial IS/OS and ELM length. The final VA was also significantly correlated with the final IS/
OS and ELM length. r = Pearson’s correlation coefficient; logMAR = logarithm of the minimal angle of resolution.
A
C
B
Table 2. Comparisons between the initial and post-treatment SD-OCT findings and between the SD-OCT findings of the three groups
Group W Group S Group I p-value*
VA (logMAR) Initial 0.7 ± 0.6 0.7 ± 0.6 0.5 ± 0.4 0.466
Post-treatment 1.0 ± 0.8 0.7 ± 0.6 0.3 ± 0.3 <0.001
p-value† 0.004 <0.001
S-PED Initial 3 / 9 (33.3%) 3 / 15 (20.0%) 9 / 38 (23.7%) 0.756 Post-treatment 3 / 9 (33.3%) 1 / 15 (6.7%) 7 / 38 (18.4%) 0.250 p-value† 1.000 0.157 0.157
FV-PED Initial 4 / 9 (44.4%) 7 / 15 (46.7%) 23 / 38 (60.5%) 0.524 Post-treatment 4 / 9 (44.4%) 5 / 15 (33.3%) 16 / 38 (42.1%) 0.811 p-value† 1.000 0.157 0.008
C-CNV Initial 1 / 9 (11.1%) 2 / 15 (13.3%) 7 / 38 (18.4%) 0.818 Post-treatment 1 / 9 (11.1%) 1 / 15 (6.7%) 2 / 38 (5.3%) 0.813 p-value† 1.000 0.317 0.025
SRF Initial 4 / 9 (44.4%) 10 / 15 (66.7%) 24 / 38 (63.2%) 0.518
Post-treatment 0 / 9 (0.0%) 0 / 15 (0.0%) 1 / 38 (2.6%) 0.725 p-value† 0.046 0.002 <0.001
IRF Initial 4 / 9 (44.4%) 6 / 15 (40.0%) 12 / 38 (31.6%) 0.704 Post-treatment 2 / 9 (22.2%) 0 / 15 (0.0%) 0 / 38 (0.0%) 0.002 p-value† 0.157 0.014 0.001
D-zone Initial 1 / 9 (11.1%) 4 / 15 (26.7%) 14 / 38 (36.8%) 0.299 Post-treatment 1 / 9 (11.1%) 1 / 15 (6.7%) 2 / 38 (5.3%) 0.813 p-value† 1.000 0.083 0.001
H-dot Initial 5 / 9 (55.6%) 11 / 15 (73.3%) 13 / 38 (34.2%) 0.031 Post-treatment 0 / 9 (0%) 2 / 15 (13.3%) 2 / 38 (5.3%) 0.389 p-value† 0.025 0.003 0.001
IS/OS-D Initial 8 / 9 (88.9%) 12 / 15 (80.0%) 19 / 38 (50.0%) 0.027 Post-treatment 7 / 9 (77.8%) 10 / 15 (66.7%) 15 / 38 (39.5%) 0.048 p-value† 0.317 0.157 0.102
ELM-D Initial 7 / 9 (77.8%) 7 / 15 (46.7%) 5 / 38 (13.2%) <0.001 Post-treatment 6 / 9 (66.7%) 6 / 15 (40.0%) 3 / 38 (7.9%) <0.001 p-value† 0.564 0.705 0.157
IS/OS length (μm) Initial 446.1 ± 830.6 664.9 ± 679.3 776.7 ± 760.2 0.488 Post-treatment 489.6 ± 862.2 745.1 ± 704.4 998.2 ± 853.8 0.211 p-value† 0.093 0.463 0.015
ELM length (μm) Initial 900.3 ± 898.4 1,021.9 ± 680.9 1,537.6 ± 618.0 0.009 Post-treatment 933.2 ± 939.2 1,092.9 ± 923.8 1,572.8 ± 647.9 0.028 p-value† 0.061 0.611 0.719
CFT (μm) Initial 372.6 ± 97.1 374.6 ± 142.3 342.7 ± 106.1 0.584
Post-treatment 327.9 ± 89.3 329.3 ± 120.9 269.7 ± 70.7 0.041 p-value† 0.049 0.184 <0.001
SD-OCT = spectral domain optical coherence tomography; Group W = worsened group; Group S = static group; Group I = improved group; VA = visual acuity; logMAR = logarithm of the minimal angle of resolution;S-PED = serous pigment epithelium detachment;
FV-PED = fibrovascular pigment epithelium detachment; C-CNV = classic choroidal neovascularization; SRF = subretinal fluid; IRF = intraretinal fluid; D-zone = dense zone of the outer retina; H-dot = hyper-reflective dots; IS/OS-D = disruption of the junction between the inner segment and the outer segment of the photoreceptor; ELM-D = disruption of the external limiting membrane; IS/OS length
= length of the intact inner and outer segment junction; ELM length = length of the intact external limiting membrane; CFT = central foveal thickness.
*Comparisons between the three groups, chi-square test; †Comparisons between initial and post-treatment SD-OCT findings, paired t-test.
Lower incidences of IS/OS-D and ELM-D and longer ELM length were associated with better visual outcomes. This finding suggests that these parameters may be useful predictors of visual outcomes. We also compared the change in VA, not the final post-treatment VA, with the SD-OCT measurements; this change differed from that re- ported by previous studies [7,10]. We chose this method because the response to treatment is defined as the degree of VA change, not the final post-treatment VA. Intere- stingly, better initial VA and ELM length were associated with a lesser degree of change in VA after treatment in groups I and W. Thus, an initial higher VA and a longer ELM length did not guarantee significantly greater visual improvement. On the other hand, incidence rates between the three groups were slightly different. The incidence of the initial ELM-D differed significantly between the three groups, and better visual outcomes were associated with lower incidences of this finding. Although the ELM length itself is not informative with regard to predicting visual outcome, we suggest that the presence of ELM-D may be a strong predictor of visual outcome in AMD patients after anti-VEGF treatment.
The strong correlations between the initial VA and the initial IS/OS length and the ELM length were very similar to those reported in a previous study by Shin et al. [10]. That study compared the initial VA with the initial length of the disrupted IS/OS, and the final VA with the final length of the disrupted IS/OS length, and these results were strongly correlated. We additionally compared the initial VA with the initial ELM length, and the final VA with the final ELM length. These comparisons also exhibited consistent correlations in the three groups. The mean IS/OS lengths and ELM lengths were closely associated with visual function. However, they did not predict the visual outcome after anti-VEGF treatment in AMD patients.
Of all the parameters investigated, only IS/OS-D, ELM-D, and ELM length exhibited predictive potential.
SRF and H-dots were highly responsive to treatment in all groups regardless of VA improvement. These parameters may be associated with a decrease in exudative change.
The improvements of FV-PED and C-CNV observed in group I may have been a direct result of anti-VEGF treatment; however, the factors influencing differences in responsiveness for anti-VEGF remain unknown. With regard to the disruption of the outer segment of the fovea caused by longstanding exudative change, we suggest that
anti-VEGF treatment may only improve the exudative change, not visual function. Further research is required to confirm whether or not this is the case. In a study by Oishi et al. [11], CFT was negatively correlated with VA in eyes with a foveal thickness >203 µm. In our study, however, the initial CFT was not correlated with the initial VA, and the final CFT was not correlated with final VA (data not shown). These observations are consistent with previous studies [7,12,13].
We divided the participants into three groups based on different criteria than were used in previous studies.
Hayashi et al. [7] and Shin et al. [10] categorized their par- ticipants into groups based on IS/OS line status: complete, discontinuous or absent. Oishi et al. [11] used ELM status to classify participants into three groups: absent, discon- tinuous or complete. We divided our patients into three groups according to visual outcome (improved, static, or worsened) after anti-VEGF treatment, not SD-OCT findings, and investigated the associations between the SD-OCT findings and these visual outcomes. We suggest that this form of analysis may be more informative with regard to associations between SD-OCT findings and visual out- comes than those used by previous studies.
The present study had several limitations, including its retrospective nature and the relatively small sample size, particularly in group W. Polypoidal choroidal vasculopathy was not differentiated from typical neovascular AMD.
Although the images were analyzed in a blinded manner, the classification of OCT images in the present study was based on personal judgment and manual measurement of the ELM and IS/OS length. The ELM and IS/OS length could not be measured in all cases due to exudation and hemorrhage of the choroidal neovascularization and disru- ption of the foveal area. For these reasons, we suggest categorization based on the integrity of the IS/OS line and the ELM line, rather than measuring their numeric lengths.
We also divided the integrity of these lines into two categ- ories according to their lengths. However, we could not de- termine the relationship between IS/OS or ELM integrity and visual function; only statistically non-significant trends were apparent with regard to visual outcome.
In conclusion, we suggest that IS/OS-D, ELM-D and ELM length may be good predictors of visual outcome after anti-VEGF treatment in NV-AMD patients. More specifically, the absence of IS/OS-D or ELM-D or a longer ELM length at the initial visit suggested that improved
visual function was likely, although these parameters do not reflect visual function itself.
Conflict of Interest
No potential conflict of interest relevant to this article was reported.
References
1. Dadgostar H, Waheed N. The evolving role of vascular en- dothelial growth factor inhibitors in the treatment of neo- vascular age-related macular degeneration. Eye (Lond) 2008;22:761-7.
2. Joeres S, Kaplowitz K, Brubaker JW, et al. Quantitative comparison of optical coherence tomography after pegap- tanib or bevacizumab in neovascular age-related macular degeneration. Ophthalmology 2008;115:347-54e2.
3. Kaiser PK, Blodi BA, Shapiro H, et al. Angiographic and optical coherence tomographic results of the MARINA study of ranibizumab in neovascular age-related macular degeneration. Ophthalmology 2007;114:1868-75.
4. Photodynamic therapy of subfoveal choroidal neovascular- ization in age-related macular degeneration with vertepor- fin: one-year results of 2 randomized clinical trials: TAP report. Treatment of age-related macular degeneration with photodynamic therapy (TAP) Study Group. Arch Ophthal- mol 1999;117:1329-45.
5. Verteporfin In Photodynamic Therapy Study Group. Verte- porfin therapy of subfoveal choroidal neovascularization in age-related macular degeneration: two-year results of a randomized clinical trial including lesions with occult with no classic choroidal neovascularization: verteporfin in pho-
todynamic therapy report 2. Am J Ophthalmol 2001;131:541- 60.
6. Bressler NM; Treatment of Age-Related Macular Degener- ation with Photodynamic Therapy (TAP) Study Group.
Photodynamic therapy of subfoveal choroidal neovascular- ization in age-related macular degeneration with vertepor- fin: two-year results of 2 randomized clinical trials-tap re- port 2. Arch Ophthalmol 2001;119:198-207.
7. Hayashi H, Yamashiro K, Tsujikawa A, et al. Association between foveal photoreceptor integrity and visual outcome in neovascular age-related macular degeneration. Am J Ophthalmol 2009;148:83-9e1.
8. Sayanagi K, Sharma S, Kaiser PK. Photoreceptor status af- ter antivascular endothelial growth factor therapy in exu- dative age-related macular degeneration. Br J Ophthalmol 2009;93:622-6.
9. Hagan MJ, Alvarado JA, Weddell JE. Histology of the hu- man eye: an atlas and textbook. Philadelphia: Saunders;
1971. p. 393-522.
10. Shin HJ, Chung H, Kim HC. Association between foveal microstructure and visual outcome in age-related macular degeneration. Retina 2011;31:1627-36.
11. Oishi A, Hata M, Shimozono M, et al. The significance of external limiting membrane status for visual acuity in age-related macular degeneration. Am J Ophthalmol 2010;150:27-32e1.
12. Moutray T, Alarbi M, Mahon G, et al. Relationships be- tween clinical measures of visual function, fluorescein an- giographic and optical coherence tomography features in patients with subfoveal choroidal neovascularisation. Br J Ophthalmol 2008;92:361-4.
13. Keane PA, Liakopoulos S, Chang KT, et al. Relationship between optical coherence tomography retinal parameters and visual acuity in neovascular age-related macular de- generation. Ophthalmology 2008;115:2206-14.