Measurement of Choroidal Thickness in Normal Eyes Using 3D OCT-1000 Spectral Domain Optical Coherence Tomography
5
0
0
전체 글
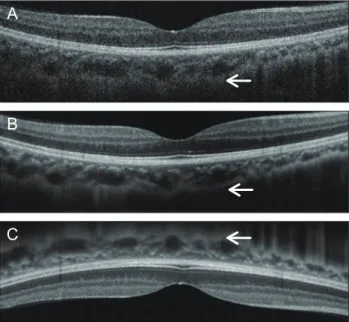
(2) Korean J Ophthalmol Vol.26, No.4, 2012. utilized Heidelberg Spectralis OCT (Heidelberg Engineering, Heidelberg, Germany), Cirrus HD-OCT (Carl Zeiss Meditec Inc., Dublin, CA, USA), or high-penetration OCT with long-wavelength (prototype). Moreover, normal choroidal thickness was usually reported in Western populations [2-5]. 3D OCT-1000 (Topcon, Tokyo, Japan) is another commercially available SD-OCT that supports ‘choroid mode’ optimized for choroidal and scleral imaging. However, the choroidal visualization ability of 3D OCT-1000 has not been reported. We therefore investigated the choroidal thickness profile based on location using 3D OCT1000 in healthy Korean individuals and its correlations with age and refractive error.. A. B. C. Materials and Methods Fifty-seven eyes of 45 healthy volunteers with no visual complaints or history of ocular disease and who visited the healthcare clinic of Hanyang University Hospital from March 2010 to August 2010 underwent high resolution 6 mm single line scanning using 3D OCT-1000, and spherical equivalent refractive error was measured by autorefractometer (KW-1500; Kowa, Tokyo, Japan). High myopic and hyperopic refractive errors greater than -6.0 or +6.0 diopters were excluded from this study. Also, any retinal or choroidal abnormalities in SD-OCT scans were excluded. This study adhered to the tenets of the Declaration of Helsinki, and informed consent was obtained from the participants before participation in the study. A 3D OCT-1000 Mark II (Topcon) with an 840 nm wavelength light source, 5-μm axial image resolution, and a speed of 27,000 A-scans per second was used for obtaining detailed choroidal images. The 6 mm single line scan was captured 50 times in the same position using eye tracking technology, then the software generated a high resolution averaged image of the 50 B-scans. These images were captured using ‘choroid mode,’ which provided a fine focus for the choroidal structure by adjusting the mirror position. For better visualization of choroidal details, the device was positioned close to the eye to produce an inverted image. Using this technique, the zero-delay line with the highest sensitivity was closer to the choroid, and more accurate image acquisition was possible in comparison with those of conventional methods (Fig. 1). The definition of choroidal thickness was the vertical distance between the posterior edge of the hyper-reflective retinal pigment epithelium and the choroid/sclera junction. Two well-trained observers manually measured the choroidal thickness using a built-in caliper in the OCT software. Choroidal thickness was measured at the fovea and in 500 µm intervals from the fovea to a distance of 2,500 µm in the temporal, nasal, superior, and inferior regions. The average value of choroidal thickness obtained by the two observers was used for analysis. 256. Fig. 1. Choroidal B-scan image without averaging in the conventional method shows an obscure choroid/sclera junction (A). Averaging of 50 B-scan images on choroidal mode improves choroidal visualization, but a partially unclear choroid/sclera junction image is produced (B). The device was pushed closely to the eye to obtain an inverted image. Using this technique, the zero-delay line that had highest sensitivity was closer to the choroid, and more accurate image acquisition was possible (compare arrows) (C).. The paired t-test was used to compare choroidal thickness at each location. The correlations with age and refractive error were calculated by univariate and multiple regression analyses. A p-value 0.05 or less was considered statistically significant. All statistics were calculated using SPSS ver. 17.0 (SPSS Inc., Chicago, IL, USA).. Results Twenty men and 25 women (57 eyes) having a mean age of 45.28 ± 14.8 years (range, 23 to 80 years) participated in this study. The mean refractive error was -1.34 ± 2.1 D (range, -6.0 to +3.0 D). Reliable measurements of choroidal thickness were obtainable in 63.3% of the examined eyes (57 of 90 eyes). In 33 eyes, an obscured margin between the choroid and sclera made accurate delineation impossible. There was strong inter-observer correlation in the manual measurement of choroidal thickness (r = 0.92, p < 0.001). Mean subfoveal choroidal thickness was 270.82 ± 51.4 µm (range, 161 to 383 µm) horizontally and 275.04 ± 48.7 µm (range, 161 to 380 µm) vertically. There was no statistically significant difference between horizontal and vertical subfoveal choroidal thickness (paired t-test, p = 0.131) (Fig. 2). The mean choroidal thickness at each location is shown in Table 1, and subfoveal choroidal thickness was significantly greater than any other locations ( p <.
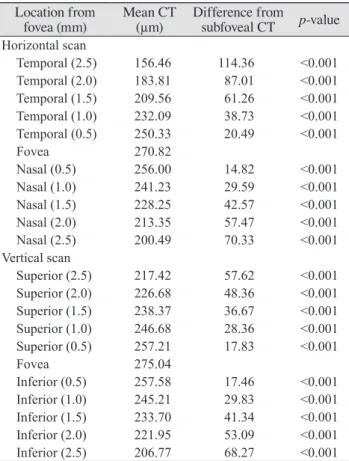
(3) JW Shin, et al. Choroidal Thickness in Normal Eyes. 0.05, respectively). The temporal choroid was significantly thicker than the nasal choroid at all 500 µm intervals and corresponding locations ( p < 0.05, respectively), and there was no difference in thickness between the superior and inferior choroid, except at the location 2,500 µm from the Normal choroidal thickess Mean thickness (μm). 300 250 200 150 100. S-I. N-T. 50 0. 2.5. 2.0. 1.5. Nasal Superior. 1.0. 0.5 Fovea 0.5. 1.0. 1.5. 2.0. 2.5. Temporal Inferior. Distance from fovea (mm). Fig. 2. Mean choroidal thickness at each of 22 locations in healthy Korean individuals. Subfoveal choroidal thickness is significantly greater than any other locations (paired t-test, p < 0.05, respectively). There is no statistically significant difference between horizontal and vertical subfoveal choroidal thickness (paired t-test, p = 0.131). S = superior; I = inferior; N = nasal; T = temporal.. Mean thickness (μm). A. Horizontal choroidal thickess 300 250 200 150 100 50 0. N2.5 N2.0. N1.5. N1.0. N0.5 Fovea T0.5. T1.0. T1.5. T2.0. T2.5. Distance from fovea (mm). B. Vertical choroidal thickess. Mean thickness (μm). 300 250 200 150 100 50 0 S2.5 S2.0. S1.5. S1.0. S0.5 Fovea. fovea (Fig. 3). In this study, refractive error was significantly correlated with subfoveal choroidal thickness upon simple linear regression (p = 0.046, R 2 = 0.101) (Fig. 4). Age was negatively correlated with choroidal thickness in previous studies, but our study showed that age was not a factor independently related to choroidal thickness (p = 0.688) (Fig. 5). By considering the influence of refractive error, age was related to choroidal thickness upon multiple regression analysis ( p = 0.015, R 2 = 0.202). Regression analysis showed that choroidal thickness decreased 1.31 µm for each year of age and increased 13.62 µm for each diopter of refractive error (Table 2).. I0.5. I1.0. I1.5. I2.0. I2.5. Distance from fovea (mm). Fig. 3. (A) Temporal choroid is thicker at any corresponding location than the nasal choroid in horizontal scan (paired t-test, p < 0.05, respectively). (B) Superior choroid at 2,500 µm from the fovea is thicker than the inferior choroid (paired t-test, p < 0.05), and there is no difference in the vertical scan. *p < 0.05. S = superior; I = inferior; N = nasal; T = temporal.. Table 1. Mean choroidal thickness profile in 500 µm intervals Location from fovea (mm). Mean CT (µm). Horizontal scan Temporal (2.5) 156.46 Temporal (2.0) 183.81 Temporal (1.5) 209.56 Temporal (1.0) 232.09 Temporal (0.5) 250.33 Fovea 270.82 Nasal (0.5) 256.00 Nasal (1.0) 241.23 Nasal (1.5) 228.25 Nasal (2.0) 213.35 Nasal (2.5) 200.49 Vertical scan Superior (2.5) 217.42 Superior (2.0) 226.68 Superior (1.5) 238.37 Superior (1.0) 246.68 Superior (0.5) 257.21 Fovea 275.04 Inferior (0.5) 257.58 Inferior (1.0) 245.21 Inferior (1.5) 233.70 Inferior (2.0) 221.95 Inferior (2.5) 206.77 CT = choroidal thickness.. Difference from subfoveal CT. p-value. 114.36 87.01 61.26 38.73 20.49. <0.001 <0.001 <0.001 <0.001 <0.001. 14.82 29.59 42.57 57.47 70.33. <0.001 <0.001 <0.001 <0.001 <0.001. 57.62 48.36 36.67 28.36 17.83. <0.001 <0.001 <0.001 <0.001 <0.001. 17.46 29.83 41.34 53.09 68.27. <0.001 <0.001 <0.001 <0.001 <0.001. Table 2. Multiple regression analysis for subfoveal choroidal thickness with regard to age and refractive error Factor Intercept Age Refractive error. Coefficient 341.584 -1.306 13.621. p-value <0.001 0.037 0.004. Beta -0.404 0.567. 257.
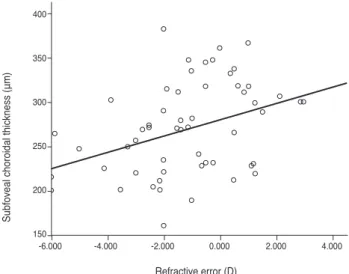
(4) Korean J Ophthalmol Vol.26, No.4, 2012. 400. Subfoveal choroidal thickness (μm). 350. 300. 250. 200. 150 -6.000. -4.000. -2.000. 0.000. 2.000. 4.000. Refractive error (D). Fig. 4. Relationship between refractive error and subfoveal choroidal thickness. The plot shows a significant positive correlation in simple linear regression analysis (p = 0.046, y = 7.62x + 274.13, R 2 = 0.101). D = diopters.. 400. Subfoveal choroidal thickness (μm). 350. 300. 250. 200. 150. 20. 30. 40. 50. 60. 70. 80. Age (yr). Fig. 5. Relationship between age and subfoveal choroidal thickness. Age is not related to choroidal thickness in simple linear regression ( p = 0.688, y = -0.188x + 279.35, R 2 = 0.003). Age is negatively correlated with choroidal thickness in multiple linear regression (p = 0.015, y = 341.584 - 1.306x1 + 13.621x2, R 2 = 0.202).. Discussion Previous choroidal thickness measurement research was based on Cirrus and Heidelberg OCT devices or prototype long wavelength HP-OCT. We studied choroid features using another commercially available spectral-domain OCT device, a Topcon 3D OCT-1000. The choroid and sclera are normally difficult to detect with commercially available OCT instruments using a shorter wavelength of approximately 840 nm. For better visualization of these structures, 258. we applied an image averaging technique using choroid mode and an inverted image that is closer to the zero delay line. Detailed choroidal and scleral visualization was possible in 63.3% of examined eyes. Manjunath et al. [4] reported that reliable choroidal thickness measurement was possible in 74% of patients. The results of choroidal thickness profile indicated that the choroid was thicker at the fovea than at nasal, temporal, superior, and inferior locations. The mean subfoveal thickness was 270.82 µm on the horizontal scan and 275.04 µm on the vertical scan, which are similar findings to the 272 µm reported by Manjunath et al. [4], 287 µm by Margolis and Spaide [3], and 354 µm by Ikuno et al. [1]. In our study, superior choroidal thickness had no difference with that of the inferior choroid; however, a previous study showed the inferior choroid to be thinner than the superior choroid [1]. Differences among these studies might be due to individual variation in device characteristics such as wavelength, eye tracking method, and averaging software or to differences of participant profiles such as ethnicity, age, and refractive error. The choroid has a rich vascular layer, the thickness of which is affected by blood flow, perfusion pressure, and intraocular pressure [7]. With aging, physiological functions of the choroid decrease, and histological evaluation shows decrement in the vascular density, overall luminal area, and diameter of the choriocapillary vessels [8-10]. Choroidal thickness decreases 1.1 µm per year according to a study using cadaver eyes [8], and we found a similar 1.31 µm reduction in choroidal thickness for each year of age using multiple regression analysis. A recent in vivo study using SD-OCT showed similar results of choroidal thickness reduction (1.4 to 1.56 µm per year) [1,3]. Because the choroid is rich in vascular tissue, in vivo imaging can more accurately reflect the actual status of the choroid with aging. In highly myopic eyes, the choroid is three times thinner than that in normal eyes, and refractive error has a great impact on choroidal thinning in terms of regression [1,6]. Ikuno et al. [1] found a 9.3 µm increment of choroidal thickness per diopter of refractive change. We also found a correlation between choroidal thickness and refractive error in multiple regression analysis (13.6 µm/D). Although both age and refractive error affected choroidal thickness, age was not correlated to choroidal thickness in univariate regression analysis ( p = 0.688). Refractive error had a greater explanatory power on choroidal thickness change than did age (beta, 0.567 vs. -0.404). Functional and structural changes of the choroid are associated with many retinal diseases and result in increasing or decreasing choroidal thickness. Recently, in vivo choroidal thickness measurement was applied to central serous chorioretinopathy [11,12], age-related macular degeneration with pigment epithelial detachment [13], agerelated choroidal atrophy [14], highly myopic eyes [6,15],.
(5) JW Shin, et al. Choroidal Thickness in Normal Eyes. and idiopathic macular hole [16] as a noninvasive method to monitor response to therapy or progression of disease in Western populations. However, there are no comparable normative data available in the Korean population. It is worthwhile to understand the normal choroidal thickness profile for accurate and reliable monitoring of choroid change. The limitation of this study is the use of a relatively short 840 nm wavelength that cannot visualize the choroid in the presence of thick pigmented retinal pigment epithelium or lens opacity. Despite averaging using choroid mode, choroidal thickness measurement is not always possible. Another limitation is that the distributions of age and refractive error did not exactly reflect those of a normal population because the participants were a small group of volunteers. It is also difficult to directly compare the present results with those of other studies due to difference of participant profiles. Therefore, further research will be needed to investigate various ocular factors or retinal diseases and their effects on choroidal thickness in a well distributed large group study. In our study, choroidal thickness measurement in healthy Koreans using Topcon 3D OCT-1000 was possible in most cases. The topographical profile of choroidal thickness varies depending on location. Aging and myopic shift are critical factors for interpretation of choroidal thickness, and refractive error has a major impact. Our results have some similarities and differences compared to previous studies and show the choroidal thickness measuring ability of 3D OCT-1000.. Conflict of Interest No potential conflict of interest relevant to this article was reported.. References 1. Ikuno Y, Kawaguchi K, Nouchi T, Yasuno Y. Choroidal thickness in healthy Japanese subjects. Invest Ophthalmol Vis Sci 2010;51:2173-6.. 2. Spaide RF, Koizumi H, Pozzoni MC. Enhanced depth imaging spectral-domain optical coherence tomography. Am J Ophthalmol 2008;146:496-500. 3. Margolis R, Spaide RF. A pilot study of enhanced depth imaging optical coherence tomography of the choroid in normal eyes. Am J Ophthalmol 2009;147:811-5. 4. Manjunath V, Taha M, Fujimoto JG, Duker JS. Choroidal thickness in normal eyes measured using Cirrus HD optical coherence tomography. Am J Ophthalmol 2010;150:3259.e1. 5. Unterhuber A, Povazay B, Hermann B, et al. In vivo retinal optical coherence tomography at 1040 nm - enhanced penetration into the choroid. Opt Express 2005;13:3252-8. 6. Ikuno Y, Tano Y. Retinal and choroidal biometry in highly myopic eyes with spectral-domain optical coherence tomography. Invest Ophthalmol Vis Sci 2009;50:3876-80. 7. Kiel JW, van Heuven WA. Ocular perfusion pressure and choroidal blood flow in the rabbit. Invest Ophthalmol Vis Sci 1995;36:579-85. 8. Ramrattan RS, van der Schaft TL, Mooy CM, et al. Morphometric analysis of Bruch’s membrane, the choriocapillaris, and the choroid in aging. Invest Ophthalmol Vis Sci 1994;35:2857-64. 9. Feeney-Burns L, Burns RP, Gao CL. Age-related macular changes in humans over 90 years old. Am J Ophthalmol 1990;109:265-78. 10. Sarks SH. Ageing and degeneration in the macular region: a clinico-pathological study. Br J Ophthalmol 1976;60:32441. 11. Maruko I, Iida T, Sugano Y, et al. Subfoveal choroidal thickness after treatment of central serous chorioretinopathy. Ophthalmology 2010;117:1792-9. 12. Imamura Y, Fujiwara T, Margolis R, Spaide RF. Enhanced depth imaging optical coherence tomography of the choroid in central serous chorioretinopathy. Retina 2009;29:146973. 13. Spaide RF. Enhanced depth imaging optical coherence tomography of retinal pigment epithelial detachment in age-related macular degeneration. Am J Ophthalmol 2009;147:644-52. 14. Spaide RF. Age-related choroidal atrophy. Am J Ophthalmol 2009;147:801-10. 15. Fujiwara T, Imamura Y, Margolis R, et al. Enhanced depth imaging optical coherence tomography of the choroid in highly myopic eyes. Am J Ophthalmol 2009;148:445-50. 16. Reibaldi M, Boscia F, Avitabile T, et al. Enhanced depth imaging optical coherence tomography of the choroid in idiopathic macular hole: a cross-sectional prospective study. Am J Ophthalmol 2011;151:112-7.e2.. 259.
(6)
수치
관련 문서
FPGA기반의 파장영역 광학단층 영상기를 위한 고속연산 시스템 FPGA-based high speed imaging system for spectral. domain optical coherence
We propose novel spectral domain polarization sensitive optical coherence tomography with single camera spectrometer including a multiplexed custom grating, camera
OCT (Optical Coherence Tomography) 이미징 기술의 개발과 응용 특집 ■ Biophotonics.. 는
Purpose: To investigate the change of retinal volume according to anterior segment refractive power using contact lens by spec- tral domain optical coherence tomography
Purpose: To determine the frequency and potential causes of segmentation errors in spectral domain optical coherence tomog- raphy (SD-OCT) imaging of retinal nerve fiber layer
Macular Choroidal Thickness and Volume Measured by Swept-source Optical Coherence Tomography in Healthy Korean Children.. Jung Wook Lee 1 , In Seok Song 1 , Ju-hyang Lee 1 , Yong
Purpose: To investigate which spectral domain optical coherence tomography (SD-OCT) findings predict visual outcome after anti-vascular endothelial growth factor (VEGF) treatment
Spectral domain optical coherence tomogra- phy (SD-OCT) revealed increased reflectivity from the inner retinal layer, retinal thickening, and choroidal shad- owing while focal
