ISSN 0378-6471 (Print)⋅ISSN 2092-9374 (Online)
http://dx.doi.org/10.3341/jkos.2016.57.2.248
Original Article
매체혼탁에 따른 파장가변 빛간섭단층촬영과 스펙트럼영역 빛간섭단층촬영 영상의 질 비교
Comparison of Image Quality between Swept-Source and Spectral-Domain Optical Coherence Tomography According to Ocular Media Opacity
홍은희⋅박승훈⋅이정욱⋅이주향⋅송인석⋅이병로
Eun Hee Hong, MD, Seung Hun Park, MD, Jung Wook Lee, MD, Ju Hyang Lee, MD, In Seok Song, MD, Byung Ro Lee, MD, PhD
한양대학교 의과대학 안과학교실
Department of Ophthalmology, Hanyang University College of Medicine, Seoul, Korea
Purpose: To compare the image quality between swept-source optical coherence tomography (SS-OCT) and spectral domain optical coherence tomography (SD-OCT), especially in eyes with media opacity.
Methods: Forty eyes without media opacity and 60 eyes with media opacity (30 eyes with cataract, 20 eyes with vitreous opacity, and 10 eyes with corneal opacity) were included in this study. SD-OCT and SS-OCT 6 × 6 macular scans were taken by a single operator. For image quality analysis, a total of 200 OCT images were subjectively graded by two trained retina specialists and measured quantitatively using the image quality factor (QF) built into the OCT devices.
Results: Compared to conventional SD-OCT, SS-OCT had statistically significantly better subjective and objective grades in the normal group, as well as each of the media opacity groups (p-value < 0.001). In both the subjective and objective grades, there was no significant difference according to the types of media opacity (QF: p = 0.188, subject grading scale [SGS]: p = 0.635) and the degree of media opacity (Group I: 20 ≤ QF < 50, Group II: 0 ≤ QF < 20; QF: p = 0.088, SGS: p = 0.051) in the superiority of image quality of SS-OCT to SD-OCT.
Conclusions: In this media opacity patient population, swept-source OCT is a superior diagnostic tool when compared with SD-OCT in both objective and subjective assessments, even in the ocular media opacity. This result may be useful in diagnosis and progression detection of retinal disease in media opacity eyes.
J Korean Ophthalmol Soc 2016;57(2):248-255
Keywords: Image quality, Ocular media opacity, Swept source optical coherence tomography
■Received: 2015. 9. 21. ■ Revised: 2015. 10. 6.
■Accepted: 2015. 12. 30.
■Address reprint requests to Byung Ro Lee, MD, PhD Department of Ophthalmology, Hanyang University Seoul Hospital, #222-1 Wangsimni-ro, Seongdong-gu, Seoul 04763, Korea
Tel: 82-2-2290-8570, Fax: 82-2-2291-8517 E-mail: [email protected]
* This study was presented as a narration at the 110th Annual Meeting of the Korean Ophthalmological Society 2013.
ⓒ2016 The Korean Ophthalmological Society
This is an Open Access article distributed under the terms of the Creative Commons Attribution Non-Commercial License (http://creativecommons.org/licenses/by-nc/3.0/) which permits unrestricted non-commercial use, distribution, and reproduction in any medium, provided the original work is properly cited.
파장가변 빛간섭단층촬영(swept-source optical coherence tomography, SS-OCT)은 기존의 스펙트럼영역 빛간섭단층촬 영(spectral domain optical coherence tomography, SD-OCT) 보다 더 긴 파장을 사용해서 안구의 후부 구조물을 좀 더 명확히 보여주고 또한 매질혼탁으로 인한 산란에 영향을 덜 받는 것으로 알려져 있다.1 850 nm대의 파장 영역을 이 용하는 기존의 SD-OCT로는 시세포층과 색소상피층에서의 산란으로 인해 깊은 맥락막 조직에서의 신호 강도는 낮아 지게 되는 데 반해,2 좀 더 긴 1,050 nm대의 파장 영역을
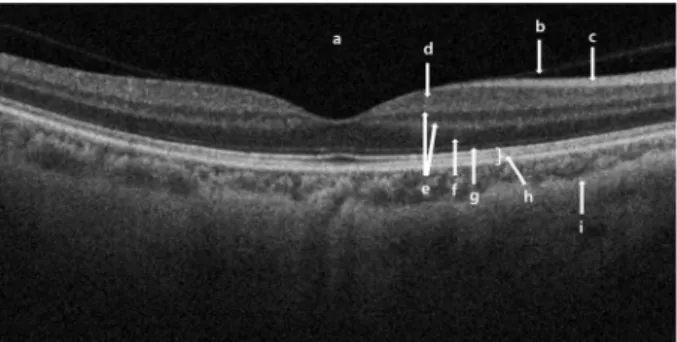
Figure 1. A representative OCT b-scan image showing how to
grade subject grading scale (SGS). The graded OCT features were labeled (a) vitreous, (b) vitreo-retinal interface, (c) nerve fiber layer, (d) ganglion cell layer, (e) plexiform layers, (f) outer nuclear layer, (g) outer limiting membrane, (h) outer ret- ino-choroidal complex, (i) choroidal/scleral interface. Question 1 in the subjective grading scheme corresponds to the intensity difference between features a and h; question 2, visibility of b;question 3, intensity difference between a and c; question 4, intensity difference between a and e; question 5, visibility of multiple layers within h; question 6, visibility of d (against c and e); question 7, intensity difference between a and f; ques- tion 8, visibility of g; and question 9, visibility of i. Figure re- vised from Huang et al.11 OCT = optical coherence tomography.
이용하는 SS-OCT로는 높은 투과성으로 고해상도의 맥락 막 이미지를 얻을 수 있을 뿐만 아니라3,4 공막까지도 더 명 확하게 관찰이 가능한 것으로 보고된 바 있다.5
이전의 연구들에서는 백내장에 의한 SD-OCT의 영상의 질(image quality) 저하로 인해 망막 두께가 실제보다 더 두 껍게6 혹은 더 얇게7, 또 망막신경섬유층 두께가 실제보다 더 얇게8 측정될 수 있다고 하였다. 이와 같이 백내장 등의 매체 혼탁으로 인한 SD-OCT의 영상의 질 저하는 질병의 진단 혹은 질병의 경과 평가에도 영향을 미칠 수 있다.
안구의 매체혼탁에는 수정체의 혼탁인 백내장뿐만 아니 라, 유리체의 혼탁(유리체출혈, 유리체염 등), 각막의 혼탁 (각막 부종, 각막혼탁 등)도 있을 수 있는데, 지금까지 백내 장 이외의 매체혼탁이 OCT의 영상의 질에 미치는 영향에 대해 보고한 연구는 없었다. 또한 특히 이러한 매체혼탁에 의한 산란에 영향을 적게 받는다고 소개된 SS-OCT에 대해 서도 SD-OCT에 비해 얼마나 매체혼탁의 영향을 덜 받는지 에 대해 다양한 매체혼탁을 대상으로 하여 보고된 바는 없 었다.
한편 OCT의 영상의 질 평가에 대한 기준들은 다양하게 제시되어 왔는데, 기존의 객관적 지표인 signal strength (SS)나 signal to noise ratio (SNR)7,9 이외에도 signal devia- tion (SD)10, quality index (QI)9 및 주관적 평가 지표인 sub- jective grading scores (SGS)11 등의 지표들의 유용성이 제 안되어 왔다. 객관적 지표들은 대부분 OCT 기기 제작 회사 에 따라 내재된 software마다 계산하는 방식이 달라 통일성 있게 OCT의 영상의 질을 비교하는 데에 어려움이 있
어,12,13 SGS는 이러한 단점을 극복하고자 9개의 기준 항목
에 대하여 점수를 매기는 방식으로 제안된 지표이다.
본 연구에서는 SD-OCT는 3D SD-OCT (Topcon Corporation, Tokyo, Japan), SS-OCT는 DRI-OCT (Topcon Corporation, Tokyo, Japan)를 이용하여 객관적 지표로서 Topcon사의 OCT 기기에 내장된 지표인 quality factor (QF)를, 그리고 주관적 지표로서 SGS를 이용하여 영상의 질을 평가하여, 정상 및 매체혼탁이 있는 안에서 SD-OCT와 SS-OCT의 영 상의 질 차이를 비교하였고 매체혼탁의 종류 및 매체혼탁 의 정도가 그 영상의 질 차이에 미치는 영향에 대해 비교 분석해 보고자 하였다.
대상과 방법
대상 환자군
2013년 9월 1일부터 2015년 6월 30일까지 내원한 환자 들 중 정상안 40안, 매체혼탁이 있는 안 60안(백내장 30안, 유리체혼탁 20안, 각막혼탁 10안)을 대상으로 하여 후향적
으로 의무기록을 분석하였다. 정상안은 세극등 현미경 검 사상에서 매체혼탁이 없고 SD-OCT QF가 60을 넘는 경우 로 정의하였고 매체혼탁이 있는 안은 SD-OCT QF가 50 미 만인 경우로 정의하였다.
검사
모든 대상자에서 병력조사, 시력측정, 세극등 현미경을 이용한 전안부검사, 안저검사, 안저촬영, SD-OCT (3D SD-OCT) 및 SS-OCT (DRI-OCT) 검사를 시행하였다.
3D SD-OCT & SS-OCT protocol 및 영상의 질 평가 SD-OCT는 3D SD-OCT (Topcon Corporation, Tokyo, Japan [software version 7.11]), SS-OCT는 DRI-OCT (Topcon Corporation, Tokyo, Japan)를 이용하였고 한 명의 검사자에 의해 모든 대상안에서 두 촬영 장비의 6×6 mac- ula scan 촬영이 시행되었다.
객관적인 영상의 질 측정은 SD-OCT 및 SS-OCT 검사장 비에 내장된 QF로 측정하였고, 주관적인 영상의 질 측정은 Huang et al11의 연구에서 발표된 바 있는 SGS를 사용하여 망막전문의 2명이 200개의 영상 각각을 0-9점으로 점수화 하였다(Fig. 1). SGS의 기준이 되는 9가지 항목은 아래와 같으며, 두 평가자 간의 점수가 일치하지 않을 때는 두 점 수의 평균치를 사용하였다.
(1) 외측망막-맥락막복합체와 유리체 사이의 반사도 차
A B
C
D E
F
G H
I
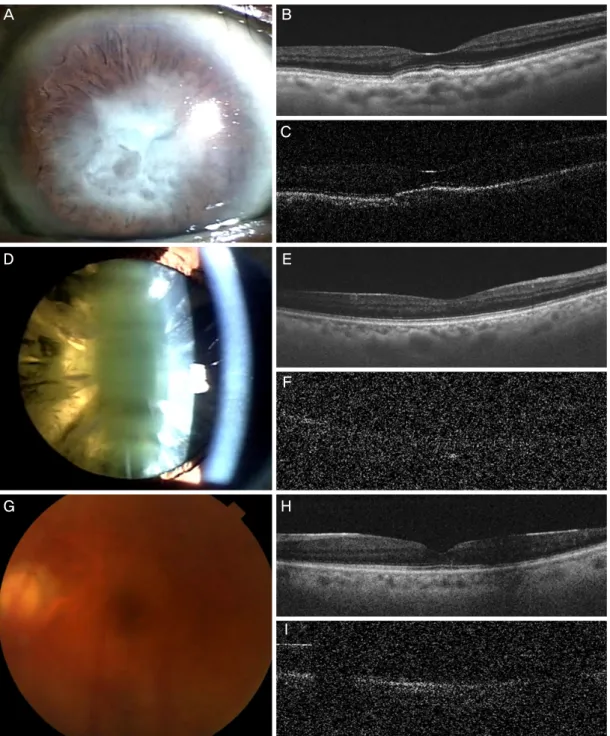
Figure 2. Representative cases of ocular media opacity. (A-C) A case of corneal opacity. Anterior segment photograph shows dense
central corneal opacity (A). After dilating of pupil, SS-OCT and SD-OCT images were obtained. The b-scan image of SS-OCT shows relatively clear borders of each retinal layers and visualizes choroidal/scleral interface clearly (B), but in SD-OCT image, the borders of each layer are obscure and choroidal/scleral interface is not shown (C). (D-F) A case of cataract (lens opacity). Anterior segment photograph shows severe nuclear and cortical cataract (D). In the b-scan image of SS-OCT, each layers of retina are vi- sualized (E). The b-scan image of SD-OCT could not visualize the layers (F). (G-I) A case of vitreous hemorrhage (vitreous opac- ity). In the fundus photograph, vitreous hemorrhage is shown and the fundus looks hazy (G). The b-scan image of SS-OCT (H) shows relatively clear view of each layers of retina and choroidal/scleral interface than the b-scan image of SD-OCT (I). SD-OCT= spectral domain optical coherence tomography; SS-OCT = swept-source optical coherence tomography.
이 여부
(2) 유리체-망막 경계면의 가시성 여부
(3) 유리체와 망막신경섬유층 사이의 반사도 차이 여부
(4) 유리체와 망상층 사이의 반사도 차이 여부 (5) 외측망막-맥락막복합체의 여러 층의 가시성 여부 (6) 신경절세포층의 가시성 여부
Table 1. Comparison of objective and subjective quality parameter measurements of SD-OCT and SS-OCT according to type of me-
dia opacityParameters Normal (n = 40)
Media opacity (n = 60)
Total (n = 100) Cataract
(n = 30)
Vitreous opacity (n = 20)
Corneal opacity (n = 10)
Mean p-value* Mean p-value* Mean p-value† Mean p-value† Mean p-value*
QF <0.001 <0.001 <0.001 0.005 <0.001
SD-OCT 67.61 ± 4.23 25.80 ± 13.63 16.56 ± 13.57 7.25 ± 4.12 38.82 ± 26.18
SS-OCT 84.83 ± 9.96 65.67 ± 20.59 40.90 ± 24.96 26.30 ± 13.77 64.44 ± 26.97
SGS <0.001 <0.001 <0.001 0.004 <0.001
SD-OCT 7.80 ± 0.46 2.83 ± 1.53 2.35 ± 1.57 2.50 ± 1.78 4.69 ± 2.84
SS-OCT 8.98 ± 0.16 7.67 ± 1.47 5.95 ± 2.37 5.60 ± 3.20 7.64 ± 2.09
Values are presented as mean ± SD.
SD-OCT = spectral domain optical coherence tomography; SS-OCT = swept-source optical coherence tomography; QF = quality factor, ob- jective parameter; SGS = subjective grading scale, subjective parameter.
*Paired t-test; †Wilcoxon signed-rank test for paired data.
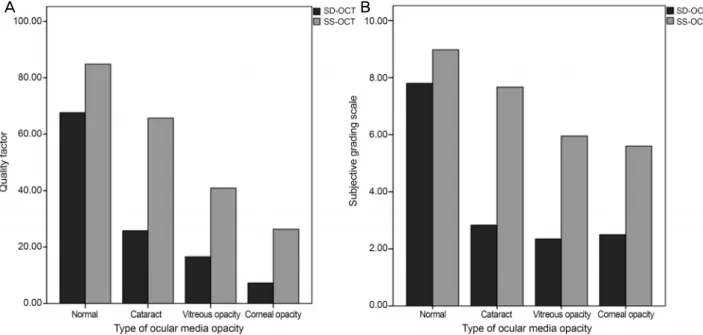
Figure 3. Image quality of SD-OCT and SS-OCT in normal and each ocular media opacity groups. (A) Comparison of objective
quality parameter (quality factor, QF) of SD-OCT and SS-OCT according to type of ocular media opacity. (B) Comparison of sub- jective quality parameter (subjective grading scale, SGS) of SD-OCT and SS-OCT according to type of ocular media opacity.SD-OCT = spectral domain optical coherence tomography; SS-OCT = swept-source optical coherence tomography.
(7) 유리체와 외핵층 사이의 반사도 차이 여부 (8) 외경계막의 가시성 여부
(9) 맥락막-공막 경계면의 가시성 여부
매체혼탁의 정도에 따른 영상의 질을 비교하기 위해 각 영상의 매체혼탁 정도는 SD-OCT의 QF를 이용하여 두 군 (Group I: 20≤QF<50, Group II: 0≤QF<20)으로 분류하였다.
통계
통계학적 분석은 SPSS (version 18.0, SPSS Inc., Chicago, IL, USA)를 사용하였다. 정상안과 각 매체혼탁 안에서
SS-OCT와 SD-OCT로 얻은 QF와 SGS 측정치의 비교에는 Paired t-test와 Wilcoxon signed-rank test를 이용하였다. 일 원분산분석(one-way analysis of variance, ANOVA)을 이용 하여 매체혼탁의 종류에 따른 세 군 간의 영상의 질 차이를 비교하였고, 매체혼탁의 정도에 따라 분류한 두 군 간의 비 교에는 Independent t-test을 이용하였다. 유의수준은 p-value 값 0.05 미만으로 정하였다.
결 과
SD-OCT와 SS-OCT의 영상의 질을 매체혼탁의 종류별로
A B
Table 2. Comparison of objective and subjective quality parameter measurements of SD-OCT and SS-OCT according to degree of
media opacitySD-OCT QF
Media opacity (n = 60)
Normal: QF ≥ 60 (n = 40) Group I: 20 ≤ QF < 50 (n = 28) Group II: 0 ≤ QF < 20 (n = 32)
Mean p-value* Mean p-value* Mean p-value*
QF <0.001 <0.001 <0.001
SD-OCT 32.55 ± 8.50 8.32 ± 6.17 67.61 ± 4.23
SS-OCT 68.11 ± 16.28 35.75 ± 23.85 84.83 ± 9.96
SGS <0.001 <0.001 <0.001
SD-OCT 3.43 ± 1.14 1.91 ± 1.57 7.80 ± 0.46
SS-OCT 8.00 ± 1.02 5.66 ± 2.56 8.98 ± 0.16
Values are presented as mean ± SD.
SD-OCT = spectral domain optical coherence tomography; SS-OCT = swept-source optical coherence tomography; QF = quality factor, ob- jective parameter; SGS = subjective grading scale, subjective parameter.
*Paired t-test.
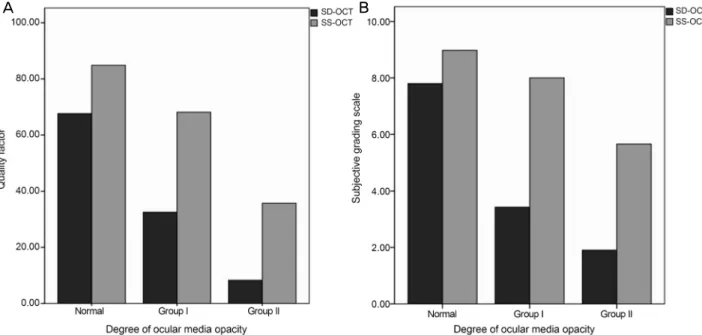
Figure 4. Image quality of SD-OCT and SS-OCT in each severity groups of ocular media opacity. (A) Comparison of objective qual-
ity parameter (quality factor, QF) of SD-OCT and SS-OCT according to degree of ocular media opacity. (B) Comparison of sub- jective quality parameter (subjective grading scale, SGS) of SD-OCT and SS-OCT according to degree of ocular media opacity.SD-OCT = spectral domain optical coherence tomography; SS-OCT = swept-source optical coherence tomography.
Table 3. Comparison of image quality difference between SS-OCT and SD-OCT according to type of media opacity
Type of media opacity Mean p-value*
Cataract (n = 30) Vitreous opacity (n = 20) Corneal opacity (n = 10)
SSQF-SDQF† 39.87 ± 18.86 24.34 ± 16.46 19.05 ± 9.96 31.22 ± 18.88 0.188
SSSGS-SDSGS‡ 4.83 ± 1.44 3.60 ± 1.57 3.10 ± 1.45 4.13 ± 1.63 0.635
Values are presented as mean ± SD.
SS-OCT = swept-source optical coherence tomography; SD-OCT = spectral domain optical coherence tomography.
*One-way analysis of variance (ANOVA); †SS-OCT quality factor (QF)–SD-OCT QF; ‡SS-OCT subjective grading scale (SGS)–SD-OCT SGS.
비교해 보았고(Fig. 2; 각막혼탁, 수정체혼탁 및 유리체혼탁 의 예) 정상군과 각각의 매체혼탁군 모두에서 객관적 측정 치(QF)와 주관적 측정치(SGS)로 평가한 영상의 질이 SS- OCT에서 SD-OCT보다 통계적으로 유의하게 좋다는 결과
를 보였다(Table 1, Fig. 3; all p<0.01).
SD-OCT의 QF를 기준으로 하여 매체혼탁의 정도를 분 류하였고, 이를 이용해 매체혼탁의 정도에 따른 각 군별 SD-OCT와 SS-OCT의 영상의 질을 비교하였다. 정상군과
A B
Table 4. Comparison of image quality difference between SS-OCT and SD-OCT according to degree of material opacity
Grading of Media OpacityMean p-value*
Group I: 20 ≤ QF < 50 (n = 28) Group II: 0 ≤ QF < 20 (n = 32)
SSQF-SDQF† 35.56 ± 14.20 27.43 ± 21.70 31.22 ± 18.88 0.088
SSSGS-SDSGS‡ 4.57 ± 1.20 3.75 ± 1.87 4.13 ± 1.63 0.051
Values are presented as mean ± SD.
SS-OCT = swept-source optical coherence tomography; SD-OCT = spectral domain optical coherence tomography; QF = quality factor.
*Independent t-test; †SS-OCT QF–SD-OCT QF; ‡SS-OCT subjective grading scale (SGS)–SD-OCT SGS.
Group I, II 모두에서 객관적 측정치(QF)와 주관적 측정치 (SGS)로 평가한 영상의 질이 SS-OCT에서 SD-OCT보다 통 계적으로 유의하게 좋다는 결과를 보였다(Table 2, Fig. 4;
all p<0.001)
SS-OCT와 SD-OCT 간의 영상의 질 차이가 매체혼탁의 종류에 영향을 받는지의 여부를 보기 위해 QF와 SGS 각각 의 SS-OCT와 SD-OCT 차이 값을 매체혼탁의 종류에 따른 세 군 간에 비교해 본 결과, QF와 SGS에서 모두 매체혼탁 의 종류에 따른 유의한 차이는 없었다(Table 3; p=0.188, 0.635, respectively).
SS-OCT와 SD-OCT 간의 영상의 질 차이가 매체혼탁의 정도에 영향을 받는지의 여부를 보기 위해 마찬가지로 QF 와 SGS 각각의 SS-OCT와 SD-OCT 차이 값을 매체혼탁의 정도에 따른 두 군(Group I, II) 간에 비교해 본 결과, QF와 SGS에서 모두 매체혼탁의 정도에 따른 유의한 차이는 없 었다(Table 4. p=0.088, 0.051, respectively).
고 찰
OCT는 빛을 이용한 검사로서, 그 빛의 경로상에 존재하 는 매체의 혼탁에 의해 그 영상의 질이 영향을 받을 수 있 으며14 이때 영상의 질을 저하시키는 주 원인은 빛의 경로 상에 존재하는 매체에 의한 빛의 산란과 흡수이다. 이로 인 해 목표 조직 내 OCT 스캔 지점에서의 빛이 약화되고, 이 로 인해 영상의 질 저하가 일어나게 된다.15
산란에 있어서는 빛의 파장이 길수록 산란이 증가하고, 흡수에 있어서는 흡수가 주로 일어나는 파장대가 산화헤모 글로빈에 의한 200-600 nm대 영역과 물에 의한 1,000 nm 이상 대로 알려져 있어 기존의 OCT는 그 사이인 800 nm대 의 파장대가 가장 이상적인 것으로 알려져 있었다.14 그러 나 이 영역대의 파장은 망막과 맥락막모세혈관/맥락막의 상 층부를 보여주기에는 좋지만 망막색소상피층에서의 높은 산 란과 흡수 때문에 투과 깊이에 한계가 있어 망막을 넘어서는 뒤쪽의 구조물을 보여주는 데에는 제한이 있다.16,17 망막색소 상피층에서 빛의 투과가 감소되는 것은 색소상피층의 주 발 색단(chromophore)인 멜라닌에서 일어나는 빛의 산란과 흡 수 때문인데, 멜라닌에서의 빛의 흡수는 600-1,200 nm 사이
의 파장 대에서 파장이 증가할수록 감소하는 성질을 갖고, 또한 산란 역시 일반적으로 생체 조직 내에서 파장이 길어 질수록 감소하는 성질을 갖는다.16,17 따라서 파장이 길수록 투과가 증가할 것으로 볼 수 있는데, 한 가지 한계점은 안구 내의 매체는 대부분 물로 이루어졌고 물에서는 빛의 파장이 길수록 흡수가 증가한다는 사실이다.16,17 그러나 American National Standard for Safe Use of Lasers by American National Standards Institute (ANSI Standard Z136)에 따르 면 안구 내에서는 파장이 길수록 빛에 대한 최대 허용 노출 량(maximum permissible light exposure)이 증가하기 때문 에, 결국 1,050 nm대 파장에서 850 nm대 파장에서보다 더 높은 투과성을 보인다는 것이 증명되었다.16
이러한 원리에 의해 SS-OCT는 1,050 nm의 파장을 이용 해 깊은 안구 조직에서 더 높은 해상도의 이미지를 보여줄 수 있는 검사로써 활용될 수 있으며, 앞서 언급하였듯 850 nm의 파장을 사용하는 SD-OCT에 비해 빛의 산란 효과를 덜 받는다는 특징이 있다. 따라서 안구 내 빛의 경로에 존 재하는 각막, 수정체 그리고 유리체와 같은 매체에 혼탁이 있을 때에도 그 혼탁에 의한 산란 효과가 상대적으로 적어, 더 높은 질의 영상을 얻을 수 있을 것으로 생각될 수 있다. 이전의 연구들에서, 백내장이 있는 안에서 SD-OCT의 영상 의 질이 떨어지고 SS-OCT를 이용했을 때 백내장이 있는 안에서 SD-OCT에 비해 우월한 질의 후극부 영상을 얻을 수 있었다는 결과들은 언급된 바 있었다.1,18,19 그러나 각막 이나 유리체의 혼탁까지 포함하여 다양한 매체 혼탁에 있 어 SS-OCT의 영상의 질의 우월성에 대해 연구된 바는 지 금까지 없었다.
매체혼탁에 의한 SD-OCT의 영상의 질 저하의 임상적 의의는 백내장이 있는 안에서 백내장 수술 전후의 SD-OCT 측정치의 비교에 대한 연구들에서 언급된 바 있다.6-8,20 백 내장에 의해 광학적 매질을 통과하는 빛의 양을 감소시키 고 이로 인해 투과율이 낮아져 신호강도가 감소됨으로써 측정하려는 망막층의 반사율을 낮게 만들게 되고, 결국 OCT의 software가 망막층의 윤곽을 나타내기 어려워 측정 하려는 층의 두께를 얇게7,8,20 혹은 두껍게6 측정하게 된다.
이러한 연구들은 매체혼탁이 있는 안에서 SD-OCT를 이용 한 질병의 진단 및 질병의 경과 판단에 있어 오류의 가능성
이 있을 수 있음을 시사한다.
본 연구에서는 수정체의 혼탁인 백내장뿐만 아니라 유리 체의 혼탁, 각막의 혼탁에 있어서도 SS-OCT는 SD-OCT에 비해 매체혼탁에 의한 산란 효과를 적게 받아 더 나은 영상 의 질을 보여준다는 것을 객관적, 주관적 측정치로 확인할 수 있었다. 또한 이 영상의 질의 우월성은 매체혼탁의 종류 나 정도에 관계없이 나타난다는 것을 알 수 있었다.
본 연구의 한계점으로는 매체혼탁의 정도와 종류에 따른 각 군의 대상자 수가 균일하지 못하였고 각막혼탁군의 수 가 적었다는 점을 들 수 있겠다. 이로 인해 통계적 분석 및 해석에 있어 다소 오차가 있었을 것으로 생각할 수 있다.
그러나 본 연구는 백내장 이외의 매체혼탁에 대하여 SS-OCT와 SD-OCT의 영상의 질을 비교한 첫 연구이며, 매 체혼탁의 종류나 정도에 관계없이 SS-OCT가 SD-OCT에 비해 우월한 영상의 질을 보임을 밝혔다는 점에 그 의의가 있다고 볼 수 있다. 결론적으로 본 연구에서 SS-OCT는 객 관적 및 주관적 평가에 있어서 매체의 종류나 정도에 관계 없이 SD-OCT에 비해 좋은 영상의 질을 보여줄 수 있었으 며, 이는 질병의 진단 및 경과에 대한 평가에 도움을 줄 수 있을 것으로 여겨진다.
REFERENCES
1) Povazay B, Hermann B, Unterhuber A, et al. Three-dimensional optical coherence tomography at 1050 nm versus 800 nm in retinal pathologies: enhanced performance and choroidal penetration in cataract patients. J Biomed Opt 2007;12:041211.
2) Chen Y, Burnes DL, de Bruin M, et al. Three-dimensional point- wise comparison of human retinal optical property at 845 and 1060 nm using optical frequency domain imaging. J Biomed Opt 2009;
14:024016.
3) Lee EC, de Boer JF, Mujat M, et al. In vivo optical frequency do- main imaging of human retina and choroid. Opt Express 2006;
14:4403-11.
4) Hirata M, Tsujikawa A, Matsumoto A, et al. Macular choroidal thickness and volume in normal subjects measured by swept- source optical coherence tomography. Invest Ophthalmol Vis Sci 2011;52:4971-8.
5) Yasuno Y, Hong Y, Makita S, et al. In vivo high-contrast imaging of deep posterior eye by 1-microm swept source optical coherence to- mography and scattering optical coherence angiography. Opt Express 2007;15:6121-39.
6) Ching HY, Wong AC, Wong CC, et al. Cystoid macular oedema and changes in retinal thickness after phacoemulsification with op- tical coherence tomography. Eye (Lond) 2006;20:297-303.
7) van Velthoven ME, van der Linden MH, de Smet MD, et al.
Influence of cataract on optical coherence tomography image qual- ity and retinal thickness. Br J Ophthalmol 2006;90:1259-62.
8) Kok PH, van den Berg TJ, van Dijk HW, et al. The relationship be- tween the optical density of cataract and its influence on retinal nerve fibre layer thickness measured with spectral domain optical coherence tomography. Acta Ophthalmol 2013;91:418-24.
9) Stein DM, Ishikawa H, Hariprasad R, et al. A new quality assess- ment parameter for optical coherence tomography. Br J Ophthalmol 2006;90:186-90.
10) Liu S, Paranjape AS, Elmaanaoui B, et al. Quality assessment for spectral domain optical coherence tomography (OCT) images.
Proc SPIE Int Soc Opt Eng 2009;7171:71710X.
11) Huang Y, Gangaputra S, Lee KE, et al. Signal quality assessment of retinal optical coherence tomography images. Invest Ophthalmol Vis Sci 2012;53:2133-41.
12) Giani A, Cigada M, Choudhry N, et al. Reproducibility of retinal thickness measurements on normal and pathologic eyes by differ- ent optical coherence tomography instruments. Am J Ophthalmol 2010;150:815-24.
13) Geitzenauer W, Kiss CG, Durbin MK, et al. Comparing retinal thickness measurements from Cirrus spectral domain- and Stratus time domain-optical coherence tomography. Retina 2010;30:596-606.
14) van Velthoven ME, Faber DJ, Verbraak FD, et al. Recent develop- ments in optical coherence tomography for imaging the retina.
Prog Retin Eye Res 2007;26:57-77.
15) Kok PH, van Dijk HW, van den Berg TJ, Verbraak FD. A model for the effect of disturbances in the optical media on the OCT image quality. Invest Ophthalmol Vis Sci 2009;50:787-92.
16) Unterhuber A, Povazay B, Hermann B, et al. In vivo retinal optical coherence tomography at 1040 nm - enhanced penetration into the choroid. Opt Express 2005;13:3252-8.
17) Povazay B, Bizheva K, Hermann B, et al. Enhanced visualization of choroidal vessels using ultrahigh resolution ophthalmic OCT at 1050 nm. Opt Express 2003;11:1980-6.
18) Esmaeelpour M, Povazay B, Hermann B, et al. Three-dimensional 1060-nm OCT: choroidal thickness maps in normal subjects and improved posterior segment visualization in cataract patients.
Invest Ophthalmol Vis Sci 2010;51:5260-6.
19) Ikuno Y, Kawaguchi K, Nouchi T, Yasuno Y. Choroidal thickness in healthy Japanese subjects. Invest Ophthalmol Vis Sci 2010;
51:2173-6.
20) Mwanza JC, Bhorade AM, Sekhon N, et al. Effect of cataract and its removal on signal strength and peripapillary retinal nerve fiber layer optical coherence tomography measurements. J Glaucoma 2011;20:37-43.
= 국문초록 =
매체혼탁에 따른 파장가변 빛간섭단층촬영과 스펙트럼영역 빛간섭단층촬영 영상의 질 비교
목적: 안구 매체혼탁이 있는 안에서 파장가변 빛간섭단층촬영(swept-source optical coherence tomography, SS-OCT)과 스펙트럼 영역 빛간섭단층촬영(spectral domain optical coherence tomography, SD-OCT) 영상의 질을 비교하고자 하였다.
대상과 방법: 정상 40안, 매체혼탁 60안(백내장 30안, 유리체혼탁 20안, 각막혼탁 10안)에서 SS-OCT와 SD-OCT의 6×6 macular scan을 시행하였다. 각 영상에 대해 영상의 질의 객관적 지표로 quality factor (QF)를, 주관적 지표로 subjective grading scale (SGS)을 측정하여 정상안과 매체혼탁안에서의 영상의 질 차이를 비교하고 매체혼탁의 종류와 정도에 따른 영상의 질 차이를 비교하 였다.
결과: 정상안과 매체혼탁안 모두에서 SD-OCT에 비해 SS-OCT에서 객관적 지표, 주관적 지표 모두 더 높은 영상의 질을 보였다 (p<0.001). SS-OCT와 SD-OCT의 영상의 질 차이는 매체혼탁의 종류에 따른 유의한 차이는 없었고(QF: p=0.188, SGS: p=0.635), SD-OCT QF를 기준으로 매체혼탁의 정도에 따라 분류한 두 군(Group I: 20≤QF<50, II: 0≤QF<20) 간의 비교에서도 유의한 차이는 보이지 않았다(QF: p=0.088, SGS: p=0.051).
결론: SS-OCT는 매체혼탁의 종류나 정도에 관계없이 SD-OCT에 비해 개선된 영상의 질을 보여주며, 이는 매체혼탁안에서 정확한 질병 진단 및 경과 평가에 도움이 될 것으로 여겨진다.
<대한안과학회지 2016;57(2):248-255>