Corrosion characteristics and interfacial contact resistances of TiN and CrN coatings deposited by PVD on 316L stainless steel for
polymer electrolyte membrane fuel cell bipolar plates
Jae-Bong Lee†and In Hwan Oh
School of Advanced Materials Engineering, Kookmin University, 861-1 Jeongneung-dong, Seongbuk-gu, Seoul 136-702, Korea (Received August 09, 2013; Revised August 23, 2013; Accepted August 26, 2013)
In a polymer membrane fuel cell stack, the bipolar plate is a key element because it accounts for over 50%
of total costs of the stack. In order to lower the cost of bipolar plates, 316L stainless steels coated with nitrides such as TiN and CrN by physical vapor deposition were investigated as alternative materials for the replacement of traditional brittle graphite bipolar-plates. For this purpose, interfacial contact resistances were measured and electrochemical corrosion tests were conducted. The results showed that although both TiN and CrN coatings decreased the interfacial contact resistances to less than 10 mΩ·cm2, they did not significantly improve the corrosion resistance in simulated polymer electrolyte membrane fuel cell environments.
A CrN coating on 316L stainless steel showed better corrosion resistance than a TiN coating did, indicating the possibility of using modified CrN coated metallic bipolar plates to replace graphite bipolar plates.
Keywords : Fuel cell, Bipolar plate, Stainless steel, CrN, TiN, PEMFC
†Corresponding author: [email protected]
1. Introduction
Fuel cells are promising alternative energy sources for solving the problems of exhaustion of oil resources and environmental pollution; they are environmentally friendly and have high efficiencies for electricity generation. Among the various fuel cells, polymer electrolyte membrane fuel cells (PEMFCs) have advantages such as relatively low op- erating temperatures, high current output densities and fast responses with short start-up times, so it is expected that they will be used in many fields such as in automotive applications and as portable power sources.1)
One of the main issues for commercialization of PEMFCs is the development of suitable bipolar plates; the bipolar plate accounts for over 50% of the total stack cost and most of the total stack weight. It is therefore necessary to reduce the cost and weight of the bipolar plate for commercial ap- plications of PEMFC. The traditional material for bipolar plates is non-porous graphite. However, the fabrication of graphite bipolar plates is so difficult and expensive because of their brittleness, so alternative bipolar plates of reasonable costs and with suitable properties need to be developed.2) The bipolar plates in stacks have important functions such as carrying the electric currents away from each cell, distributing the fuel and oxidant homogeneously within in-
dividual cells, and separating individual cells and facilitat- ing water managements within the cells.3) To perform these different functions, various materials have been proposed for the manufacture of bipolar plates. The main properties of the materials for bipolar plates have been well estab- lished by the United States Department of Energy (DOE) as summarized in Table 1.4)
Metallic bipolar plates such as stainless steel plates are attractive candidates because of their high resistance to mechanical shocks and vibrations, which could lead to cracking and leaking of reactant gases, good electrical con- ductivity, and ease of manufacture at low cost.5) However, stainless steels are prone to chemical attacks in the acidic and humid environments of PEMFCs. Stainless steels in fuel cells operating at pH of 2~4 and temperatures of
Table 1. Required chemical and physical properties of polymer elec- trolyte membrane fuel cell bipolar plates4)
Properties Required values
H2gaspermeability < 2Ⅹ10-6cm3cm-2·sec in 60~90℃, 3atm, (<0.1mAc m-2)
Corrosion resistance < 1㎂
cm-2(0.1V,H2anode)(0.6V,Aircathode)in 60~90℃, pH3, 1mM~1M
H2SO4/2ppmF-solution Interfacial contact
resistance
< 10mΩ·cm2in100~150Ncm-2 Cost <10 US$kW-1(500,000stack/year)
may face. Nitrides such as TiN, CrN and AlN are attractive candidates as coating materials for bipolar plates because of their excellent corrosion resistance and metal-like elec- trical conductivity. Li et al.7) reported that a TiN coating deposited by physical vapor deposition (PVD) on 316L stainless steel (SS316L) improved the corrosion resistance, and Cho et al.8) found that a TiN coating on an SS316L substrate gave good electrochemical performances in fuel cell environments.
This study focuses on SS316L coated with nitrides such as TiN and CrN, deposited by D.C magnetron sputtering as candidates for the replacement of graphite. The ICR val- ues between the nitride coatings and the gas diffusion layer (GDL) were measured. The corrosion characteristics of TiN and CrN nitrides coated on SS316L were also investigated in simulated anode and cathode environments for a PEMFC, using various electrochemical techniques such as potentio- dynamic polarization, potentiostatic polarization, and elec- trochemical impedance spectroscopy (EIS).
2. Experimental
2.1. Specimen preparation
D.C. magnetron sputtering was used for the deposition of TiN and CrN on SS316L. The chemical composition of SS316L is shown in Table 2. SS316L substrate samples were fabricated as disks of diameter 16 mm and thickness 3 mm.
Prior to deposition, they were polished with 320, 600, 800, and 1200 grit SiC abrasive papers, and 1 μm alumina pow- der, cleaned with acetone and distilled water in an ultrasonic cleaner after immersion in 7% H2SO4 for 10 sec for surface activation, and then finally dried with N2 gas.
Ti (99.9%) and Cr (99.9%) were prepared as target ma- terials for reaction with N2 gas to form TiN and CrN coatings. The chamber was evacuated to a base pressure below 1 × 10⁻⁶ Torr and the working pressure inside the chamber was 3 × 10⁻³ Torr. A gas mixture of N2 (99.99%)
The ICR values between both the coated and uncoated specimens and the GDLs, (SGL 10 series BA) were meas- ured using the changes with compaction force. The ICR measurement method used in this study is similar to that reported by Wang et al.9,10), except a decrease in the num- ber of interfaces in order to carry out more accurate and simpler measurements, as shown in Fig.1. According to the present method, the measured resistance (Rtotal) is twice the resistance between the GDL and the coating (RGDL/coating), and can be expressed as R total = 2 R GDL/coating. The compac- tion force per unit area ranged from 20 N cm-2 to 220 N cm-2.
Changes in the ICR values at a compaction pressure of 140 Ncm-2 were also investigated for various immersion times (0, 2, 24, 48, and 72 h) in the PEMFC working environment, i.e. 1 M H2SO4/2 ppm F- solution at 70 °C with H2 or air purging, to simulate the anodic or cathodic environment. The applied potential with respect to the sa- turated calomel electrode (SCE) was -0.1 VSCE for the anode or 0.6 VSCE for the cathode during immersion.
Fig. 1. Schematic setup for measurements of interfacial contact resistance.
(a) (b)
Fig. 2. Field-emission scanning electron microscopy images of surface morphologies of TiN (a) and CrN (b) coatings.
2.3 Electrochemical tests
Three electrochemical methods. namely potentiody- namic polarization, potentiostatic polarization and EIS tests were used to investigate the corrosion characteristics of the specimens. All the tests were carried out in a three-elec- trode system with a platinum counter electrode, and Ag/
AgCl, 3 M KCl electrode as the reference electrode, but all data were converted to SCE units. The PEMFC operat- ing environments were simulated in 1M aqueous H2SO4 con- taining 2 ppm F- at 70 °C, deaerated with H2 for the anode environment or aerated with air for the cathode environment, prior to and during testing. The exposed coating area was 0.7 cm2.
In the potentiodynamic polarization test, the initial po- tential was -0.2 V vs. the open circuit potential (OCP), and the final potential was 1.2 Vvs. SCE. All specimens were polarized with a scan rate of 0.5 mV s-1 after stabiliz- ing at OCP for 600 s. In the potentiostatic polarization, the change of current density was monitored for 72 h under the anodic or cathodic operating potential in the simulated PEMFC environments. The anodic and cathodic applied potentials were -0.1 VSCE with H2 purging and 0.6 VSCE
with air purging, respectively. After the tests, inductively coupled plasma (ICP) analysis was conducted by collect- ing a small amount of the solution to examine the concen- trations of metal ions dissolved from the specimens into the electrolyte.
The changes in polarization resistance (Rp) after each immersion were monitored for immersion times (0, 2, 24, 48, and 72h) in simulated PEMFC operating environments using EIS measurements. The applied potentials were –0.1 VSCE with H2 purging for the anodic conditions and 0.6VSCE
with air purging for the cathodic conditions, respectively.
Rp, was determined by applying alternating potential signals in the frequency range from 105 to 10-2 Hz with an ampli- tude of 10mV (rms), and the measurements were performed at the corrosion potentials after immersion.
3. Results and discussion
3.1 Surface morphologies of TiN and CrN coatings Although nitrides are known to be chemically stable, this study shows that nitride coatings could be removed in PEMFC environments. As nitride coatings were re- moved with immersion time, a larger area of SS316 sub- strate was gradually exposed to the electrolyte. This re- sulted from various defects such as pinholes and inclusion particles present in coating layers deposited by the PVD method.11) Therefore, in order to examine defects in the coating layers, the surface morphologies of the TiN and CrN coatings were observed using FE-SEM; the results are shown in Fig. 2.
Some micro pinholes were observed on both the TiN and CrN coating surfaces, but the sizes and incidences of pinholes differed. The TiN coating contained more and larger pinholes and inclusions than the CrN. This suggests that the TiN coating would be more vulnerable than the CrN coating to penetration of electrolyte through defects into the substrate.
3.2 ICR measurements of uncoated and coated specimens Fig. 3. shows the ICR measurement results for uncoated and coated specimens with various compaction forces. The ICR values of all the specimens gradually decreased with increasing compaction force, as a result of the the in- creased contact area between the specimen and the GDL.
Table 3. Interfacial contact resistance values of SS316L, and of TiN and CrN coatings as a function of compaction forces
Specimens ICR(mΩ·cm2)
20Ncm-2 40Ncm-2 60Ncm-2 80Ncm-2 100Ncm-2 120Ncm-2 140Ncm-2 160Ncm-2 180Ncm-2 200Ncm-2 220Ncm-2
SS316L 175.1 80.15 60.35 46.37 36.32 30.02 25.6 23.39 20.59 18.74 17.03
TiN 18.16 9.73 6.92 5.59 4.42 3.88 3.42 2.97 2.67 2.4 2.23
CrN 13.9 7.7 5.11 4.05 3.36 2.76 2.5 2.16 1.98 1.82 1.64
Fig. 3. Interfacial contact resistances of SS316L, TiN and CrN coatings as a function of compaction forces.
-10 0 10 20 30 40 50 60 70 80
0 10 20 30 40 50 60
ICR(mW×cm2 )
Immersion time (hr) SS316L(cathode)
SS316L(anode) TiN(cathode) TiN(anode) CrN(cathode) CrN(anode)
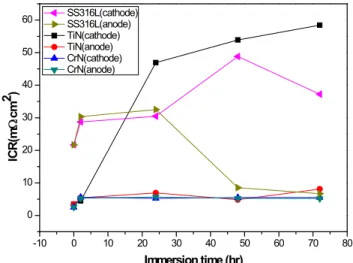
Fig. 4. Changes of interfacial contact resistances of SS316L, and of TiN and CrN coatings at 140 N cm-2 after immersion (0, 2, 24, 48, and 72 h) in the working cathodic and anodic environments in the polymer electrolyte membrane fuel cell.
The ICR values of both the TiN and CrN coatings were lower than that of bare SS316L. This resulted from the better electrical conductivities of the TiN and CrN coatings and the decreased conductivity as a result of the passive film on the SS316L. It is well known that the passive films formed on stainless steels can enhance corrosion re- sistance, increasing the ICR between the bipolar plate and
However, in the anodic environment, the ICR values of SS316 decreased with increasing immersion time. This can be explained by the fact that the dissolution rate of the passive film on SS316L may exceed the formation rate of the passive film at the anodic working potential of -0.1VSCE. The ICR values of the TiN coating increased dramatically after immersion in the cathodic environment.
This increase in ICR may be caused by formation of an oxide film on the coating or the passive film on the SS316L substrate exposed to electrolyte through defects such as pin holes, in the cathodic working environment.
In contrast, in the anodic environment, the TiN coating showed very stable ICR values, satisfying the DOE target criterion across the entire range of immersion times.
However, in the anodic environment, degradation of the TiN coating was observed after immersion, indicating that the SS316L substrate was widely exposed to the electrolyte.
This may be attributed to the loss of adhesion between the TiN coating and the substrate caused by corrosion products in defects and the formation of an unstable passive film formed on the substrate at the anodic working potential.
Therefore, the ICR values of the TiN coating in the anodic environment were like those of the exposed substrate with an unstable passive film instead of those of the TiN coating.
In contrast, the ICR values of the CrN coating were stable and low enough to satisfy the DOE target criterion in both cathodic and anodic environments.
3.3 Potentiodynamic polarization tests
The polarization curves for uncoated and coated speci- mens in simulated cathodic and anodic environments are
(a) (b)
Fig. 5. Potentiondynamic polarization curves of SS316L, and of TiN and CrN coatings in 1M H2SO4/2ppm F- at 70 °C purged with (a) air (cathode) and (b) H2 gas (anode). Working potentials of the cathode (0.6 VSCE) and anode (-0.1 VSCE) are marked with dotted lines.
shown in Fig. 5. The corrosion potentials (Ecorr) of SS316L, and of the TiN and CrN coatings in the cathodic environ- ment were -298mVSCE, -224mVSCE, and 117mVSCE, re- spectively; in the anodic environment, the corrosion poten- tials of SS316L, and of the TiN and CrN coatings were -317mVSCE, -235mVSCE and 69mVSCE, respectively, show- ing that the corrosion potentials in the cathodic environ- ment were slightly higher than those in the anodic environ- ment.
At the cathodic working potential of 0.6VSCE, (marked with a dotted line in Fig. 5(a)), the passive current densities increased in the order SS316L (11 μA cm-2) < CrN (39 μA cm-2) < TiN (111μA cm-2); at the anodic working po- tential of -0.1VSCE, (marked with a dotted line in Fig. 5(b)), the current densities increased in the order CrN (negative current density) < TiN (53μA cm-2) < SS316L (97μA cm-2).
These results indicate that SS316L showed the best corro- sion resistance in the cathodic working environment where- as in the anodic environment, the CrN coating with a neg- ative current density showed the best corrosion resistance.
Since corrosion could be initiated through defects such as pinholes in the PVD coating layer, the porosities (F (%)) of the TiN and CrN coatings were calculated using the fol- lowing equation (Eq. 1), proposed by Matthews12):
where Rpm is the polarization resistance of the substrate,
Rp is the polarization resistance of the coated specimen, Δ Ecorr is the corrosion potential difference between the sub- strate and the coating, and βa is the anodic Tafel constant of the substrate, SS316L. In order to measure the polar- ization resistances of each specimen more accurately, linear polarization test methods were used in simulated cathodic and anodic PEMFC environments. The anodic Tafel con- stant, βa values in the cathodic and anodic environments were 0.047 VSCEdecade-1 and 0.046 VSCEdecade-1, re- spectively obtained from the potentiodynamic polarization curves of SS316L. The polarization resistances of SS316L (Rpm) in the cathodic and anodic environments were 280.4 kΩ· cm2 and 174.5 kΩ· cm2, respectively. Table 4. shows the parameters and porosity values for the TiN and CrN coatings in the cathodic and anodic environments; the poros- ity of the CrN coating is much lower than that of the TiN coating in both the cathodic and anodic environments. Thus, the CrN coating may show more effective blocking of pene- tration of the electrolyte through defects into the substrate, and better corrosion resistance than the TiN coating does.
Table 4. Porosities of TiN and CrN coatings Specimens RpkΩ·cm2
(by linear polarization)
ΔEcorr
(mVSCE)
Porosity (%) TiN
Cathode 0.216 73.5 3.42
Anode 0.212 82.3 2.02
CrN
Cathode 15.84 414.5 2.62Х10-9
Anode 15.53 385.5 5.6 Х10-9
(a) (b)
Fig. 6. Potentiostatic polarization curves of SS316L, and of TiN and CrN coatings in simulated polymer electrolyte membrane fuel cell working environments: (a) at 0.6VSCE under air purging conditions (cathodic environment) and (b) at -0.1VSCE under H2 purging conditions (anodic environment).
3.4 Potentiostatic polarization tests
Fig. 6. shows the potentiostatic polarization curves ob- tained at 0.6 VSCE for the cathodic environment and -0.1VSCE
for the anodic environment. In both the cathodic and anodic environments, the current densities of SS316L decreased significantly in the initial stage of the test as a result of the formation of a passive film, and then became stable.
The current density of SS316L in the cathodic environment remained low and stable until the end of the test whereas in the anodic environment, the current density was unstable and reached about 8 μA cm-2 with increasing test time.
For the coated specimens, the TiN coating showed a higher and more unstable current density than the CrN coat- ing did in the cathodic environment. This is attributed to the much greater porosity of the TiN coating, compared with that of the CrN coating. The current densities were found to increase in the order SS316L < CrN < TiN.
In the case of the anodic environment, the TiN coating showed high current density values in the initial stage (within the initial 5 h period) because of the occurrence of corrosion in defects, resulting from the formation of an
unstable passive film on the exposed area of the SS316L substrate through defects. From then on, the current density of the TiN coating changed and became very similar to that of SS316L. This may be the result of degradation of the TiN coating caused by loss of adhesion between the substrate and the coating, and the wide area of the substrate exposed to the electrolyte. In contrast, the CrN coating showed a negative current density in the anodic environ- ment during the entire test. On the basis of these ob- servations, the results of the potentiostatic polarization tests agree with those of the potentiondynamic polarization.
Table 5. shows the results of ICP analysis of the dis- solved metal ions extracted from the electrolytes after po- tentiostatic polarization testing for 72 h with SS316L, and with the TiN and CrN coatings. In the anodic environment, the TiN coating had the highest total concentration of met- al ions (4.12 ppm) and the CrN coating had the lowest total concentration of metal ions (0.2ppm). This is in good agreement with the results of potentiostatic polarization tests. For all specimens, the concentration of Fe ions in the anodic environment was higher than that in the catho-
0 500 1000 1500 2000 2500 3000 3500 4000 0
500 1000 1500 2000 2500 3000 3500 4000
0hr 2hr 24hr 48hr 72hr
Z'' (W×cm2 )
Z' (W×cm2) (a)
0 10 20 30 40 50 60 70 80
-10 0 10 20 30 40 50
60 0hr
2hr 24hr 48hr 72hr
Z'' (W×cm
2 )
Z' (W×cm2) (b)
0 2000 4000 6000 8000 10000
0 2000 4000 6000 8000 10000
0hr 2hr 24hr 48hr 72hr
Z'' (W×cm
2 )
Z' (W×cm2) (c)
0 2000 4000 6000 8000 10000 12000 14000 0
2000 4000 6000 8000 10000 12000 14000
0hr 2hr 24hr 48hr 72hr
Z'' (W×cm
2 )
Z' (W×cm2 ) (d)
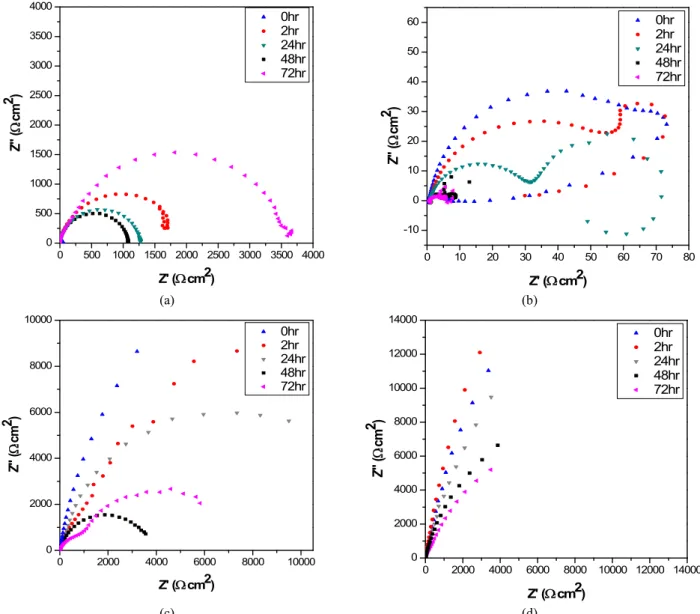
Fig. 7. Nyquist plots of electrochemical impedance spectroscopy data for different immersion times: (a) TiN coating in cathodic environment, (b) TiN coating in anodic environment, (c) CrN coating in cathodic environment, and (d) CrN coating in anodic environment.
dic environment, indicating that the SS316L substrate ex- posed to the anodic environment corroded more than that exposed to the cathodic environment. This is attributed to the unstable passivation of the substrate at the anodic working potential of -0.1 VSCE.
3.5 EIS tests
Fig. 7. shows the Nyquist plots of the TiN and CrN coatings various immersion times in the PEMFC working environments. The polarization resistances of the CrN coating were higher than those of the TiN coating in both the cathodic and anodic environments, showing that the CrN coating has better corrosion resistance.
In the cathodic environment, the polarization resistance of the TiN coating was very low in the initial stage of im-
mersion, but increased dramatically with ongoing immersion.
This can be explained by passivation of the substrate area exposed to the electrolytes through defects present in the coating layer. Moreover, it is found that the polarization re- sistance increased again after 72 h immersion because the formation rate of the passive film became much higher than its dissolution rate. Unlike the case in the cathodic environ- ment, the TiN coating in the anodic environment showed two time constants in Nyquist plots, as a result of the degra- dation of the TiN coating. In a previous study13), Nyquist plots of SS316L were found to be similar to those of TiN coated specimens, indicating that the SS316L substrate was widely exposed to the electrolyte as a result of degradation of the TiN coating.
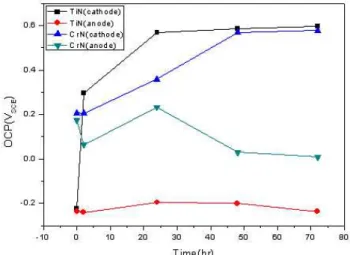
Fig. 8. Changes in open circuit potentials of TiN and CrN coatings with immersion time in working cathodic and anodic environments in polymer electrolyte membrane fuel cell.
In contrast, the polarization resistances of the CrN coat- ing decreased with increasing immersion time in both the cathodic and anodic environments. As mentioned above, the porosity of the CrN coating was much lower than that of the TiN coating, so the polarization resistance values of the CrN coating were high, without showing any coating degradation in both the cathodic and anodic environments, in spite of the decrease in polarization resistances with increasing immersion time. Fig. 8. shows changes in the OCPs of the TiN and CrN coatings with an increase in immersion time. The OCPs of both the TiN and CrN coat- ings in the cathodic environment increased with increasing immersion time, showing that the substrate exposed to the electrolyte through defects was stably passivated. However, in the anodic environment, significant changes in the OCPs with immersion time were not observed for either the TiN or CrN coatings.
4. Conclusions
316L stainless steels coated with TiN or CrN by D.C magnetron sputtering showed lower ICR values than that of bare 316L, and satisfied the DOE target criterion (<10m Ω· cm2). However, a significant increase in the ICR of the TiN (60mΩ·cm2) coating was found after immersion in a cathodic environment. Except for the TiN coating in the cathodic environment, the coatings showed stable and satisfactory ICR values after immersion in both cathodic and anodic environments in all cases.
In simulated PEMFC environments, the application of TiN and CrN coatings to a SS316 substrate did not sig-
able modification of the CrN coating is used, a more prom- ising possibility may exist for the replacement of conven- tional graphite materials with CrN coated metallic bipolar plates in PEMFCs.
Acknowledgements
This work was supported by National Research Foundation of Korea Grant Funded By the Korean Government under contract number 2009-0074278.
References
1. Y. Hung, K. M. El-Khatib, H. Tawfik, J. Power Sources, 163, 509 (2006).
2. H. Tawfik, Y. Hung, D. Mahajan, J. Power Sources, 163, 755 (2007).
3. J. S. Cooper, J. Power Sources, 129, 152 (2004).
4. A. Hermann, T. Chaudhuri, P. Spagnol, Int. J. Hydrogen Energy, 30, 1297 (2005).
5. R. A. Antunes, M. C. L. Oliveira, G. Ett, V. Ett, Int. J.
Hydrogen Energy, 35, 3632 (2010).
6. A. Kraytsberg, M. Auinat, Y. Ein-Eli, J. Power Sources, 164, 697 (2007).
7. M. Li, S. Luo, C. Zeng, J. Shen, H. Lin, C. Cao, Corros.
Sci., 46, 1369 (2007).
8. E. A. Cho, U. S. Jeon, S. A. Hong, I. H. Oh, S. G. Kang, J. Power Sources, 142, 177 (2005).
9. Y. Wang, D. O. Northwood, J. Power Sources, 165, 293 (2007).
10. Y. Wang, D. O. Northwood, J. Power Sources, 191, 483 (2009).
11. B. Elsener, A. Rota, H. Böhni, Mater. Sci. Forum, 44-45, 29 (1989).
12. B. Matthes, E. Broszeit, J. Aromaa, H. Ronkainen, S. P.
Hannula, A. Leyland, A. Matthews, Surf. Coat. Technol., 49, 489 (1991).
13. I. H. Oh and Jae-Bong Lee, Corros. Sci. Tech., 9, 129 (2010).