Prognostic Inflammation Score in Surgical Patients with Colorectal Cancer
Several inflammatory markers have been investigated as prognostic parameters in a variety of cancer population with mostly favorable results. This study aimed to verify the
significance of common inflammatory markers as prognostic variables and assess whether a selective combination of them as prognostic inflammation score (PIS) could further improve their prognostic values in surgical patients with colorectal cancer (CRC). A total of 265 patients who had undergone curative resection of CRC were reviewed retrospectively.
Preoperative levels of inflammatory markers such as serum C-reactive protein (CRP), erythrocyte sedimentation rate (ESR), white blood cell count (WBC), and neutrophil/
lymphocyte ratio (NLR) were assessed by uni- and multivariate survival analysis with disease-free (DFS) and disease-specific survival (DSS). PIS was constructed with a selective combination of inflammatory markers which were independently significant. On univariate analysis, CRP, ESR, and NLR were significantly associated with DFS and DSS. On
multivariate analysis, CRP and NLR were independently significant prognostic variables for DSS and DFS respectively (P = 0.013, P = 0.021). When PIS was constructed with combination of CRP and NLR, it was independently and significantly associated with both DFS and DSS (P = 0.006, P = 0.010). Furthermore, PIS was superior to CRP for DSS (HR = 15.679 vs. HR = 5.183), and NLR for DFS in terms of prognosticating power (HR = 4.894 vs. HR = 2.687). When PIS is constructed with combination of CRP and NLR, it is a potentially significant prognostic variable associated with poor survival regardless pathologic prognostic variables in patients with CRC after curative resection.
Keywords: Colorectal Neoplasms; Inflammation; C-reactive Protein, Erythrocyte Sedimentation Rate; White Blood Cell Count; Neutrophi/Lymphocyte Ratio Moo-Kyung Seong
Department of Surgery, Konkuk University School of Medicine, Seoul, Korea
Received: 9 June 2015 Accepted: 21 August 2015 Address for Correspondence:
Moo-Kyung Seong, MD
Department of Surgery, Konkuk University Medical Center, 120-1 Neungdong-ro, Gwanjin-gu, Seoul 05030, Korea Tel: +82.2-2030-7746, Fax: +82.2-2030-7749 E-mail: [email protected]
Funding: This study was supported by Konkuk University in 2015.
http://dx.doi.org/10.3346/jkms.2015.30.12.1793 • J Korean Med Sci 2015; 30: 1793-1799
INTRODUCTION
Currently, the cornerstone in predicting cancer prognosis is ac- curate staging of the tumor with precise estimation of pathologic tumor spread, which is entirely tumor-related. However, there is increasing interest about patient-related prognostic factors such as systemic inflammatory response. There are several common- ly used parameters for detecting systemic inflammation; serum level of C-reactive protein (CRP), erythrocyte sedimentation rate (ESR), white blood cell count (WBC), and neutrophil/lym- phocyte ratio (NLR). CRP is an essential acute phase reactant which is synthesized by hepatocytes in response to cytokine fol- lowing inflammatory stimulus (1). ESR is the measurement of red blood cell aggregation which increases when an enhance- ment in the total mass exceeds the increase in volume. When an inflammatory process is present, the high proportion of fibrino- gen in the blood causes red blood cells to stick to each other and increase their sedimentation (2). WBC is linked to neutrophilia which is a common host response to systemic inflammation.
Because neutrophilia is often accompanied by lymphocytope-
nia which has also been suggested as a predictor of inflamma- tion, NLR can be used as another index for the severity of sys- temic inflammation (3,4).
While many studies have been conducted to assess the prog- nostic significance of those inflammatory markers in a variety of cancer population including colorectal cancer (CRC), the measurement of systemic inflammation has been recently re- fined using a selective combination of each marker to improve the accuracy of predicting survival. Glasgow prognostic score with combination of CRP and albumin has been reported to have additional prognostic value in patients with various can- cers (5). Prognostic index with combination of CRP and WBC has also been reported to be obviously associated with survival in patients with lung cancer (6).
This study aimed to verify the significance of commonly used inflammatory markers (CRP, ESR, WBC, and NLR) as prognostic variables and to assess whether a selective combination of them could further enhance their prognostic values as Prognostic in- flammation score (PIS) in surgical patients with CRC.
Oncology & Hematology
MATERIALS AND METHODS Subject selection
All the patients who had undergone curative resection of CRC between January 2007 and October 2013 were reviewed, retro- spectively. Among the patients, those with coexisting inflamma- tory conditions such as bowel perforation or obstruction, preop- erative radiation or primary cancers in other organs, those died within 30 days of surgery and those without complete medical records or laboratory data were excluded. A total of 265 patients (163 males, 102 females) were included. Age was 67/34-95 (me- dian/range) years. Follow-up time was 39/2-101 (median/
range) months.
Database of the patients were searched to collect age (≤ 70,
> 70 yr), gender (male, female), tumor site (colon, rectum), pre- operative laboratory results and postoperative pathologic re- sults. Laboratory results included CRP, ESR, WBC, and NLR as inflammatory markers. Pathologic results included TNM stage of American Joint Committee on Cancer, cellular differentiation (well, moderate, and poor), lymphatic invasion (absent, pres- ent) and venous invasion (absent, present) as known prognos- tic variables.
Laboratory technique
Preoperative levels of inflammatory markers were determined with peripheral blood samples collected within 5 days before surgery. CRP was measured by latex-enhanced turbidimetric immunoassay, using a CRP latex (II) X2 (Denka Seiken Inc., To- kyo, Japan) with high-sensitivity application. Assay range of CRP was from 0.005 to 16 mg/dL. ESR was measured by TEST-1 SDL automated erythroid sediment rate analyzer (Alifax Inc., Polverara, Italy). WBC was determined using Sysmex XN-9000 hematology analyzer (Sysmex Inc., Hyogo, Japan). The NLR was calculated on the basis of WBC differential count with dividing the neutrophil count by the lymphocyte count.
Clinical course
Patients with stage III or IV colon cancer received postoperative chemotherapy. Some stage II patients who had pathological fea- tures of lymphatic/venous invasion or poor differentiation also received chemotherapy. Patients with stage II or III rectal cancer received postoperative chemoradiotherapy. Chemotherapy was done by standard regimens with 5-FU, oxaliplatin, or irinotecan.
The patients receiving chemotherapy were required to have as Eastern Cooperative Oncology Group performance status of less than 3 and to have adequate hematopoietic, renal, and hepatic function. None of the patients had received postoperative thera- py based on the preoperative data of inflammatory markers.
Patients were routinely followed up with three-month interval during first 3 yr postoperatively, six-month interval after three years, and annually after five years. When recurrence was de-
tected, appropriate treatment including surgical resection of the lesion or palliative chemotherapy was done. Follow-up or sur- vival time was defined as time from the date of surgery to last follow-up or death. Recurrence was defined as a lesion patho- logically proven recurrent adenocarcinoma, or a lesion which was suspicious on imaging study including PET scan. Deaths caused by progression of the disease were considered as an end point for survival. Deaths due to other intercurrent condition were regarded as censored observations.
Construction of PIS
PIS was constructed with a selective combination of preopera- tive levels of inflammatory markers, which were independently significant in survival analysis. Score allocation was done ac- cording to the number of elevated markers. When only one marker was elevated above cut-off value, score 1 was given, and when two markers were elevated, score 2 was given. When no marker was elevated, score 0 was given.
Statistical analysis
The best discriminating cut-off values for inflammatory mark- ers were defined by receiver-operating characteristic (ROC) curve analysis with disease-specific death as end-point. Rela- tionships between inflammatory markers and clinicopatholog- ic variables were assessed using contingency table with the chi- square test or log-likelihood ratio test. Survival analysis was done by Cox proportional hazards model (uni- and multivari- ate analysis, disease-free survival [DFS] and disease-specific survival [DSS]). Survival curves were made by Kaplan-Meier method and compared using log-rank test. A P value of less than 0.05 was considered significant. Statistical analysis was performed by dBSTAT 5.0 (dBSTAT Inc., Seoul, Korea) and SPSS 17.0 (SPSS Inc., Chicago, IL, USA).
Ethics statement
This study was approved by the institutional review board at Konkuk University Medical Center (KUH 1020061). Informed consent was exempted.
RESULTS
Cut-off values for each inflammatory marker defined from ROC curve analysis with disease-specific death as end-point were 0.4 mg/dL for CRP, 15 mm/h for ESR, 7.3 × 10⁹/L for WBC, and 2.4 for NLR. The areas under the curves were 0.745, 0.664, 0.605, and 0.678 in order of CRP, ESR, WBC, and NLR. Clinicopathologic characteristics of patients according to each inflammatory marker are shown in Table 1. There were no significant differ- ences between the groups, except for age in CRP (P = 0.004), ESR (P = 0.012), and NLR groups (P = 0.017), gender in ESR groups (P = 0.020), and stage in CRP (P = 0.001) and ESR groups
(P < 0.001).
On univariate survival analysis, CRP, ESR, and NLR among inflammatory markers were significantly associated with both DFS and DSS. Stage, lymphatic invasion and venous invasion among clinicopathologic variables were also significantly asso- ciated with both DFS and DSS (Table 2). Cellular differentiation could not be evaluated due to biased distribution. On multivari- ate analysis performed including all above significant prognos-
tic variables, CRP remained as independent and significant prognostic variable for DSS (HR = 5.183, P = 0.013), and NLR re- mained as such for DFS (HR = 2.687, P = 0.021) (Table 3). When PIS was constructed with combination of CRP and NLR, it was independently significant for both DFS and DSS (HR = 4.894, P = 0.006 for DFS; HR = 15.679, P = 0.010 for DSS) (Table 4).
Furthermore, it was superior to CRP for DSS (HR = 15.679 vs.
HR = 5.183) and also superior to NLR for DFS (HR = 4.894 vs.
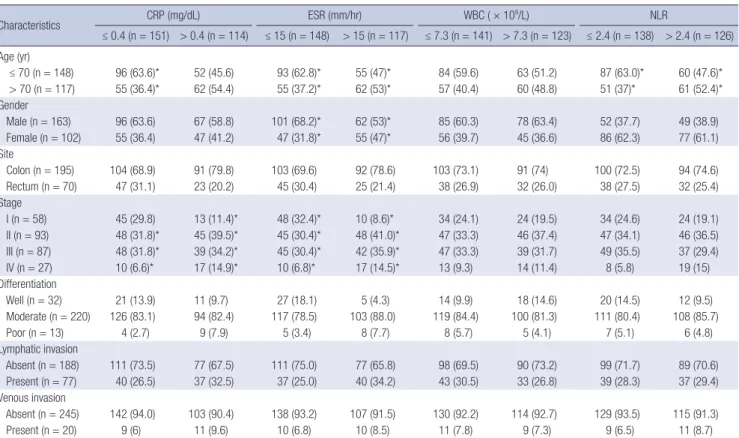
Table 1. Clinicopathologic characteristics of patients according to each inflammatory marker
Characteristics CRP (mg/dL) ESR (mm/hr) WBC ( × 109/L) NLR
≤ 0.4 (n = 151) > 0.4 (n = 114) ≤ 15 (n = 148) > 15 (n = 117) ≤ 7.3 (n = 141) > 7.3 (n = 123) ≤ 2.4 (n = 138) > 2.4 (n = 126) Age (yr)
≤ 70 (n = 148) 96 (63.6)* 52 (45.6) 93 (62.8)* 55 (47)* 84 (59.6) 63 (51.2) 87 (63.0)* 60 (47.6)*
> 70 (n = 117) 55 (36.4)* 62 (54.4) 55 (37.2)* 62 (53)* 57 (40.4) 60 (48.8) 51 (37)* 61 (52.4)*
Gender
Male (n = 163) 96 (63.6) 67 (58.8) 101 (68.2)* 62 (53)* 85 (60.3) 78 (63.4) 52 (37.7) 49 (38.9)
Female (n = 102) 55 (36.4) 47 (41.2) 47 (31.8)* 55 (47)* 56 (39.7) 45 (36.6) 86 (62.3) 77 (61.1) Site
Colon (n = 195) 104 (68.9) 91 (79.8) 103 (69.6) 92 (78.6) 103 (73.1) 91 (74) 100 (72.5) 94 (74.6)
Rectum (n = 70) 47 (31.1) 23 (20.2) 45 (30.4) 25 (21.4) 38 (26.9) 32 (26.0) 38 (27.5) 32 (25.4)
Stage
I (n = 58) 45 (29.8) 13 (11.4)* 48 (32.4)* 10 (8.6)* 34 (24.1) 24 (19.5) 34 (24.6) 24 (19.1)
II (n = 93) 48 (31.8)* 45 (39.5)* 45 (30.4)* 48 (41.0)* 47 (33.3) 46 (37.4) 47 (34.1) 46 (36.5) III (n = 87) 48 (31.8)* 39 (34.2)* 45 (30.4)* 42 (35.9)* 47 (33.3) 39 (31.7) 49 (35.5) 37 (29.4)
IV (n = 27) 10 (6.6)* 17 (14.9)* 10 (6.8)* 17 (14.5)* 13 (9.3) 14 (11.4) 8 (5.8) 19 (15)
Differentiation
Well (n = 32) 21 (13.9) 11 (9.7) 27 (18.1) 5 (4.3) 14 (9.9) 18 (14.6) 20 (14.5) 12 (9.5)
Moderate (n = 220) 126 (83.1) 94 (82.4) 117 (78.5) 103 (88.0) 119 (84.4) 100 (81.3) 111 (80.4) 108 (85.7)
Poor (n = 13) 4 (2.7) 9 (7.9) 5 (3.4) 8 (7.7) 8 (5.7) 5 (4.1) 7 (5.1) 6 (4.8)
Lymphatic invasion
Absent (n = 188) 111 (73.5) 77 (67.5) 111 (75.0) 77 (65.8) 98 (69.5) 90 (73.2) 99 (71.7) 89 (70.6) Present (n = 77) 40 (26.5) 37 (32.5) 37 (25.0) 40 (34.2) 43 (30.5) 33 (26.8) 39 (28.3) 37 (29.4) Venous invasion
Absent (n = 245) 142 (94.0) 103 (90.4) 138 (93.2) 107 (91.5) 130 (92.2) 114 (92.7) 129 (93.5) 115 (91.3)
Present (n = 20) 9 (6) 11 (9.6) 10 (6.8) 10 (8.5) 11 (7.8) 9 (7.3) 9 (6.5) 11 (8.7)
Data given in parenthesis is percentage in each subgroup. *Statistically significant difference (P < 0.05). CRP, C-reactive protein; ESR, erythrocyte sedimentation rate; WBC, white blood cell count; NLR, neutrophil/lymphocyte ratio.
Table 2. Univariate analysis for prognostic variables
Variables Disease-free survival Disease-specific survival
HR 95% CI P value HR 95% CI P value
Age ( ≤ 70, > 70 yr) 1.077 0.546-2.122 0.830 2.029 0.865-4.757 0.103
Gender (male, female) 1.570 0.801-3.076 0.188 2.273 0.971- 5.321 0.058
Tumor location (colon, rectum) 0.963 0.449-2.065 0.924 0.582 0.197-1.721 0.329
Stage (I; II, III, IV) 1.796 0.464-6.951 0.397 1.392 0.133-14.547 0.783
3.537 0.984-12.712 0.053 4.763 0.528-42.999 0.164
16.888 4.781-59.654 < 0.001 42.536 5.457-331.558 < 0.001
Differentiation (well, moderate, poor)* - - - - - -
Lymphatic invasion (absent, present) 2.356 1.199-4.630 0.013 3.884 1.655- 9.113 0.002
Venous invasion (absent, present) 3.180 1.313-7.702 0.010 5.884 2.287- 15.134 < 0.001
CRP ( ≤ 0.4, > 0.4 mg/dL) 3.305 1.579-6.917 0.002 8.860 2.619- 29.972 < 0.001
ESR ( ≤ 15, > 15 mm/hr) 2.262 1.118-4.575 0.023 2.575 1.047- 6.330 0.039
WBC ( ≤ 7.3, > 7.3 × 10⁹/L) 0.997 0.508- 1.956 0.992 1.357 0.586- 3.142 0.475
NLR ( ≤ 2.4, > 2.4) 3.896 1.763-8.610 0.001 5.242 1.773- 15.494 0.003
*Differentiation could not be evaluated because of biased distribution. CRP, C-reactive protein; ESR, erythrocyte sedimentation rate; WBC, white blood cell count; NLR, neutro- phil/lymphocyte ratio; HR, hazard ratio; CI, confidence interval.
HR = 2.687) in terms of prognosticating power (Tables 3, 4).
When stratified by PIS, 98 patients (37.0%) belonged to group of PIS 0, 89 patients (33.6%) to PIS 1, and 78 patients (29.4%) to PIS 2. Clinicopathologic characteristics of those patients are shown in Table 5. During the course of follow-up, 34 patients experienced recurrences. Thirty-three patients died, in whom 22 patients were due to progression of their cancers, 11 patients were due to other intercurrent diseases (Table 6). Stepwise as- sociation of PIS with DFS and DSS observed in survival curve analyses were shown in Fig. 1 and 2.
DISCUSSION
Inflammation has been known to have several ways of linkage with cancer development and progression. Chronic inflamma- tion may cause not only excessive cell proliferation, but also ac- Table 3. Multivariate analysis for prognostic variables
Variables Disease-free survival Disease-specific survival
HR 95% CI P value HR 95% CI P value
CRP ( ≤ 0.4, > 0.4 mg/dL) 1.813 0.803-4.094 0.152 5.183 1.424-18.862 0.013
ESR ( ≤ 15, > 15 mm/hr) 1.387 0.640-3.007 0.407 1.261 0.476-3.340 0.640
NLR ( ≤ 2.4, > 2.4) 2.687 1.162-6.216 0.021 2.632 0.840-8.245 0.097
Stage (I; II, III, IV) 1.428 0.345-5.912 0.623 1.392 0.133-14.547 0.783
3.304 0.769-11.965 0.113 4.763 0.528-42.999 0.164
12.841 3.069-53.714 < 0.001 24.742 2.571-238.035 0.005
Lymphatic invasion (absent, present) 0.796 0.343-1.849 0.597 0.839 0.287-2.447 0.748
Venous invasion (absent, present) 1.475 0.525-4.141 0.461 2.146 0.676-6.815 0.195
CRP, C-reactive protein; ESR, erythrocyte sedimentation rate; NLR, neutrophil/lymphocyte ratio; HR, hazard ratio; CI, confidence interval.
Table 4. Multivariate analysis for PIS and other prognostic variables
Variables Disease-free survival Disease-specific survival
HR 95% CI P value HR 95% CI P value
PIS (0;1,2) 2.182 0.634-7.503 0.216 4.588 0.481-43.799 0.186
4.894 1.568-15.279 0.006 15.679 1.951-126.012 0.010
ESR ( ≤ 15, > 15 mm/hr) 1.334 0.609-2.923 0.471 1.253 0.461-3.400 0.658
Stage (I; II, III, IV) 1.398 0.340-5.749 0.642 1.559 0.151-16.145 0.710
2.911 0.742-11.431 0.126 5.021 0.562-44.895 0.149
12.717 3.033-53.316 0.001 25.348 2.655-241.940 0.005
Lymphatic invasion (absent, present) 0.794 0.339-1.860 0.597 0.875 0.293-2.607 0.811
Venous invasion (absent, present) 1.459 0.516-4.125 0.476 2.202 0.672-7.208 0.192
PIS, prognostic inflammation score; ESR, erythrocyte sedimentation rate; HR, hazard ratio; CI, confidence interval.
Table 5. Clinicopathologic characteristics of patients according to PIS
Parameters PIS 0
(n = 98)
PIS 1 (n = 89)
PIS 2
(n = 78) P value Age, yr
≤ 70 (n = 148) 66 (67.4) 48 (53.9) 34 (43.6)
> 70 (n = 117) 32 (32.6) 41 (46.1) 44 (36.4) 0.006 Gender
Male (n = 163) 60 (61.2) 61 (68.5) 42 (53.9)
Female (n = 102) 38 (38.8) 28 (21.5) 36 (46.1) 0.149 Tumor location
Colon (n = 195) 68 (69.4) 67 (75.3) 60 (76.9)
Rectum (n = 70) 30 (30.6) 22 (24.7) 18 (23.1) 0.480 Stage
I (n = 58) 29 (29.6) 20 (22.5) 9 (11.5) II (n = 93) 33 (33.7) 29 (32.6) 31 (39.7) III (n = 87) 31 (31.6) 32 (36) 24 (30.8)
IV (n = 27) 5 (5.1) 8 (8.9) 14 (18) 0.021
Differentiation
Well (n = 32) 17 (17.4) 7 (7.8) 8 (10.3) Moderate (n = 220) 79 (80.6) 75 (84.4) 66 (84.6)
Poor (n = 13) 2 (2.0) 7 (7.8) 4 (5.1) 0.129
Lymphatic invasion
Absent (n = 188) 70 (71.4) 67 (75.3) 51 (65.4)
Present (n = 77) 28 (28.6) 22 (24.7) 27 (34.6) 0.369 Venous invasion
Absent (n = 245) 91 (92.9) 85 (95.5) 69 (88.5)
Present (n = 20) 7 (7.1) 4 (4.5) 9 (11.5) 0.224 Data given in parenthesis is percentage in each group. PIS, prognostic inflammation score; PIS 0, C-reactive protein ≤ 0.4 mg/dL and neutrophil/lymphocyte ratio ≤ 2.4;
PIS 1, C-reactive protein > 0.4 mg/dL or neutrophil/lymphocyte ratio > 2.4; PIS 2, C-reactive protein > 0.4 mg/dL and neutrophil/lymphocyte ratio > 2.4.
Table 6. Disease progression of patients according to PIS Disease progression PIS 0
(n = 98)
PIS 1 (n = 89)
IPS 2
(n = 78) P value
Recurrence (n = 34) 4 10 20 < 0.001
Death
Cancer-specific (n = 22) 1 5 16 < 0.001
Other diseases (n = 11) 2 3 6 < 0.001
PIS, Prognostic inflammation score; PIS 0, C-reactive protein ≤ 0.4 mg/dL and neu- trophil/lymphocyte ratio ≤ 2.4; PIS 1, C-reactive protein > 0.4 mg/dL or neutrophil/
lymphocyte ratio > 2.4; PIS 2, C-reactive protein > 0.4 mg/dl and neutrophil/lym- phocyte ratio > 2.4.
tivation of a cascade of cellular action, which can potentiate tu- mor cell growth. Besides, tumor growth itself can evoke more than normal host immune response and inflammation (7). With these backgrounds, the clinical use of readily available serum markers of systemic inflammation has been attempted to make an improvement in predicting cancer prognosis. Over the recent 10 yr, several inflammatory markers have been investigated whether they can be used for a prognostic parameter indepen- dent of TNM stage in a variety of cancer population including CRC with mostly favorable results (8-14).
Recent studies indicated subclinical or even undetectable in- flammation may also be as important as chronic inflammation in increasing cancer risk (15). Then the combination of multiple markers which can reflect various aspects of systemic inflam- mation is warranted for defining more meaningful prognostic parameters in patients with cancer. Actually the measurement of systemic inflammation has been subsequently refined with a selective combination of each marker. Glasgow prognostic score (5) with combination of CRP and albumin, Prognostic index (6) with CRP and WBC, and even Prognostic nutritional index (16)
with albumin and lymphocyte have been reported to have ad- ditional prognostic values in various cancer populations. How- ever, circulating albumin concentration is an indirect parameter of systemic inflammation. It reflects more of the nutritional sta- tus, rather than the severity of systemic inflammation, although it may be helpful for predicting survival of patients.
As laboratory markers reflecting systemic inflammation, CRP, ESR, WBC, and NLR have been widely used. However, it has been frequently noted that concomitant measurement of these markers gives discrepant results, which means that there would be differences among them theoretically or technically in measuring systemic inflammation (17,18). CRP yields quick and sharp variations related to the extent and severity of the in- flammation. False-negative or positive results are rare except in case of liver failure (19). CRP was confirmed again in this study to be independently significant prognostic variable in surgical patients with CRC. On the other hand, ESR is so slow in varia- tion that it is subject to misinterpretation. Moreover, common associated conditions influencing its measurement may make it spurious (20,21). These may be underlying causes of relatively Fig. 1. Disease-free survival curves (Kaplan-Meier method with log-rank test). Vertical axis is survival rate (%), horizontal axis is follow-up time (months). (A) Groups categorized by C-reactive protein; (B) by erythrocyte sedimentation rate; (C) by neutrophil/lymphocyte ratio; (D) by Prognostic inflammation score.
Survival rate (%)
0 50 100 100
80 60 40 20 0
P < 0.001
CRP > 0.4 CRP ≤ 0.4
Survival rate (%)
0 50 100 100
80 60 40 20 0
P = 0.019
ESR > 15 ESR ≤ 15
A B
Survival rate (%)
0 50 100 100
80 60 40 20 0
P < 0.001
NLR > 2.4 NLR ≤ 2.4
Survival rate (%)
0 50 100 100
80 60 40 20 0
P < 0.001
PIS 0 PIS 1
PIS 2
C D
Follow-up time (month)
Follow-up time (month)
Follow-up time (month)
Follow-up time (month)
poor significance of ESR as a prognostic variable in this study.
WBC is a simple and robust laboratory variable easily obtain- able from routine blood test, and yet it is considered as a dy- namic parameter which shows as sharp variation along with infection and inflammation. But its accuracy is more effective in acute, rather than chronic condition (3). Unlike in previous study which was done on patients with lung cancer (6), WBC did not show any significance by itself as a prognostic variable in this study. NLR is a parameter based on differential count of WBC. It reflects not only neutrophilia, but also lymphocytope- nia. In response to systemic inflammation, WBC populations usually change with rapid kinetics, reflecting the role of neutro- phils in the early stage of the inflammation. Neutrophilia is of- ten accompanied by lymphocytopenia, which develops proba- bly to suppress the adaptive immune response in favor of in- nate immunity (3,22). Oncologically neutrophilia may aid in the development and progression of cancer by providing an adequate environment for it to grow, and lymphocytopenia may also worsen the prognosis of cancer through the linkage to inadequate lymphocyte-mediated immune response to cancer
(23). NLR was also confirmed in this study as an independently significant prognostic variable in surgical patients with CRC.
In this study, when PIS was constructed with combination of CRP and NLR, it was more potentially significant prognostic variable in surgical patients with CRC. CRP and NLR were cho- sen for combination because they were confirmed to be inde- pendently significant prognostic variables for DSS and DFS re- spectively. Although current cornerstone in predicting cancer prognosis is TNM staging, it is not amenable to assessment pre- operatively. Because PIS can be assessed preoperatively, it would be used as a guide for deciding whether to perform palli- ative surgery or preoperative neoadjuvant therapy in patients with stage IV CRC. It could also be a supplemental guide for postoperative adjuvant therapy in patients with stage II CRC.
As a limitation of this study, number of patients included was relatively small and deceased patients were also proportionally small. It might reduce the statistical power. Sample size was re- duced because a number of patients were excluded due to in- complete laboratory data. It might be inevitable considering the retrospective nature of this study. Further prospective study with Fig. 2. Disease-specific survival curves (Kaplan-Meier method with log-rank test). Vertical axis is survival rate (%), horizontal axis is follow-up time (months). (A) Groups catego- rized by C-reactive protein; (B) by erythrocyte sedimentation rate; (C) by neutrophil/lymphocyte ratio; (D) by Prognostic inflammation score.
Survival rate (%)
0 50 100 100
80 60 40 20 0
P < 0.001
CRP > 0.4 CRP ≤ 0.4
Survival rate (%)
0 50 100 100
80 60 40 20 0
P = 0.032
ESR > 15 ESR ≤ 15
A B
Survival rate (%)
0 50 100 100
80 60 40 20 0
P < 0.001
NLR > 2.4 NLR ≤ 2.4
Survival rate (%)
0 50 100 100
80 60 40 20 0
P < 0.001
PIS 1
PIS 2 PIS 0
C D
Follow-up time (month)
Follow-up time (month)
Follow-up time (month)
Follow-up time (month)
a larger cohort of patients would be necessary to confirm the re- sults of this study. As another limitation, cut-off values to catego- rize each group of inflammatory markers were defined by ROC curve analysis. They could be different from well-known normal range values, which the previous studies used frequently as their discriminating values. But I believe ROC curve analysis with dis- ease-specific death as an end point is better in defining discrim- inating values for prognostic variable.
In conclusion, CRP and NLR among serum inflammatory markers were found to be independently significant prognostic variables for DSS and DFS, respectively. When PIS was con- structed with combination of CRP and NLR, it was more poten- tially significant prognostic variable regardless of pathologic variables in surgical patients with CRC.
DISCLOSURE
There is no potential conflicts of interest in this article.
AUTHOR CONTRIBUTION
All the process of research conception, enrollment of subjects, statistical analysis and writing paper was done by Seong MK.
ORCID
Moo-Kyung Seong http://orcid.org/0000-0002-2284-9449 REFERENCES
1. Mazhar D, Ngan S. C-reactive protein and colorectal cancer. QJM 2006;
99: 555-9.
2. Sox HC Jr, Liang MH. The erythrocyte sedimentation rate. Guidelines for rational use. Ann Intern Med 1986; 104: 515-23.
3. Wyllie DH, Bowler IC, Peto TE. Relation between lymphopenia and bacteraemia in UK adults with medical emergencies. J Clin Pathol 2004;
57: 950-5.
4. Zahorec R. Ratio of neutrophil to lymphocyte counts: rapid and simple parameter of systemic inflammation and stress in critically ill. Bratisl Lek Listy 2001; 102: 5-14.
5. Forrest LM, McMillan DC, McArdle CS, Angerson WJ, Dunlop DJ. Com- parison of an inflammation-based prognostic score (GPS) with perfor- mance status (ECOG) in patients receiving platinum-based chemother- apy for inoperable non-small-cell lung cancer. Br J Cancer 2004; 90:
1704-6.
6. Kasymjanova G, MacDonald N, Agulnik JS, Cohen V, Pepe C, Kreisman H, Sharma R, Small D. The predictive value of pre-treatment inflamma- tory markers in advanced non-small-cell lung cancer. Curr Oncol 2010;
17: 52-8.
7. Siemes C, Visser LE, Coebergh JW, Splinter TA, Witteman JC, Uitterlin- den AG, Hofman A, Pols HA, Stricker BH. C-reactive protein levels, vari-
ation in the C-reactive protein gene, and cancer risk: the Rotterdam Study. J Clin Oncol 2006; 24: 5216-22.
8. McMillan DC, Canna K, McArdle CS. Systemic inflammatory response predicts survival following curative resection of colorectal cancer. Br J Surg 2003; 90: 215-9.
9. Nozoe T, Mori E, Takahashi I, Ezaki T. Preoperative elevation of serum C-reactive protein as an independent prognostic indicator of colorectal carcinoma. Surg Today 2008; 38: 597-602.
10. Sengupta S, Lohse CM, Cheville JC, Leibovich BC, Thompson RH, Webster WS, Frank I, Zincke H, Blute ML, Kwon ED. The preoperative erythrocyte sedimentation rate is an independent prognostic factor in re- nal cell carcinoma. Cancer 2006; 106: 304-12.
11. Choi ES, Kim HS, Han I. Elevated preoperative systemic inflammatory markers predict poor outcome in localized soft tissue sarcoma. Ann Surg Oncol 2014; 21: 778-85.
12. Teramukai S, Kitano T, Kishida Y, Kawahara M, Kubota K, Komuta K, Minato K, Mio T, Fujita Y, Yonei T, et al. Pretreatment neutrophil count as an independent prognostic factor in advanced non-small-cell lung cancer: an analysis of Japan Multinational Trial Organisation LC00-03.
Eur J Cancer 2009; 45: 1950-8.
13. Chua W, Charles KA, Baracos VE, Clarke SJ. Neutrophil/lymphocyte ra- tio predicts chemotherapy outcomes in patients with advanced colorec- tal cancer. Br J Cancer 2011; 104: 1288-95.
14. Smith RA, Bosonnet L, Raraty M, Sutton R, Neoptolemos JP, Campbell F, Ghaneh P. Preoperative platelet-lymphocyte ratio is an independent sig- nificant prognostic marker in resected pancreatic ductal adenocarcino- ma. Am J Surg 2009; 197: 466-72.
15. Grivennikov SI, Greten FR, Karin M. Immunity, inflammation, and cancer. Cell 2010; 140: 883-99.
16. Nozoe T, Kimura Y, Ishida M, Saeki H, Korenaga D, Sugimachi K. Cor- relation of pre-operative nutritional condition with post-operative com- plications in surgical treatment for oesophageal carcinoma. Eur J Surg Oncol 2002; 28: 396-400.
17. Costenbader KH, Chibnik LB, Schur PH. Discordance between erythro- cyte sedimentation rate and C-reactive protein measurements: clinical significance. Clin Exp Rheumatol 2007; 25: 746-9.
18. Colombet I, Pouchot J, Kronz V, Hanras X, Capron L, Durieux P, Wyplo- sz B. Agreement between erythrocyte sedimentation rate and C-reactive protein in hospital practice. Am J Med 2010; 123: 863.e7-13.
19. Pepys MB, Hirschfield GM. C-reactive protein: a critical update. J Clin Invest 2003; 111: 1805-12.
20. Jurado RL. Why shouldn’t we determine the erythrocyte sedimentation rate? Clin Infect Dis 2001; 33: 548-9.
21. Hansson LO, Carlsson I, Hansson E, Hovelius B, Svensson P, Tryding N.
Measurement of C-reactive protein and the erythrocyte sedimentation rate in general practice. Scand J Prim Health Care 1995; 13: 39-45.
22. Holub M, Beran O, Kaspříková N, Chalupa P. Neutrophil to lymphocyte count ratio as a biomarker of bacterial infections. Cent Eur J Med 2012;
7: 258-61.
23. Okano K, Maeba T, Moroguchi A, Ishimura K, Karasawa Y, Izuishi K, Goda F, Usuki H, Wakabayashi H, Maeta H. Lymphocytic infiltration surrounding liver metastases from colorectal cancer. J Surg Oncol 2003;
82: 28-33.