한수지 52(2), 141-148, 2019
141
Copyright © 2019 The Korean Society of Fisheries and Aquatic Science pISSN:0374-8111, eISSN:2287-8815 Korean J Fish Aquat Sci 52(2),141-148,2019
Original Article
서 론
어류는단백질요구량이높아사료원가중단백질원이차지 하는비중이높다(Wilson and Halver, 1986; Hardy, 2010). 또 한육식성어류는잡식성이나초식성어류처럼식물성단백질 의이용성이높지않기때문에배합사료에어분이주단백질원
으로사용되고있다(Wilson and Halver, 1986; Hevroy et al.,
2005). 사료내어분의첨가비율은사료가격을결정하는데매
우중요한요인으로작용한다(Sissener et al., 2013; Hatlen et al., 2015). 어분은여러가지영양소균형이잘갖춰진양질의 사료 단백질원으로보고되고 있으나(Dabrowski and Kozak, 1979), 지난 30년간가격이계속적으로증가하고있고, 어획량
사료의 어분함량대체가 넙치(Paralichthys olivaceus)의 간과 근육 내 인 슐린유사성장인자의 발현과 체성장에 미치는 영향
박수진·문지성·서진송·남택정1·이경준2·임상구3·김강웅4·이봉주3·허상우3·최윤희*
부경대학교 수산생물학과, 1부경대학교 식품영양학과, 2제주대학교 해양생명과학과, 3국립수산과학원 사료연구센터,4국립수산과학원 양식관리과
Effect of Fish Meal Replacement on Insulin-like Growth Factor-I Ex- pression in the Liver and Muscle and Implications for the Growth of Olive Flounder Paralichthys olivaceus
Su-Jin Park, Ji-Sung Moon, Jin-Song Seo, Taek-Jeong Nam1, Kyeong-Jun Lee2, Sang-Gu Lim3, Kang-Woong Kim4, Bong-Joo Lee3, Sang-Woo Hur3 and Youn Hee Choi*
Department of Fisheries Biology, Pukyong National University, Busan 48513, Korea
1Department of Food Science & Nutrition, Pukyong National University, Busan 48513, Korea
2Department of Marine Life Science, Jeju National University, Jeju 63243, Korea
3Aquafeed Research Center, National Institute of Fisheries Science, Pohang 37517, Korea
4Aquaculture Management Division, National Institute of Fisheries Science, Busan 46083, Korea
This study examined the effect of insulin-like growth factor (IGF)-I expression in the liver and muscle on the growth of Paralichthys olivaceus fed diets low in fish meal. A feeding experiment was conducted at Jeju National Univer- sity, Jeju Island, Korea. Groups of P. olivaceus (total initial weight: 200 g) were maintained for 20 weeks on one of five experimental diets containing different proportions of fish meal. Diets containing 0%, 20%, 30%, 40%, and 50% fish meal were labeled FM0, FM20, FM30, FM40, and FM50, respectively. Fish growth was observed every 4 weeks during the feeding experiment, and plasma and liver and muscle tissues were sampled. Plasma IGF-I levels were analyzed using an ELISA kit. The mechanism of IGF-I receptor signaling was examined using immunoblotting and reverse transcription-polymerase chain reaction. The greatest total weight increase was observed in the FM30 group. In parallel, plasma levels of IGF-I and IGF-binding protein were highest in the FM30 group, and mRNA and protein expression were also significantly higher in this group. The first step in the IGF-I signaling pathway, tyrosine- phosphorylation checking, occurred smoothly until 20 weeks. These results suggest that a dietary ratio of 30% fish meal best promotes growth in this species. The IGF-I signaling pathway in the liver and muscle is associated with growth in P. olivaceus.
Key words: Olive flounder, Insulin-like growth factor I, Growth, Low-fish meal diet
*Corresponding author: Tel: +82. 51. 629. 5915 Fax: +82. 51. 629. 590 E-mail address: [email protected]
This is an Open Access article distributed under the terms of the Creative Commons Attribution Non-Commercial Licens (http://creativecommons.org/licenses/by-nc/3.0/) which permits unrestricted non-commercial use, distribution, and reproduction in any medium, provided the original work is properly cited.
Received 19 February 2019; Revised 7 March 2019; Accepted 19 March 2019 저자 직위: 박수진(대학원생), 문지성(대학원생), 서진송(대학원생), 남택정(
교수), 이경준(교수), 임상구(센터장), 김강웅(해양수산연구관), 이봉주(해양 수산연구사), 허상우(해양수산연구사), 최윤희(교수)
https://doi.org/10.5657/KFAS.2019.0141
Korean J Fish Aquat Sci 52(2), 141-148, April 2019
1984; Wilson and Halver, 1986; Nam et al., 2001).
성장인자는세포내성장, 분열, 분화및치료를자극할수있 는물질로서일반적으로세포사이에서신호전달분자로작용한 다(Duan, 1997). 특히인슐린유사성장인자(insulin-like growth factor, IGF)는발생과영양대사를조절하는 주된인자로알 려져있으며, 특히경골어류에서성장호르몬-IGF 축이체성장 과영양대사조절에관여하고있다(Fuentes et al., 2011; Siss- ener et al., 2013; Coned-Sieira and Soengas, 2017; Velez et al., 2017). 또한 IGF-I은어류성장을조절하는중요한지표로서연 어및무지개송어등의근육성장및사료효율성을확인하기 위해활용되고있다(Castillo J et al., 2004; Bower et al., 2008;
Sissener et al., 2013; Zheng et al., 2012a; 2013b).
IGF는단백질의양과질에의해영향을받기때문에(Gill et al., 2006; Fuentes et al., 2011), 사료내단백질의종류와양 을변화시킨저어분사료에의해발현량이달라질것으로예 상된다.
따라서, 본연구에서는저어분사료를급이한넙치의간과근
육에서 IGF-I의발현을통해저어분사료가넙치의성장에미치
는영향을 RT-PCR과 western-blot 분석으로연구하였다.
재료 및 방법
실험사료 및 실험어
실험에사용된사료는어분을기초로하여대조사료(FM0),
어분을 20, 30, 40, 50%를 대체한 4개의 실험사료(FM20, FM30, FM40, FM50)였으며조성은 Table 1에 나타내었다. 실험에사용된넙치는제주대학교해양과학연구소에서 2000 L 사육수조에각실험구당 65마리씩수용하여사료를 1일 2회 (08:30, 17:30) 만복공급하여 20주간사육하였고, 모든실험 은 3반복진행하였다. 사육수온은자연수온(19.7±4.5℃)에의 존하였다. 4주간격으로각실험구수조당 10마리씩무작위로 채취하여샘플링을실시하였다. 모든분석에사용된실험어는 2-phenoxyethanol 100 ppm에서마취시켜전장, 체고, 전중량 을측정하여성장률을조사하였다. 또한마취가된어류에서간 을적출한후액체질소에고정한다음분석전까지 -80℃에서
Reverse transcription polymerase chain reaction (RT-PCR) 분석
근육과간조직의 total RNA는 Trans Zol-up (TransGen Bio- tech, Beijing, China)을이용하여추출하였으며, 추출된 total RNA는 NanoDrop 2000 spectrophotometer (Thermo Fisher
Table 1. Ingredients and nutrition composition of the experimental diets
Ingredients (%) FM0 FM20 FM30 FM40 FM50 Sardine FM 32.50 26.00 22.75 19.50 16.25 Anchovy FM 32.50 26.00 22.75 19.50 16.25 Soybean meal 12.00 12.00 12.00 12.00 12.00 Wheat flour 14.85 12.85 12.95 12.55 12.55
Wheat gluten 1.00 3.50 4.50 5.50 6.50
SPC 0.00 3.50 5.25 7.00 8.75
Tankage meal 0.00 3.50 6.25 9.00 11.75 Poultry by-product meal 0.00 3.50 4.00 4.50 5.00
Fish oil 3.40 4.00 4.30 5.10 5.50
Lecithin 0.50 0.50 0.50 0.50 0.50
Betain 0.00 1.00 1.00 1.00 1.00
Taurine 0.00 0.40 0.50 0.60 0.70
MCP 0.50 0.50 0.50 0.50 0.50
Mineral Mix 1.00 1.00 1.00 1.00 1.00
Vitamin Mix 0.80 0.80 0.80 0.80 0.80
Vitamin C 0.30 0.30 0.30 0.30 0.30
Vitamin E 0.30 0.30 0.30 0.30 0.30
Choline 0.30 0.30 0.30 0.30 0.30
anti-fungal agent 0.05 0.05 0.05 0.05 0.05 Total 100.00 100.00 100.00 100.00 100.00 FM0, replacement ratio 0% of fish meal diet; FM 20, replacement ratio 20% of fish meal diet; FM 30, replacement ratio 30% of fish meal diet; FM 40, replacement ratio 40% of fish meal diet; FM 50, replacement ratio 50% of fish meal diet; SPC, soy protein concen- trate; MCP, mono calcium phosphate.
넙치 사료의 어분함량대체가 체성장에 미치는 영향 143
Fig. 1. The change of total weight, total length and body depth of olive flounder Paralichthys olivaceus fed experiment diets for 20 weeks.
Data are presented as mean±SD. #P<0.001 compared with 0 week groups (n=10). FM0, replacement ratio 0% of fish meal diet; FM20, replacement ratio 20% of fish meal diet; FM30, replacement ratio 30% of fish meal diet; FM40, replacement ratio 40% of fish meal diet;
FM50, replacement ratio 50% of fish meal diet.
0 100 200 300 400 500 600 700 800
0 4 8 12 16 20
FM 0 FM 20 FM 30 FM 40 FM 50
0 10 20 30 40 50
0 4 8 12 16 20
FM 0 FM 20 FM 30 FM 40 FM 50
0 5 10 15 20 25 30
0 4 8 12 16 20
FM 0 FM 20 FM 30 FM 40 FM 50
Total weight (g) Total length (cm) Body depth (cm)
Weeks Weeks Weeks
#
0 10 20 30 40 50
0 4 8 12 16 20
FM 0 FM 20 FM 30 FM 40 FM 50
0 0.2 0.4 0.6 0.8 1 1.2
4 8 12 16 20
FM0 FM20 FM30 FM40 FM50
IGF-I mRNA expression/GAPDH
Weeks
0 0.2 0.4 0.6 0.8 1 1.2
4 8 12 16 20
FM0 FM20 FM30 FM40 FM50
Weeks
IGF-I mRNA expression/GAPDH
*
*
*
*
*
*
*
*
* *
(A) Liver (B) Muscle
0 50 100 150
200 IGF-I
IGF-IR PY99
0 50 100 150
200 IGF-I
IGF-IR PY99
0 50 100 150
200 IGF-I
IGF-IR PY99
0 50 100 150
200 IGF-I
IGF-IR PY99
0 50 100 150
200 IGF-I
IGF-IR PY99
IGF-I, IGF-IR, PY99/α-tubulin ration (relative control)
4 weeks FM 0 FM 20 FM 30 FM 40 FM 50
8 weeks
FM 0 FM 20 FM 30 FM 40 FM 50 12 weeks FM 0 FM 20 FM 30 FM 40 FM 50
16 weeks
FM 0 FM 20 FM 30 FM 40 FM 50 20 weeks FM 0 FM 20 FM 30 FM 40 FM 50 IGF -I
IGF -IR PY99 α-tubulin
(A)
(B)
*
*
* *
* *
0 100 200 300 IGF-I
IGF-IR PY99
0 100 200 300 IGF-I
IGF-IR PY99
0 100 200 300 IGF-I
IGF-IR PY99
0 100 200 300 IGF-I
IGF-IR PY99
0 100 200 300 IGF-I
IGF-IR PY99
IGF-I, IGF-IR, PY99/α-tubulin ration (relative control)
(B)
FM0 FM 20 FM 30 FM 40 FM 50 4 weeks
FM0 FM 20 FM 30 FM 40 FM 50 8 weeks
FM0 FM 20 FM 30 FM 40 FM 50 12 weeks
FM0 FM 20 FM 30 FM 40 FM 50 16 weeks
FM0 FM 20 FM 30 FM 40 FM 50 20 weeks FM0 FM 20 FM 30 FM 40 FM 50
4 weeks
FM0 FM 20 FM 30 FM 40 FM 50 8 weeks
FM0 FM 20 FM 30 FM 40 FM 50 12 weeks
FM0 FM 20 FM 30 FM 40 FM 50 16 weeks
FM0 FM 20 FM 30 FM 40 FM 50 20 weeks
4 weeks FM 0 FM 20 FM 30 FM 40 FM 50
8 weeks FM 0 FM 20 FM 30 FM 40 FM 50
12 weeks FM 0 FM 20 FM 30 FM 40 FM 50
16 weeks FM 0 FM 20 FM 30 FM 40 FM 50
20 weeks FM 0 FM 20 FM 30 FM 40 FM 50 IGF -I
IGF -IR PY99 α-tubulin
(A)
*
*
* 0
70 60 80 90 100 110 120 130
4 8 12 16 20
FM 0 FM 20 FM 30 FM 40 FM 50 IGFBP-3 level (%) (relative to FM0 group)
Weeks 0
70 60 80 90 100 110 120 130
4 8 12 16 20
FM 0 FM 20 FM 30 FM 40 FM 50 IGF-I level (%) (relative to FM0 group)
Weeks
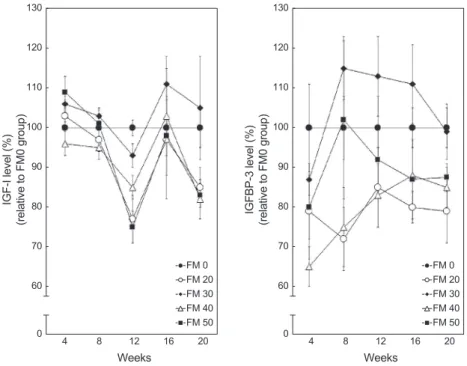
Fig. 2. A correlation of IGF-I level and IGFBP-3 level of olive flounder Paralichthys olivaceus fed experimental diets for 20 weeks (n=3).
#P<0.001, *P<0.01 compared with 0 week group. FM0, replacement ratio 0% of fish meal diet; FM20, replacement ratio 20% of fish meal diet; FM30, replacement ratio 30% of fish meal diet; FM40, replacement ratio 40% of fish meal diet; FM50, replacement ratio 50% of fish meal diet.
0 100 200 300 400 500 600 700 800
0 4 8 12 16 20
FM 0 FM 20 FM 30 FM 40 FM 50
0 10 20 30 40 50
0 4 8 12 16 20
FM 0 FM 20 FM 30 FM 40 FM 50
0 5 10 15 20 25 30
0 4 8 12 16 20
FM 0 FM 20 FM 30 FM 40 FM 50
Total weight (g) Total length (cm) Body depth (cm)
Weeks Weeks Weeks
#
0 10 20 30 40 50
0 4 8 12 16 20
FM 0 FM 20 FM 30 FM 40 FM 50
0 0.2 0.4 0.6 0.8 1 1.2
4 8 12 16 20
FM0 FM20 FM30 FM40 FM50
IGF-I mRNA expression/GAPDH
Weeks
0 0.2 0.4 0.6 0.8 1 1.2
4 8 12 16 20
FM0 FM20 FM30 FM40 FM50
Weeks
IGF-I mRNA expression/GAPDH
*
*
*
*
*
*
*
*
* *
(A) Liver (B) Muscle
0 50 100 150
200 IGF-I
IGF-IR PY99
0 50 100 150
200 IGF-I
IGF-IR PY99
0 50 100 150
200 IGF-I
IGF-IR PY99
0 50 100 150
200 IGF-I
IGF-IR PY99
0 50 100 150
200 IGF-I
IGF-IR PY99
IGF-I, IGF-IR, PY99/α-tubulin ration (relative control)
4 weeks FM 0 FM 20 FM 30 FM 40 FM 50
8 weeks
FM 0 FM 20 FM 30 FM 40 FM 50 12 weeks FM 0 FM 20 FM 30 FM 40 FM 50
16 weeks
FM 0 FM 20 FM 30 FM 40 FM 50 20 weeks FM 0 FM 20 FM 30 FM 40 FM 50 IGF -I
IGF -IR PY99 α-tubulin
(A)
(B)
*
*
* *
* *
0 100 200 300 IGF-I
IGF-IR PY99
0 100 200 300 IGF-I
IGF-IR PY99
0 100 200 300 IGF-I
IGF-IR PY99
0 100 200 300 IGF-I
IGF-IR PY99
0 100 200 300 IGF-I
IGF-IR PY99
IGF-I, IGF-IR, PY99/α-tubulin ration (relative control)
(B)
FM0 FM 20 FM 30 FM 40 FM 50 4 weeks
FM0 FM 20 FM 30 FM 40 FM 50 8 weeks
FM0 FM 20 FM 30 FM 40 FM 50 12 weeks
FM0 FM 20 FM 30 FM 40 FM 50 16 weeks
FM0 FM 20 FM 30 FM 40 FM 50 20 weeks FM0 FM 20 FM 30 FM 40 FM 50
4 weeks
FM0 FM 20 FM 30 FM 40 FM 50 8 weeks
FM0 FM 20 FM 30 FM 40 FM 50 12 weeks
FM0 FM 20 FM 30 FM 40 FM 50 16 weeks
FM0 FM 20 FM 30 FM 40 FM 50 20 weeks
4 weeks
FM 0 FM 20 FM 30 FM 40 FM 50 8 weeks
FM 0 FM 20 FM 30 FM 40 FM 50 12 weeks
FM 0 FM 20 FM 30 FM 40 FM 50 16 weeks
FM 0 FM 20 FM 30 FM 40 FM 50 20 weeks FM 0 FM 20 FM 30 FM 40 FM 50 IGF -I
IGF -IR PY99 α-tubulin
(A)
* *
* 0
70 60 80 90 100 110 120 130
4 8 12 16 20
FM 0 FM 20 FM 30 FM 40 FM 50 IGFBP-3 level (%) (relative to FM0 group)
Weeks 0
70 60 80 90 100 110 120 130
4 8 12 16 20
FM 0 FM 20 FM 30 FM 40 FM 50 IGF-I level (%) (relative to FM0 group)
Weeks
박수진ㆍ문지성ㆍ서진송ㆍ남택정ㆍ이경준ㆍ임상구ㆍ김강웅ㆍ이봉주ㆍ허상우ㆍ최윤희 144
Scientific, Waltham, MA, USA)를이용하여정량·정성분석하 였다. cDNA 합성은 primescript first strand cDNA synthesis kit (TaKaRa Bio, Shiga, Japan)를이용해합성하였다. IGF-I 유전자는 PCR thermal cycler dice gradient를이용하여증폭 하였으며, emeraldamp GT PCR master mix (TaKaRa Bio, Shiga, Japan)와제작된프라이머를사용하였다(Table 2). PCR 조건은 initial denaturation, 95℃ 5분수행한후, denaturation 95℃, 30초; annealing 55℃, 30초; extension 72℃, 30초로총 30회반복하여각유전자를증폭하였다. 증폭된산물은 1.5%
agarose gel을사용하여전기영동으로확인하였다. Western blot 분석
근육과간조직내 IGF-I의발현을확인하기위해 immunob-
lot 분석을실행하였다. 각각의조직(n=10)을 RIPA buffer 1 mL에넣고균질화한다음, 12,000 rpm에서 15분간원심분리 한 후상층액을분리하였다. 단백질농도는 BCA protein as- say kit (#23225, Thermo)를사용하여 microplate reader (EZ Read 400, Biochrom)에서 562 nm로측정하였다. 단백질(50 µg)을 10-15% sodium dodecyl sulfate-polyacrylamide gel electrophoresis (SDS-PAGE)로 분리하고, polyvinylidene fluoride (PVDF) membrane으로 옮겼다. PVDF membrane 은 tris buffered saline with Tween-20 (TBST)에용해된 10%
bovine serum albumin (BSA)에서 1시간동안실온에서반응시 켰다. 1차항체로는 IGF-I, IGF-I receptor (IGF-IR), tyrosine- phosphorylation (PY99), α-tubulin을 사용하였으며, 실험에 사용한항체는 Santa Cruz Biotechnology 제품이며, IGF-I 항 Fig. 3. RT-PCR results revealed an IGF-I mRNA expression in liver of olive flounder Paralichthys olivaceus fed the experimental diets for 20 weeks. IGF-I mRNA expression for each diet group expressed as a ratio to GAPDH (n=3). Expression of the housekeeping gene GAPDH served as control. (A) Liver. (B) Muscle. GAPDH, glyceraldehyde-3-phosphate dehydrogenase. *P<0.01 compared with 0 week group.
FM0, replacement ratio 0% of fish meal diet; FM20, replacement ratio 20% of fish meal diet; FM30, replacement ratio 30% of fish meal diet; FM40, replacement ratio 40% of fish meal diet; FM50, replacement ratio 50% of fish meal diet.
0 100
0 4 8 12 16 20
FM 20 FM 30 FM 40 FM 50
0 0 4 8 12 16 20
FM 20 FM 30 FM 40 FM 50
0 5
0 4 8 12 16 20
FM 20 FM 30 FM 40 FM 50
Weeks Weeks Weeks
0 0 4 8 12 16 20
FM 20 FM 30 FM 40 FM 50
0 0.2 0.4 0.6 0.8 1 1.2
4 8 12 16 20
FM0 FM20 FM30 FM40 FM50
IGF-I mRNA expression/GAPDH
Weeks
0 0.2 0.4 0.6 0.8 1 1.2
4 8 12 16 20
FM0 FM20 FM30 FM40 FM50
Weeks
IGF-I mRNA expression/GAPDH
*
*
*
*
*
*
*
*
* *
(A) Liver (B) Muscle
0 50 100 150
200 IGF-I
IGF-IR PY99
0 50 100 150
200 IGF-I
IGF-IR PY99
0 50 100 150
200 IGF-I
IGF-IR PY99
0 50 100 150
200 IGF-I
IGF-IR PY99
0 50 100 150
200 IGF-I
IGF-IR PY99
IGF-I, IGF-IR, PY99/α-tubulin ration (relative control)
4 weeks FM 0 FM 20 FM 30 FM 40 FM 50
8 weeks
FM 0 FM 20 FM 30 FM 40 FM 50 12 weeks FM 0 FM 20 FM 30 FM 40 FM 50
16 weeks
FM 0 FM 20 FM 30 FM 40 FM 50 20 weeks FM 0 FM 20 FM 30 FM 40 FM 50 IGF -I
IGF -IR PY99 α-tubulin
(A)
(B)
*
*
* *
* *
0 100 200 300 IGF-I
IGF-IR PY99
0 100 200 300 IGF-I
IGF-IR PY99
0 100 200 300 IGF-I
IGF-IR PY99
0 100 200 300 IGF-I
IGF-IR PY99
0 100 200 300 IGF-I
IGF-IR PY99
IGF-I, IGF-IR, PY99/α-tubulin ration (relative control)
(B)
FM0 FM 20 FM 30 FM 40 FM 50 4 weeks
FM0 FM 20 FM 30 FM 40 FM 50 8 weeks
FM0 FM 20 FM 30 FM 40 FM 50 12 weeks
FM0 FM 20 FM 30 FM 40 FM 50 16 weeks
FM0 FM 20 FM 30 FM 40 FM 50 20 weeks FM0 FM 20 FM 30 FM 40 FM 50
4 weeks
FM0 FM 20 FM 30 FM 40 FM 50 8 weeks
FM0 FM 20 FM 30 FM 40 FM 50 12 weeks
FM0 FM 20 FM 30 FM 40 FM 50 16 weeks
FM0 FM 20 FM 30 FM 40 FM 50 20 weeks
4 weeks
FM 0 FM 20 FM 30 FM 40 FM 50 8 weeks
FM 0 FM 20 FM 30 FM 40 FM 50 12 weeks
FM 0 FM 20 FM 30 FM 40 FM 50 16 weeks
FM 0 FM 20 FM 30 FM 40 FM 50 20 weeks FM 0 FM 20 FM 30 FM 40 FM 50 IGF -I
IGF -IR PY99 α-tubulin
(A)
*
*
* 0
70 60 80 90 100 110 120 130
4 8 12 16 20
FM 0 FM 20 FM 30 FM 40 FM 50 IGFBP-3 level (%) (relative to FM0 group)
Weeks 0
70 60 80 90 100 110 120 130
4 8 12 16 20
FM 0 FM 20 FM 30 FM 40 FM 50 IGF-I level (%) (relative to FM0 group)
Weeks
Table. 2 Oligonucleotide sequences of primers for the real-time qPCR assay
Identification Primer name Sequence (5´-3´) Amplicon size (bp) GenBank#
Glyceraldehyde-3-phosphate
dehydrogenase GAPDH_F AAACCTGCCAGCTACGAAAA
166 AB029337.1
GAPDH_R GGTCATTAAGAGCGATGCCA
Insulin-like
growth factor-I IGF-I_F CGGCGCCTGGAGATGTACTG
144 AF016922.2
IGF-I_R TGTCCTACGCTCTGTGCCCT
PCR, polymerase chain reaction; F, forward; R, reverse.
넙치 사료의 어분함량대체가 체성장에 미치는 영향 145
체는실험실에서직접제작하여분석하였다. Densitometry는 Gene Tools version 4.03 (SYNGENE, Cambridge, UK)을이 용하여확인하였다.
통계처리
실험의 분석결과는 SPSS 프로그램(Statistical Package for Social Science, SPSS Inc, Chicago, IL, USA)을이용하여처리 하였고, one-way ANOVA test를실시하여 Duncan’s multiple range test (Duncan, 1955)로유의성을검증하였다.
결과 및 고찰
성장
20주간사육실험결과(Fig. 1), 넙치육성어의체중은 12주까 지급속하게증가하였으며, 이후 16주와 20주에서는모든실험 구에서유의하게높은값을나타내었으나(P<0.001), 이두기간 사이에서의유의성은나타나지않았다( P>0.001). 한편, 실험구 별성장을 4주간격으로조사하여비교해보면, 실험종료일까 지 FM30 실험구(어분대체비율 30% 실험구)에서체중이증가 할수록성장도유의하게증가하는것으로나타났다(P<0.001).
이결과는실험사료에서어분의함량을낮추고식물성단백질 인밀글루텐과농축콩단백을중심으로대체한결과로보인다. 현재까지어분은배합사료에사용되는값비싼원료중의하나 로서공급의불안정으로인해가격이계속해서증가하고있기 때문에어분을대체하려는연구가활발히진행되고있다(Ki- kuchi, 1999; Chou et al., 2004; Gomez-Requeni et al., 2004;
Tacchi et al., 2012; Apper-Bossard et al., 2013; Khosravi et al., 2015; Bu et al., 2018). 그중에서도경제적인식물성단백질원 료중밀글루텐은높은공급성과낮은가격이특징이며글루타 민이풍부하여면역에좋다고알려져있다(Tusche et al., 2012;
Apper-Bossard et al., 2013). 대서양넙치(Hippoglossus hippo- glissus)와대서양연어(Salmo salar)에서어분대체원료로밀글 루텐을사용한결과, 밀글루텐이어분을대체할수있는비율 이약 20%까지가능하였다(Storebakkena et al., 2000; Helland and Grisdale-Helland, 2006). 본연구결과에서도밀글루텐을 어분대체원으로사용할경우, 밀글루텐의함량이대조사료보 다약 3배높은 FM30 실험구의비율이적정하다고판단된다. 혈중 IGF-I과 IGFBP level 분석
IGF-I은간에서생성되어혈액을통해전신으로운반되어, 근 육조직의형성에중요한역할을한다고알려진성장인자이다 (Wood et al., 2005). IGF-I은혈액내에서 IGFBP-3와결합하 여존재하고있으며, 이결합단백질은 IGFs의반감기를연장 시켜준다(Nam et al., 1996). 본연구결과, 혈중 IGF-I level는 어분대체단백질의함량에따라다르게나타났다. 한편 IGF-I 과가장많이결합하여존재하고, 식이단백질과밀접한관계가 있는 IGFBP-3 level는 20주사육기간동안 FM30 실험구가대 조구와유사한값을보였고(P<0.01, Fig. 2), 이결과는혈액중 의 IGF-I level의경향과유사하였다. 혈중 IGF-I level과혈중 IGFBP-3 level은실험시작부터실험종료시점인 20주까지비 슷한경향으로발현이되는것을확인하였으며, 모두동일하게 어분대체비율이 30%인 FM30에서높은값이나타났다. 이러 Fig. 4. Protein expression in liver of olive flounder Paralichthys olivaceus fed the experimental diets for 20 weeks. (A) Western blot analy- sis of IGF-I signaling pathway. (B) Expression of IGF-I, IGF-IR and PY99 activity. Each expression level is presented as a ratio against α-tubulin. *P<0.01 compared with 0 week group. FM0, replacement ratio 0% of fish meal diet; FM20, replacement ratio 20% of fish meal diet; FM30, replacement ratio 30% of fish meal diet; FM40, replacement ratio 40% of fish meal diet; FM50, replacement ratio 50% of fish meal diet.
0 100 200 300 400 500 600 700 800
0 4 8 12 16 20
FM 0 FM 20 FM 30 FM 40 FM 50
0 10 20 30 40 50
0 4 8 12 16 20
FM 0 FM 20 FM 30 FM 40 FM 50
0 5 10 15 20 25 30
0 4 8 12 16 20
FM 0 FM 20 FM 30 FM 40 FM 50
Total weight (g) Total length (cm) Body depth (cm)
Weeks Weeks Weeks
#
0 10 20 30 40 50
0 4 8 12 16 20
FM 0 FM 20 FM 30 FM 40 FM 50
0 0.2 0.4 0.6 0.8 1 1.2
4 8 12 16 20
FM0 FM20 FM30 FM40 FM50
IGF-I mRNA expression/GAPDH
Weeks
0 0.2 0.4 0.6 0.8 1 1.2
4 8 12 16 20
FM0 FM20 FM30 FM40 FM50
Weeks
IGF-I mRNA expression/GAPDH
*
*
*
*
*
*
*
*
* *
(A) Liver (B) Muscle
0 50 100 150
200 IGF-I
IGF-IR PY99
0 50 100 150
200 IGF-I
IGF-IR PY99
0 50 100 150
200 IGF-I
IGF-IR PY99
0 50 100 150
200 IGF-I
IGF-IR PY99
0 50 100 150
200 IGF-I
IGF-IR PY99
IGF-I, IGF-IR, PY99/α-tubulin ration (relative control)
4 weeks FM 0 FM 20 FM 30 FM 40 FM 50
8 weeks
FM 0 FM 20 FM 30 FM 40 FM 50 12 weeks FM 0 FM 20 FM 30 FM 40 FM 50
16 weeks
FM 0 FM 20 FM 30 FM 40 FM 50 20 weeks FM 0 FM 20 FM 30 FM 40 FM 50 IGF -I
IGF -IR PY99 α-tubulin
(A)
(B)
*
*
* *
* *
0 100 200 300 IGF-I
IGF-IR PY99
0 100 200 300 IGF-I
IGF-IR PY99
0 100 200 300 IGF-I
IGF-IR PY99
0 100 200 300 IGF-I
IGF-IR PY99
0 100 200 300 IGF-I
IGF-IR PY99
IGF-I, IGF-IR, PY99/α-tubulin ration (relative control)
(B)
FM0 FM 20 FM 30 FM 40 FM 50 4 weeks
FM0 FM 20 FM 30 FM 40 FM 50 8 weeks
FM0 FM 20 FM 30 FM 40 FM 50 12 weeks
FM0 FM 20 FM 30 FM 40 FM 50 16 weeks
FM0 FM 20 FM 30 FM 40 FM 50 20 weeks FM0 FM 20 FM 30 FM 40 FM 50
4 weeks
FM0 FM 20 FM 30 FM 40 FM 50 8 weeks
FM0 FM 20 FM 30 FM 40 FM 50 12 weeks
FM0 FM 20 FM 30 FM 40 FM 50 16 weeks
FM0 FM 20 FM 30 FM 40 FM 50 20 weeks
4 weeks FM 0 FM 20 FM 30 FM 40 FM 50
8 weeks FM 0 FM 20 FM 30 FM 40 FM 50
12 weeks FM 0 FM 20 FM 30 FM 40 FM 50
16 weeks FM 0 FM 20 FM 30 FM 40 FM 50
20 weeks FM 0 FM 20 FM 30 FM 40 FM 50 IGF -I
IGF -IR PY99 α-tubulin
(A)
* *
* 0
70 60 80 90 100 110 120 130
4 8 12 16 20
FM 0 FM 20 FM 30 FM 40 FM 50 IGFBP-3 level (%) (relative to FM0 group)
Weeks 0
70 60 80 90 100 110 120 130
4 8 12 16 20
FM 0 FM 20 FM 30 FM 40 FM 50 IGF-I level (%) (relative to FM0 group)
Weeks
박수진ㆍ문지성ㆍ서진송ㆍ남택정ㆍ이경준ㆍ임상구ㆍ김강웅ㆍ이봉주ㆍ허상우ㆍ최윤희 146
한결과를통해, 넙치육성어사육시공급하는어분대체사료 의적정비율이 30%가적합하다고판단된다.
IGF-I mRNA의 발현
IGF-I mRNA의발현량은간에서유의적으로높게나타났다
(P<0.01, Fig. 3). 이결과는 IGF-I의주된생산이간에서이루어 지고있다는결과를확인시켜준다(Kumar et al., 2016). 대조구 와비교해볼때, 어분대체 30%의실험구인 FM30에서 IGF-I 의발현량이높았으며, 이러한경향은간과근육에서동일하게 나타났다.
IGF-I, IGF-IR과 tyrosine-phosphorylation의 발현 넙치의 간과 근육조직에서 IGF-I의 발현을 확인하기 위해 western blot으로 분석한결과, Fig. 3과 같이넙치의근육과 간에서 IGF-I이모두존재하고있는것을확인하였으며, 혈중 IGF-I level과유사하게 FM30 실험구에서발현이높게나타났 다. 실험종료시기인 20주까지의사육기간동안대체로성장이 빠른초기단계인 4-8주근육에서 IGF-I의단백질발현량이높 았으며, 그이후에는간과근육에서비슷한결과를나타내고있 는것을알수있었다(Fig. 4, 5). IGF-I 신호전달체계의첫번
째단계인인산화유무를판단하기위해 PY99의활성을확인
하였으며, 그결과 20주까지원활하게 IGF-I 신호전달이진행 되는것을확인할수있었다(Fig. 4, 5). 간과근육내 IGF-I의발 현은영양상태와관련되어있으며(Duan, 1997; Ohlsson et al., 2009; Fuentes et al., 2013), 본연구에서도어분대체실험구내 IGF-I 활성이다르게나타났으며, 그중에서도어분대체 30%
실험구의 IGF-I 활성이 12주를제외하고높게나타났다. 12주
째 FM30 실험구가낮은발현을보인것은고수온에의한수온
변화및질병에의한폐사로개체간의차이가큰이유였을것 으로생각된다.
식물성단백질을이용한 Torstensen et al. (2008)의결과, 대 서양연어의성장률이어분대체 40%의실험구가적정하였고, Zheng et al. (2012)은넙치단백가수분해물을이용해어분을 대체하는경우 11%가적합하였으며, Gomes et al. (1995)은어 분대체 66%를식물성단백질로대체가가능하였다. 이러한결 과는어종마다적정어분대체비율이다르지만, 본연구결과를 포함하여어종별대체단백질의유효성을판단할수있는자료 로사용될것이다.
결론적으로, 어분대체 30%가기존넙치배합사료를대체할 수있을것으로판단되며, 추후에는 IGF-I signal의하위인자 들과조직학적 발달에관한연구가진행되어야할것으로사 료된다.
사 사
이논문은국립수산과학원(2019-013) 연구개발비지원에의 해수행되었습니다.
References
Apper-Bossard E, Feneuil A, Wagner A and Respomdek F. 2013.
Use of viral wheat gluten in aquaculture feeds. Aquatic Bio- Fig. 5. Protein expression in muscle of olive flounder Paralichthys olivaceus fed the experimental diets for 20 weeks. (A) Western blot analysis of IGF-I signaling pathway. (B) Change of IGF-I, IGF-IR and PY99 expression rate. Each expression level is presented as a ratio against α-tubulin. *P<0.01 compared with 0 week group. FM0, replacement ratio 0% of fish meal diet; FM20, replacement ratio 20% of fish meal diet; FM30, replacement ratio 30% of fish meal diet; FM40, replacement ratio 40% of fish meal diet; FM50, replacement ratio 50%
of fish meal diet.
0 100
0 4 8 12 16 20
FM 20 FM 30 FM 40 FM 50
0 0 4 8 12 16 20
FM 20 FM 30 FM 40 FM 50
0 5
0 4 8 12 16 20
FM 20 FM 30 FM 40 FM 50
Weeks Weeks Weeks
0 0 4 8 12 16 20
FM 20 FM 30 FM 40 FM 50
0 0.2 0.4 0.6 0.8 1 1.2
4 8 12 16 20
FM0 FM20 FM30 FM40 FM50
IGF-I mRNA expression/GAPDH
Weeks
0 0.2 0.4 0.6 0.8 1 1.2
4 8 12 16 20
FM0 FM20 FM30 FM40 FM50
Weeks
IGF-I mRNA expression/GAPDH
*
*
*
*
*
*
*
*
* *
(A) Liver (B) Muscle
0 50 100 150
200 IGF-I
IGF-IR PY99
0 50 100 150
200 IGF-I
IGF-IR PY99
0 50 100 150
200 IGF-I
IGF-IR PY99
0 50 100 150
200 IGF-I
IGF-IR PY99
0 50 100 150
200 IGF-I
IGF-IR PY99
IGF-I, IGF-IR, PY99/α-tubulin ration (relative control)
4 weeks FM 0 FM 20 FM 30 FM 40 FM 50
8 weeks
FM 0 FM 20 FM 30 FM 40 FM 50 12 weeks FM 0 FM 20 FM 30 FM 40 FM 50
16 weeks
FM 0 FM 20 FM 30 FM 40 FM 50 20 weeks FM 0 FM 20 FM 30 FM 40 FM 50 IGF -I
IGF -IR PY99 α-tubulin
(A)
(B)
*
*
* *
* *
0 100 200 300 IGF-I
IGF-IR PY99
0 100 200 300 IGF-I
IGF-IR PY99
0 100 200 300 IGF-I
IGF-IR PY99
0 100 200 300 IGF-I
IGF-IR PY99
0 100 200 300 IGF-I
IGF-IR PY99
IGF-I, IGF-IR, PY99/α-tubulin ration (relative control)
(B)
FM0 FM 20 FM 30 FM 40 FM 50 4 weeks
FM0 FM 20 FM 30 FM 40 FM 50 8 weeks
FM0 FM 20 FM 30 FM 40 FM 50 12 weeks
FM0 FM 20 FM 30 FM 40 FM 50 16 weeks
FM0 FM 20 FM 30 FM 40 FM 50 20 weeks FM0 FM 20 FM 30 FM 40 FM 50
4 weeks
FM0 FM 20 FM 30 FM 40 FM 50 8 weeks
FM0 FM 20 FM 30 FM 40 FM 50 12 weeks
FM0 FM 20 FM 30 FM 40 FM 50 16 weeks
FM0 FM 20 FM 30 FM 40 FM 50 20 weeks
4 weeks FM 0 FM 20 FM 30 FM 40 FM 50
8 weeks FM 0 FM 20 FM 30 FM 40 FM 50
12 weeks FM 0 FM 20 FM 30 FM 40 FM 50
16 weeks FM 0 FM 20 FM 30 FM 40 FM 50
20 weeks FM 0 FM 20 FM 30 FM 40 FM 50 IGF -I
IGF -IR PY99 α-tubulin
(A)
* *
* 0
70 60 80 90 100 110 120 130
4 8 12 16 20
FM 0 FM 20 FM 30 FM 40 FM 50 IGFBP-3 level (%) (relative to FM0 group)
Weeks 0
70 60 80 90 100 110 120 130
4 8 12 16 20
FM 0 FM 20 FM 30 FM 40 FM 50 IGF-I level (%) (relative to FM0 group)
Weeks