Algorithm to determine injection position in olive flounder, Paralichthys olivaceus
Bong ‐ jin Cha
1)*† , Mun ‐ gyeong Kwon ** , Hyun ‐ young Kim *** , Myoung ‐ ae Park ****
* Fisheries Engineering Division, National Fisheries Research & Development Institute Busan 619‐902, Republic of Korea
** Pathology Division, National Fisheries Research & Development Institute Busan 619‐902, Republic of Korea
*** Research and Development Planning Division, National Fisheries Research & Development Institute Busan 619‐902, Republic of Korea
**** Aguatic life Disease Control Division, National Fisheries Research & Development Institute Busan 619‐902, Republic of Korea
This study aimed to develop an algorithm to determine the optimal injection position in olive flounder,
Paralichthys olivaceus when a vaccine is injected into the fish by using a vision‐based automatic equipment measruing
the total length (TL), width and weight of the fish. Over a 5‐month period, 500 olive flounders were examined to analyze the relation of the fish size and to the shape and location of its abdomen, using radiography, a ruler plate and scale. There were significant correlations between the TL and the shape and location of the abdomen. The abdomen was located 0.232TL – 2.7221 mm (R2
= 0.8787) from the end of the mouth of the fish. The height and width of the abdomen in the fish were 0.1292TL + 1.8768 mm (R2
= 0.7935) and 0.183TL–5.9791 mm (R2
= 0.8641), respectively. The injection point in the abdominal region avoiding organs was determined by calculating the center of gravity of the abdomen volume. This can be expressed as g (0.2759TL – 2.0965, 0.1295TL – 4.2325) on the basis of TL line coordinates. The injection point by the expressed coordinates had errors for the x and y axes as 12.15 mm and 8.28 mm, respectively. These were enough to use the algorithm to injection for the equipment. This automated method to determine the position of any part in the fish can also be used for other purposes, for example, intramuscular injection or auto‐tagging of fish.Key words :
Automatic Injection, Olive Flounder Culture, Abdomen Injection Position
In 2012, the production of olive flounders in Korea reached 39,371 tons, which accounted for 56% of all aquatic fish products in Korea. These fish receive government‐supported vaccinations more than once during culture to protect against the development of diseases. In general, each fish is vaccinated manually
†Corresponding author: Bong‐jin Cha
Tel: +82 517202581; Fax: +82 517202586 E‐mail address: [email protected]
by experts but there are concerns on its effectiveness although it has been a convenient way of vaccine administration over the long term. For one thing vaccinations need to be administered continuously for several days because experts need to inject 1,000–1,200 fish in 1 h (Ellis, 2002). This increases risk of occupational hand injuries (O’Neil et al., 2005) and might affect the outcome of injection.
Plumb and Hanson (2010) and Lee et al. (2012, 2013)
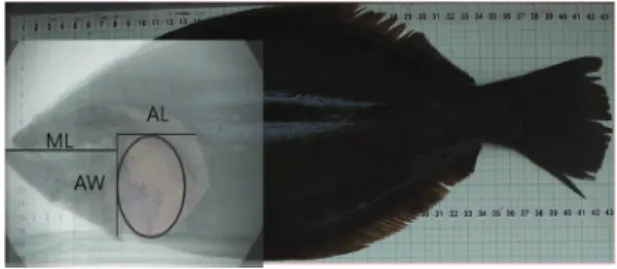
Fig. 1. Overlapped image of a picture of a dissected abdominal region and that of a radiograph to determine the location and internal structure of the abdomen.
ML: Length from the end of a mouth to the abdomen AL: Length of the abdomen
AW: Width of the abdomen softer than the muscles. Experienced persons can easily
determine the site of injection; however, an algorithm needs to be developed to determine the injection position when an automatic machine is used. A study (Son, 2006) has determined the relationship between parameters such as age, total length, width, and weight of the fish;
however, information regarding the exact location and shape of the abdominal region of fish is scarce.
Moreover, there is a risk that injection at an incorrect site might injure organs around the abdominal region.
This study aimed to develop an algorithm to automatically decide the injection site for olive flounder by using the machine designed by Lee et al. (2013).
Materials and methods
To determine an injection position that would minimize injury to organs in the abdominal region, a picture of the abdominal region drawn by an expert and For one thing its radiography (X‐eye 7000B; SEC Co., Korea) were overlapped as one picture (Fig. 1).
Once a month from May to September 2011, the size and location of the abdominal region of 100 fish according to their size were determined after measuring the total length (TL), weight (W), and width (WL) using a ruler plate and scale. The radiographic measurements
Results and Discussion
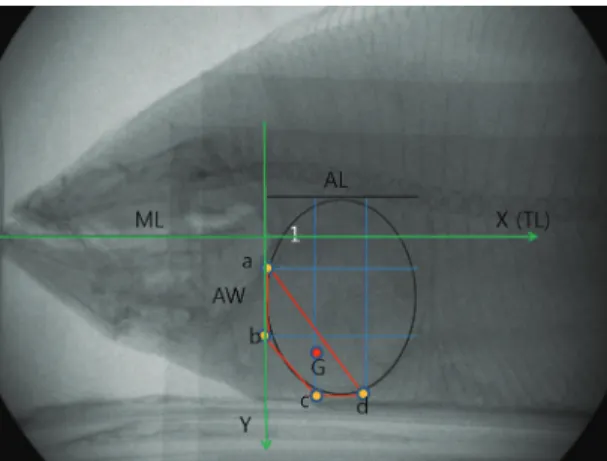
When the abdominal region is divided into 3 equal parts lengthwise and widthwise as shown in Fig. 2, the area within the red lines seems to be the best region to inject a vaccine because this region is devoid of any organ and a needle can be injected easily since the region is filled with body fluids and has a thin skin layer.
This area can be distinguished from the other parts because of the lower height and absence of organs under the skin. For the machine, the injection site should be a point for easy manipulation. Therefore, the center position of the region in the diagram was selected as the injection site.
Lee et al. (2012) suggested that TL would be
calculated by drawing a line through the center of a
fish by using a vision system. Therefore, ML is located
on TL because ML starts from the end of the mouth
Fig. 2. The location and shape of the abdominal region in the fish can be shown using a coordinate obtained using ML and AW as the x‐ and y‐axes, respectively. In order to generate an equation for determining the injection site at the abdominal region, while avoiding injury to organs, an area was marked by red lines. The point “G” was designated the center of gravity of the diagram.
Fig. 3. ML, AL, and AW have R 2 values of 0.8797, 0.7935, and 0.8641, respectively, on the basis of the total length (TL) of the fish.
and divides the white “1” part of Fig. 2, which is located on the TL when the abdominal region of the fish is divided into 3 equal parts lengthwise, into half when the abdomen is opened and measurements are performed.
When TL is plotted on the x‐axis, the coordinates a, b, c, d, and G on the y‐axis are expressed as equations involving ML, AL, and AW as follows.
a (ML, AW/6), b (ML, 1.5AW/3), c (ML+AL/3, 2.5AW/3), d (ML+2AL/3, 2.5AW/3)
Injection point
Eq. (1)The point can be determined as shown below using the relationships between ML, AL, AW, and TL by using the results from Fig. 3. ML, AW and AL were 0.328TL‐2.7221 (R 2 0.879), 0.183TL‐0.9791 (R 2 0.8641) and 0.1292TL+1.8768 (R 2 0.7935), respectably.
Injection point according to TL
G (0.2759TL – 2.0965, 0.1295TL – 4.2325) Eq. (2)
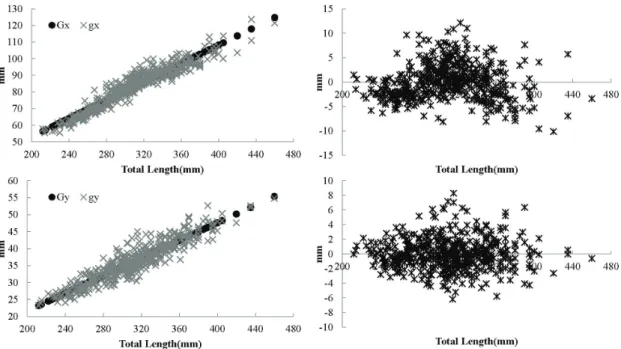
Figure 4 shows the error values for the coordinate of the point between the values obtained using radiography and calculated using Eq. (2). The greatest errors for AL and AW were 12.15 and 8.28 mm, respectively, and when these values are used, injury to organs in the abdominal region can be avoided because the coordinate values of the errors fall in the red region of Fig. 3.
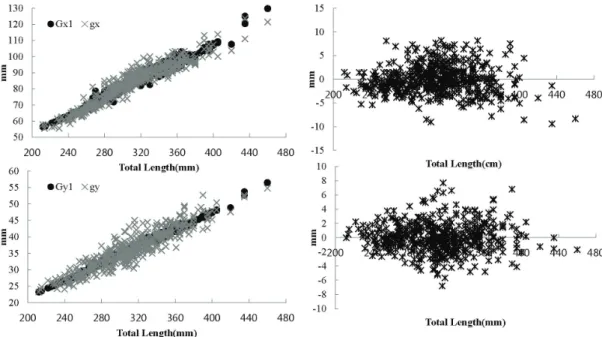
Equations (3) and (4) show multiple regression lines (SAS, Enterprise, 2009). The former is calculated using TL and weight, and the latter using TL, weight, and width. The accuracy of identifying the injection site can be increased by using the latter equation that considers width and weight in addition to TL, which can be measured automatically by the machine. Injection positions by Eq.
(3) and (4) were more accurate than Eq. (2)’s (show
Figs. 5 and 6). If considerable time and resources are
Fig. 4. The greatest error at the x‐ and y‐coordinate of the point obtained using Eq. (2) was 12.1 5 and 8.28 mm, respectively, compared to the actual point obtained using Eq. (1), which was developed on the basis of the information from the radiograph.
These error bars do not exceed the region marked by red lines in Fig. 2.
Gx and Gy are coordinates obtained using Eq. (2); gx and gy are coordinates obtained using Eq. (1) Difference in the injection point determined using Eq. (2) from that derived using Eq. (1)
not required for computing the weight and width of the fish by the machine, these equations are better than the previous Eq. (2) to determine the injection site.
Injection point according to TL and weight
G1(15.03931+0.1797TL+0.0396W,‐0.44933+0.10837TL+
0.00875W) Eq. (3)
Injection point according to TL, weight, and width G2(17.64654+0.12626TL+0.03871W+0.11306WL, 2.12272+0.05565TL+0.00788W+0.11153WL) Eq. (4)