Analysis of Global Gene Expression Profile of Human Adipose Tissue Derived Mesenchymal Stem Cell Cultured with Cancer Cells
Jong Myung Kim
1,2,3, Ji Min Yu
2,3, Yong Chan Bae
4and Jin Sup Jung
2,3,5*
1
MD-PhD program, School of Medicine, Pusan National University, Yangsan 626-870, Korea
2
Department of Physiology, School of Medicine, Pusan National University, Yangsan 626-870, Korea
3
Medical Research Center for Ischemic Tissue Regeneration, School of Medicine, Pusan National University, Yangsan 626-870, Korea
4
Department of Plastic Surgery, School of Medicine, Pusan National University, Yangsan 626-870, Korea
5
Medical Research Institute, Pusan National University, Yangsan 626-870, Korea
Received February 17, 2011 /Accepted March 15, 2011Mesenchymal stem cells (MSC) are multipotent and can be isolated from diverse human tissues in- cluding bone marrow, fat, placenta, dental pulp, synovium, tonsil, and the thymus. They function as regulators of tissue homeostasis. Because of their various advantages such as plasticity, easy isolation and manipulation, chemotaxis to cancer, and immune regulatory function, MSCs have been consid- ered to be a potent cell source for regenerative medicine, cancer treatment and other cell based ther- apy such as GVHD. However, relating to its supportive feature for surrounding cell and tissue, it has been frequently reported that MSCs accelerate tumor growth by modulating cancer microenvironment through promoting angiogenesis, secreting growth factors, and suppressing anti-tumorigenic immune reaction. Thus, clinical application of MSCs has been limited. To understand the underlying mecha- nism which modulates MSCs to function as tumor supportive cells, we co-cultured human adipose tissue derived mesenchymal stem cells (ASC) with cancer cell lines H460 and U87MG. Then, ex- pression data of ASCs co-cultured with cancer cells and cultured alone were obtained via microarray.
Comparative expression analysis was carried out using DAVID (Database for Annotation, Visualization and Integrated Discovery) and PANTHER (Protein ANalysis THrough Evolutionary Relationships) in divers aspects including biological process, molecular function, cellular component, protein class, disease, tissue expression, and signal pathway. We found that cancer cells alter the ex- pression profile of MSCs to cancer associated fibroblast like cells by modulating its energy metabo- lism, stemness, cell structure components, and paracrine effect in a variety of levels. These findings will improve the clinical efficacy and safety of MSCs based cell therapy.
Key words : Mesenchymal stem cell (MSC), cancer, MSC-cancer interaction, comparative expression analysis, cancer associated fibroblast
*Corresponding author
*Tel:+82-51-510-8071, Fax:+82-51-510-8076
*E-mail : [email protected]
Introduction
Mesenchymal stem cells (MSC) are a population of pheno- typically heterogeneous cells that can be isolated from many easily accessible tissues such as adipose tissue, umbilical cord, placenta, and bone marrow and have ability to differ- entiate into a variety of mesodermal lineage, including adi- pocyte, osteoblast, chondrocyte, muscle cells and pericyte and its plasticity has been expanded to non-mesodemal line- age such as neural cells [38,42]. MSCs do not express HLA class II antigens, or the accessory molecules CD40, CD80 and CD86, required for immune cell activation and, thus, histo- compatibility matching is not necessary for therapeutic ap-
plication [21].
Because of its differentiation potential and relatively easy method for isolation, MSCs have been considered as ideal source of cell therapy for various human diseases [1,37].
However, especially in the field of cancer treatment, MSCs play a role as a flip side of the coin. It not only can deliver anticancer drug or be easily manipulated to introduce anti- tumor effect to cancer but also promotes malignancy by functioning as a tumor supportive stromal cells. The mi- gratory ability of MSCs to tumor sites has inspired inves- tigation into the possibility of using these cells as genes and anticancer agent delivery vesicle [45,46]. Furthermore, in contrast to other stem cells or normal stromal cells, naive MSCs have been thought to possess intrinsic antineoplastic properties [22].
On the other hand, in normal tissues, MSCs provide mi-
croenvironment to regulate and support the tissue resident cells like hematopoietic stem cells in bone marrow [10,48].
Theses supportive features of MSCs also can be recapitulated in cancer microenvironment. MSCs regulate angiogenesis, inflammation, and homeostasis of tumor niche and favor tu- mor progression [3,52]. In spite of its protumorigenic effects, MSCs are still therapeutically useful cell source. To utilize and maximize the therapeutic efficacy of MSCs, the dark side of the coin should be revealed and deeply understood.
In this study, to get insight how cancer cells manipulate MSCs to utilize its tumor promoting activity, we obtained gene expression data from adipose tissue derived MSC (ASC) co-cultured with cancer cells through whole genome expression analysis using gene chip assay. Differentially ex- pressed transcripts compared to those of ASC cultured alone were analyzed using the Database for Annotation, Visualization and Integrated Discovery (DAVID) version 6.7 and Protein ANalysis THrough Evolutionary Relationships (PANTHER) version 7 [18,31]. Expression profiles of ASCs were categorized to functionally related groups in diverse level of cell and molecular biology and its significances were interpreted.
Materials and Methods Culture of ASCs and cancer cell lines
The ASCs were isolated in accordance with the methods described in previous studies [26]. All protocols involving human subjects were approved by the Institutional Review Boards (IRB) of Pusan National University. After giving in- formed consent, adipose tissues were acquired from in- dividuals undergoing abdominoplasty. In order to isolate ASCs, the adipose tissues were washed thoroughly with equal volumes of phosphate-buffered saline (PBS), and the tissues were digested for 30 minutes at 37°C using 0.075%
collagenase. Enzyme activity was neutralized using α -modified Eagles medium (α-MEM, Invitrogen, Carlsbad, CA), containing 10% fetal bovine serum (FBS), then centri- fuged for 10 minutes at 1,200× g in order to obtain the pellets. The pellets were filtered through 100-µm nylon mesh in order to remove cellular debris, then incubated overnight at 37°C/5% CO
2in control medium (α-MEM, 10% FBS, 100 units/ml penicillin and 100 µg/ml streptomycin). After in- cubation, the plates were extensively washed in PBS in order to remove residual non-adherent red blood cells. The media was changed every 3 days, and the cells were split upon
achieving 70% confluence. ASCs were used at passage 3-10 for the experiments. U87MG and H460 cells were commer- cially obtained (ATCC) and were cultured in DMEM con- taining 10% FBS.
Production and transduction with GFP-lentiviral vectors
Replication-defective lentiviruses were generated via the transient transfection of 293T cells using Lipofectamine Plus (Invitrogen, Carlsbad, CA), lentiviral GFP vector (pWPT- GFP), and a packaging mix (Invitrogen). After transfection, the virus was harvested at 48 and 72 hr and filtered through Millex-HV 0.45 µm PVDF filters (Millipore, Billerica, MA), then maintained at -80°C until use. U87MG and H460 cells were transduced via 6 hr of exposure to dilutions of viral supernatant in the presence of polybrene (5 µg/ml). The transduction efficiency was estimated by determining the percentage of GFP-positive cells 2 to 3 days later via fluo- rescent microscopy and flow cytometry.
Xenotransplantation of tumor cells
Balb/C nude mice at 7 weeks of age were purchased from the Laboratory Animal Center of Seoul, Korea. The animals were housed in micro-isolator cages under sterile conditions, and observed for at least 1 week in order to ensure proper health prior to the initiation of the study. Lighting, temper- ature, and humidity were centrally controlled and recorded daily. One million H460 cells were implanted subcuta- neously into the backs of the mice. After 3 days, 1×10
6ASCs were injected into the tail vein or heart of the same mouse.
Animals were sacrificed 3 weeks after transplantation and tumor growth was evaluated.
Histology
Tumor samples were dissected from mice, and fixed over- night in 10% phosphate-buffered formalin, transferred to 70% ethanol, then embedded in paraffin. To analyze tumor morphology, the samples were sectioned for 10 successive layers at 5 mm intervals and stained with hematoxylin and eosin (H&E).
Co-culture experiments
For labeling of ASCs with CM-Dil (Molecular Probes,
Eugene, OR, USA), ASCs were incubated with 2 uM
CM-Dil for 5 min at 37°C and for an additional 15 min at
4°C. The cancer cells were transduced with GFP-lentivirus
A B C
D E
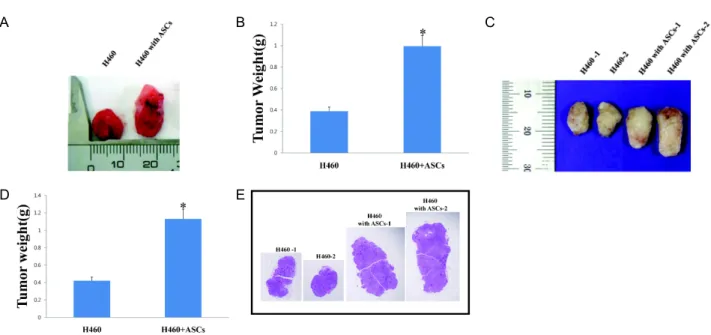
Fig. 1. ASCs promote tumor growth
in vivo
. (A) Effect of intracardiac injection of ASCs on growth of H460 in nude mice. 3 days after subcutaneous transplantation of H460, ASCs were injected into heart of the same mice. After 3 weeks, tumors size were compared between H460 injected alone and H460 co-injected with ASCs. (B) Quantification of tumor weight of H460 injected alone and H460 co-injected with ASCs (intracardiac). Data represent means±SEM of three different experiments.*
p
<0.05 compared with H460 injected alone. (C) Effect of intravenous injection of ASCs on growth of H460 in nude mice (mouse 1 and 2). 3 days after subcutaneous transplantation of H460, ASCs were injected into tail vein of the same mice.After 3 weeks, tumors size were compared between H460 injected alone and H460 co-injected with ASCs. (D) Quantification of tumor weight of H460 injected alone and H460 co-injected with ASCs (intravenous). Data represent means±SEM of three different experiments. *
p
<0.05 compared with H460 injected alone. (E) H&E staining of tumor derived from H460 or H460 co-injected with ASCs.A B
Fig. 2. Co-culture of ASCs and U87MG cells. (A) Representative image of co-culture experiments. CM-Dil labeled ASCs were co-cul- tured with GFP positive U87MG cells. (B) ASCs (PE positive) were sorted from cancer cells (FITC positive) by FACS.
and GFP labeled cancer cells were sorted with a flow cy- tometry cell sorter (FACSaria, BD Biosciences) prior to co-culture. The ASCs were plated on 6-well plate with H460 or U87MG cells. ASCs co-cultured with cancer cells were harvested 48 hours after co-culture. The cells were washed twice in PBS containing 0.5% BSA, and ASCs cells were sorted by a flow cytometry cell sorter (BD FACSAria, BD Biosciences).
Microarray analysis
The ASCs were harvested after co-cultured with U87MG or H460 cells or alone and RNA was isolated using the Invitrogen RNA isolation kit (Invitrogen Corporation). For Illumina microarray analysis, samples were prepared and analyzed in Illumina laboratories by Illumina personnel.
Biotinylated cRNA was prepared using the Illumina RNA
Amplification Kit (Ambion, Inc., Austin, TX) according to
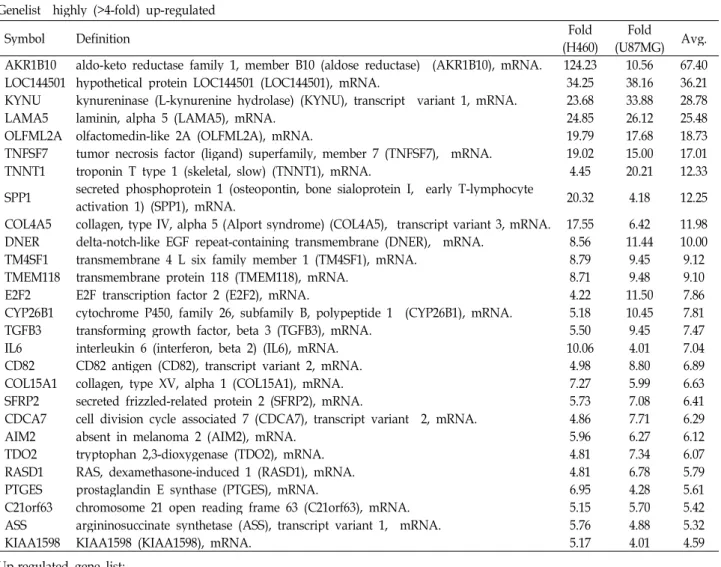
Table 1. List of differentially regulated genes Genelist highly (>4-fold) up-regulated
Symbol Definition Fold
(H460) Fold
(U87MG) Avg.
AKR1B10 aldo-keto reductase family 1, member B10 (aldose reductase) (AKR1B10), mRNA. 124.23 10.56 67.40 LOC144501 hypothetical protein LOC144501 (LOC144501), mRNA. 34.25 38.16 36.21 KYNU kynureninase (L-kynurenine hydrolase) (KYNU), transcript variant 1, mRNA. 23.68 33.88 28.78
LAMA5 laminin, alpha 5 (LAMA5), mRNA. 24.85 26.12 25.48
OLFML2A olfactomedin-like 2A (OLFML2A), mRNA. 19.79 17.68 18.73
TNFSF7 tumor necrosis factor (ligand) superfamily, member 7 (TNFSF7), mRNA. 19.02 15.00 17.01
TNNT1 troponin T type 1 (skeletal, slow) (TNNT1), mRNA. 4.45 20.21 12.33
SPP1 secreted phosphoprotein 1 (osteopontin, bone sialoprotein I, early T-lymphocyte
activation 1) (SPP1), mRNA. 20.32 4.18 12.25
COL4A5 collagen, type IV, alpha 5 (Alport syndrome) (COL4A5), transcript variant 3, mRNA. 17.55 6.42 11.98 DNER delta-notch-like EGF repeat-containing transmembrane (DNER), mRNA. 8.56 11.44 10.00 TM4SF1 transmembrane 4 L six family member 1 (TM4SF1), mRNA. 8.79 9.45 9.12
TMEM118 transmembrane protein 118 (TMEM118), mRNA. 8.71 9.48 9.10
E2F2 E2F transcription factor 2 (E2F2), mRNA. 4.22 11.50 7.86
CYP26B1 cytochrome P450, family 26, subfamily B, polypeptide 1 (CYP26B1), mRNA. 5.18 10.45 7.81
TGFB3 transforming growth factor, beta 3 (TGFB3), mRNA. 5.50 9.45 7.47
IL6 interleukin 6 (interferon, beta 2) (IL6), mRNA. 10.06 4.01 7.04
CD82 CD82 antigen (CD82), transcript variant 2, mRNA. 4.98 8.80 6.89
COL15A1 collagen, type XV, alpha 1 (COL15A1), mRNA. 7.27 5.99 6.63
SFRP2 secreted frizzled-related protein 2 (SFRP2), mRNA. 5.73 7.08 6.41
CDCA7 cell division cycle associated 7 (CDCA7), transcript variant 2, mRNA. 4.86 7.71 6.29
AIM2 absent in melanoma 2 (AIM2), mRNA. 5.96 6.27 6.12
TDO2 tryptophan 2,3-dioxygenase (TDO2), mRNA. 4.81 7.34 6.07
RASD1 RAS, dexamethasone-induced 1 (RASD1), mRNA. 4.81 6.78 5.79
PTGES prostaglandin E synthase (PTGES), mRNA. 6.95 4.28 5.61
C21orf63 chromosome 21 open reading frame 63 (C21orf63), mRNA. 5.15 5.70 5.42 ASS argininosuccinate synthetase (ASS), transcript variant 1, mRNA. 5.76 4.88 5.32
KIAA1598 KIAA1598 (KIAA1598), mRNA. 5.17 4.01 4.59
Up-regulated gene list;
EZH2, LASS6, APOE, SLC27A5, KLF9, RBP1, WISP1, GSTM3, OCIAD2, SNRPF, CYP2R1, AHCY, C10orf90, PYGL, JAG1, SH3PXD2B, C20orf31, PFKFB4, PSD3, SEMA4D, PRIM1, EGR2, CTXN1, EPPB9, NR1H3, ALDH2, NETO2, MAOA, RAB7L1, SLC6A15, PLXDC1, APCDD1, EYA4, DLX1, LITAF, KLHL3, PRR7, TMEPAI, MGST2, ITPKA, SH3RF2, TSPAN13, MTHFD2L, SOCS3, LOC389289, PLA2G4A, PITPNM1, SHMT1, PTGER4, CYFIP2, ABCA8, HES6, HMFN0839, LOC401233, TMEM51, HSD17B8, ABCA1, SLC25A37, URP2, GCHFR, E2F5, TNFRSF21, APOC1, PDGFRB, TFAP2C, SCD, C1QTNF6, PLTP, CD82, PHKA1, PLAU, MLPH, ATP6V0E2L, GPR56, IGF2BP3, CYGB, NEIL3, RNF144, VGF, IL24, TMEM100, HSP90B1, TNFAIP2, C10orf58, ZC3H12A, HPCAL1, HEYL, SPON1, CHRNA5, IL11, COL7A1, TNFRSF19, IMPA2, SLC44A1, HYAL1, CFD, ZIC2, GBP2, HES1, ITPR1, EGR1, C9orf140, LIF, TNS3, SERPIND1, E2F2, EPHX1, C9orf58, HYOU1, TNNT1, CCL3, SNF1LK, HSPA5, RASD1, TDO2, CDCA7, CD82, ETV4, CCL20, C21orf63, KIAA1598, CYP26B1, MLLT11, EXO1, PDIA4, FLJ14213, TGFB3, CMTM8, SFRP2, HEY1, ASS, AIM2, DNAJC12, CXCL2, PRG1, UNG2, NMB, PTGES, ANKRD38, COL15A1, QPCT, RSPO3, DNER, TMEM118, TM4SF1, DKFZP686A01247, CH25H, ALPL, KRT18, SCARB1, IL6, PDE4D, RAB20, SLC39A8, AKR1C3, DNAJC12, PIR, RGS2, CPS1, COL4A5, TNFSF7, OLFML2A, SPP1, KYNU, LAMA5, RGS16, LOC144501, EEF1A2, AKR1B10,
the manufacturer's directions starting with ~100 ng total RNA. Samples were purified using the RNeasy kit (Qiagen, Valencia, CA). Hybridization to the Sentrix HumanRef-8 Expression BeadChip (Illumina, Inc., San Diego, CA), wash- ing and scanning were performed according to the Illumina Bead Station 500× manual (revision C). Two Bead Chips were used, each one containing eight arrays, so that each
dilution series of six samples was run on an individual
BeadChip. Three independent sets for each of the ex-
perimental conditions were analyzed to minimize intra-
sample variation. Transcripts were considered increased or
decreased only if the levels changed by greater than 2-fold
with p<0.0001 for up-regulation and p>0.9997 for down-reg-
ulation to enhance the significance. Comparative analyses
Table 1. Continued
Genelisthighly (>4-fold) down-regulated
Symbol Definition Fold
(H460) Fold
(U87MG) Avg.
TXNIP thioredoxin interacting protein (TXNIP), mRNA. -22.52 -12.78 -17.65
GABBR2 gamma-aminobutyric acid (GABA) B receptor, 2 (GABBR2), mRNA. -6.98 -20.28 -13.63
KRTHA4 keratin, hair, acidic, 4 (KRTHA4), mRNA. -15.57 -7.53 -11.55
DKK1 dickkopf homolog 1 (Xenopus laevis) (DKK1), mRNA. -8.62 -13.84 -11.23
SERPINB2 serpin peptidase inhibitor, clade B (ovalbumin), member 2 (SERPINB2), mRNA. -4.48 -17.39 -10.94 CITED2 Cbp/p300-interacting transactivator, with Glu/Asp-rich carboxy-terminal domain, 2
(CITED2), mRNA. -4.83 -9.39 -7.11
UNQ1940 HWKM1940 (UNQ1940), mRNA. -5.15 -8.59 -6.87
LOC388610 hypothetical LOC388610 (LOC388610), mRNA. -6.82 -6.79 -6.81
EDG1 endothelial differentiation, sphingolipid G-protein-coupled receptor, 1 (EDG1), mRNA. -4.54 -6.24 -5.39
KIAA1913 KIAA1913 (KIAA1913), mRNA. -4.76 -5.61 -5.18
DDAH1 dimethylarginine dimethylaminohydrolase 1 (DDAH1), mRNA. -5.91 -4.19 -5.05
WNK4 WNK lysine deficient protein kinase 4 (WNK4), mRNA. -5.21 -4.75 -4.98
URB steroid sensitive gene 1 (URB), transcript variant 2, mRNA. -5.35 -4.54 -4.95 TEK TEK tyrosine kinase, endothelial (venous malformations, multiple cutaneous and
mucosal) (TEK), mRNA. -4.71 -4.39 -4.55
F3 coagulation factor III (thromboplastin, tissue factor) (F3), mRNA. -4.38 -4.32 -4.35 Down-regulated gene list;
TXNIP, KRTHA4, MARCH4, DKK1, CLDN11, GABBR2, LOC388610, DDAH1, URB, CYR61, WNK4, UNQ1940, NEXN, FOXD1, CITED2, CAV1, KIAA1913, TEK, OXTR, EDG1, SERPINB2, IGFBP3, F3, FMN2, LFNG, ARHGDIB, TIPARP, GLIPR1, SLIT2, ANPEP, EPHB1, LPXN, URB, TNFRSF11B, BAIAP2L2, GRAMD3, ARRDC4, KCNJ8, EBF3, DOK5, ATP8B1, ANGPTL4, NAV3, ADAMTS1, ASAM, LOC387882, NPAL3, TBC1D2, FZD8, PCDH18, RGMB, ACOT11, LOC90355, DOC1, PITX2, KRT7, LAYN, DOC1, UAP1, HAS2, CRIM1, ELL2, HYI, ATOH8, PDCD1LG2, HOXC8, PVRL3, MGC13057, ABHD5, PHACTR2, NGFB, RRAS2, CXCL12, WNT5B, LRRC8C, OSR1, LOC51334, HIST1H4H, Bles03, AK5, RAFTLIN, BNC1, CNTN3, SLC9A7, DSP, CCIN, HAK, RALGPS2, FCRLM2, SEMA7A, MGC17624, DUSP14, MT1M, TPM1, CDC42EP2, TMEM47, SLITL2, SHRM, VEGFC, DNASE1L3, RPS6KA2, OXCT2, EGFR, TLN2, ZNF442, PLEK2, GADD45A, MGC26963, CXCL12, S100A13, HLX1, HERC3, ARID5B, FLJ22471, HOXA9, BCAR3, CAV2, SAMD4A, TNFRSF12A, CDH2, ABCC9
of expressed genes that were either up-regulated or down-regulated under various experimental conditions were carried out using proprietary software from Database for Annotation, Visualization and Integrated Discovery (DAVID) version 6.7 and Protein ANalysis THrough Evolutionary Relationships (PANTHER) version 7 tools.
Statistical analysis
All results are presented as mean±SEM. Comparisons be- tween groups were analyzed via Student’s t-tests. P values
<0.05 were considered statistically significant.
Results ASCs promote tumor growth in vivo
To evaluate the effect of ASCs to tumor growth, ASCs were injected into the heart or tail vein of nude mice that
had received subcutaneous transplantation of cancer cells,
Fig. 3. Schematic diagram of outline of this experiment. Detail explanation is described in the paragraph.A-1 A-2
B-1 B-2
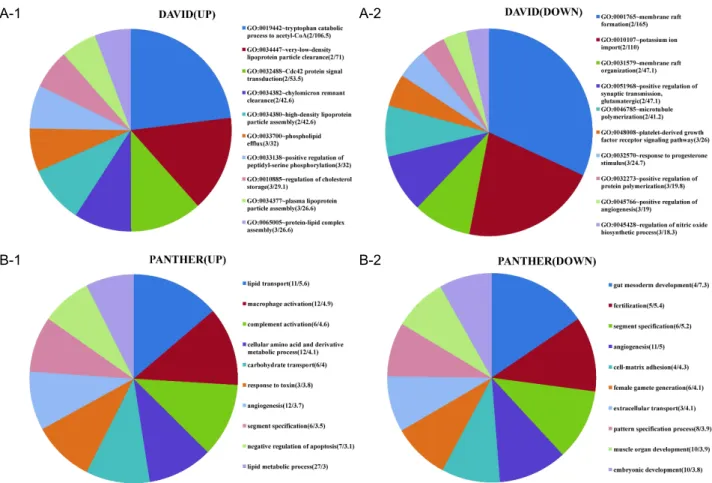
Fig. 4. Biological processes of differentially regulated genes. Top 10 for fold enrichment were shown. Biological processes of input genes were obtained from DAVID (4A) or PANTHER (4B). The numbers in parenthesis indicate (gene numbers/fold enrich- ment). The area of individual slices of pie chart represents fold enrichment of the particular biological process. Fold enrichment for a term is defined as user’s gene numbers divided by expected gene numbers in the term based on the human genome.
For example, 10% of user’s input genes are kinase versus 1% of genes in human genome are kinase. Thus, the fold enrichment is tenfold.
p
-values of all data are less than 0.05.H460. After three weeks of injection, the weight of tumor was measured. The volume and weight of tumors in mice, which had a co-injection of ASCs, were bigger and heavier than those of control mice, which were injected with cancer cell alone (Fig. 1).
Evaluation of the gene expression profile of ASCs co-cultured with cancer cells
To analysis the influence of cancer cells to global gene expression of ASCs, CM-Dil labeled ASCs were co-cultured with GFP-positive H460 or U87MG. After three days of co-culture, ASCs were sorted by FACS (Fig. 2) and gene ex- pression was quantified using microarray analysis in com- parison with control ASCs, which were not co-cultured with cancer cells. We only focused on the genes, which had more than 2-fold difference in expression, compared to control and
had same direction of expressional changes in both ASCs co-cultured with H460 (ASC-H) and ASCs co-cultured with U87MG (ASC-U) to study the general characteristics of ex- pression profile. 511 genes were up-regulated in ASC-H and 740 genes were up-regulated in ASC-U. Among them, 168 genes were commonly increased in both ASC-H and ASC-U.
323 genes were down-regulated in ASC-H and 714 genes were down-regulated in ASC-U. Among them, 121 genes were commonly decreased in both ASC-H and ASC-U. Table 1 shows the list of these commonly expressed genes.
Comparative analysis of these up and down-regulated genes was performed using DAVID or PANTHER (Fig. 3).
Biological and functional categories of differentially expressed genes
Biological processes of up-regulated genes with high fold
A-1 A-2
B-1 B-2
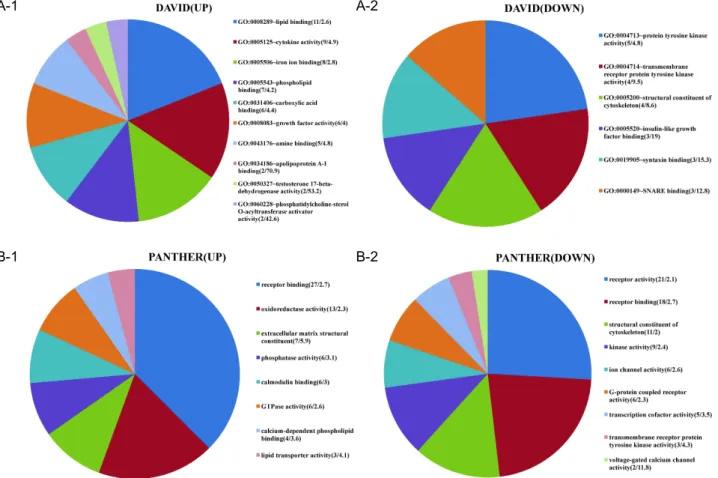
Fig. 5. Molecular functions of differentially expressed genes. Molecular functions of input genes were obtained from DAVID (5A) or PANTHER (5B). The numbers in parenthesis indicate (gene numbers/fold enrichment). The area of individual slices of pie chart represents percentage of the genes belonging to the particular molecular function.
p
-values of all data are less than 0.05.enrichment included tryptophan catabolic process to ace- tyl-CoA, lipid and cholesterol metabolism, amino acid me- tabolism, macrophage activation, angiogenesis, carbohydrate transport, response to toxin, and CDC42 signal transduction.
In terms of down-regulated genes, mesoderm and embry- onic development, which is characteristics of stemness, membrane raft formation, potassium ion import, PDGF re- ceptor pathway, response to progesterone, angiogenesis, mi- crotubule polymerization, nitric oxide synthesis, and cell-matrix adhesion, were significantly enriched. It is note- worthy that angiogenesis belongs to both up and down-regulated gene groups (Fig. 4). Molecular functions of differentially regulated genes were also analyzed. Lipid and phospholipid binding, cytokine activity, iron binding, ECM structure constituent, and phosphatase activity were increased. In contrast, tyrosine kinase activity, cytoskeleton structural constituent, IGF binding, syntaxin and SNARE binding, and ion channel activity were decreased.
Interestingly, intracellular (or cytoskeletal) and extracellular structural components were differentially regulated (Fig. 5).
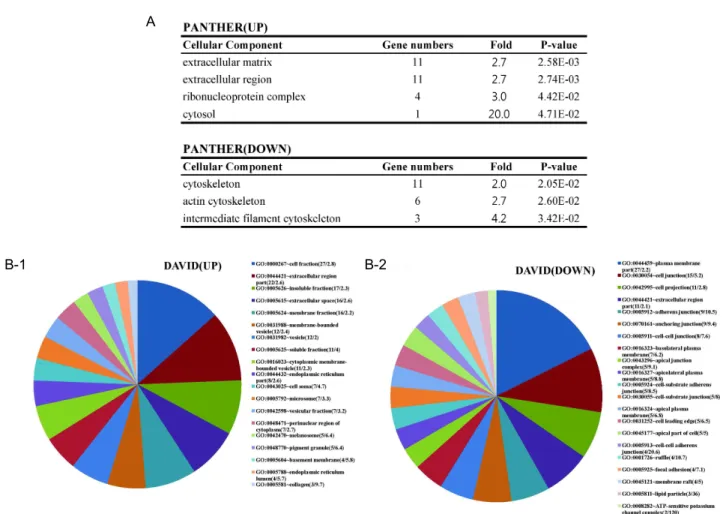
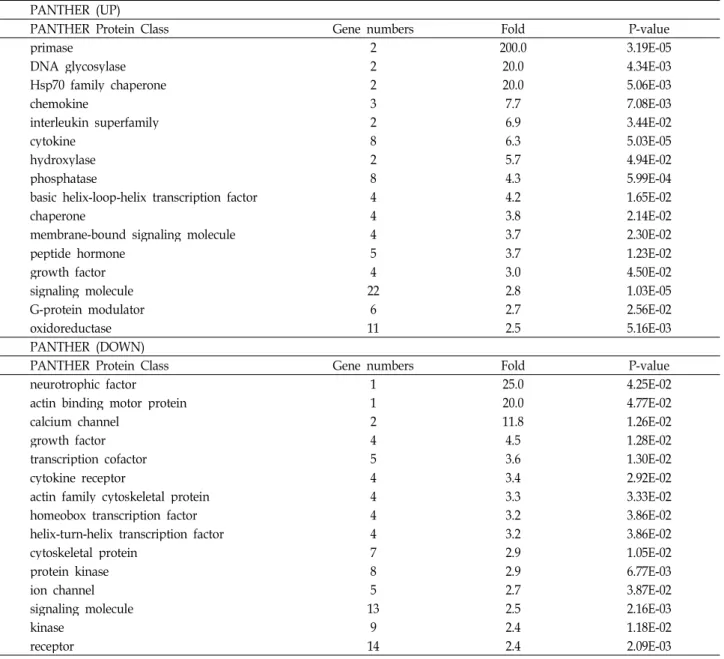
Cellular components and protein class of differentially expressed genes
Analysis results of cellular components showed that ex-
tracellular components were up-regulated, whereas cytoske-
letal (or intracellular) components were down-regulated
(Fig. 6A). In addition, collagen which is produced by fibro-
blast was most highly enriched (fold=9.7) molecule in
up-regulated group on DAVID analysis. It should be noted
that cell adhesion and junctional molecules were major cel-
lular component of down-regulated genes (Fig. 6B). Protein
classes of differentially regulated genes were consistent with
results from biological processes. Biological processes of
up-regulated genes showed that energy metabolic processes
such as lipid and carbohydrate transport, catalytic process
of tryptophan to acetyl-CoA, which are needed for cell pro-
A
B-1 B-2
Fig. 6. Cellular components of differentially expressed genes. (A) Cellular components of input genes obtained from PANTHER.
(B) Cellular components of input genes obtained from DAVID. The numbers in parenthesis indicate (gene numbers/fold enrichment). The area of individual slices of pie chart represents percentage of the genes belonging to the particular cellular component.
p
-values of all data are less than 0.05.liferation with DNA replication, were enriched and genes related to response to toxin were also increased (Fig. 4). In protein class, primase and DNA glycosylase, which are re- lated to DNA replication and repair, were up-regulated and Hsp70 family chaperon, mediator of response to toxin and stress, was also increased. Cytoskeletal proteins were de- creased in protein class (Table 2). This is same results from cellular components analysis.
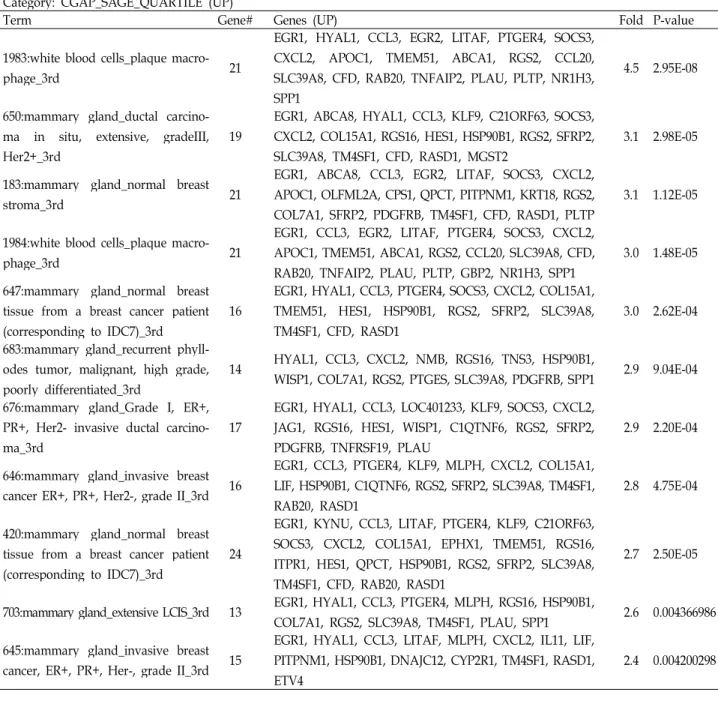
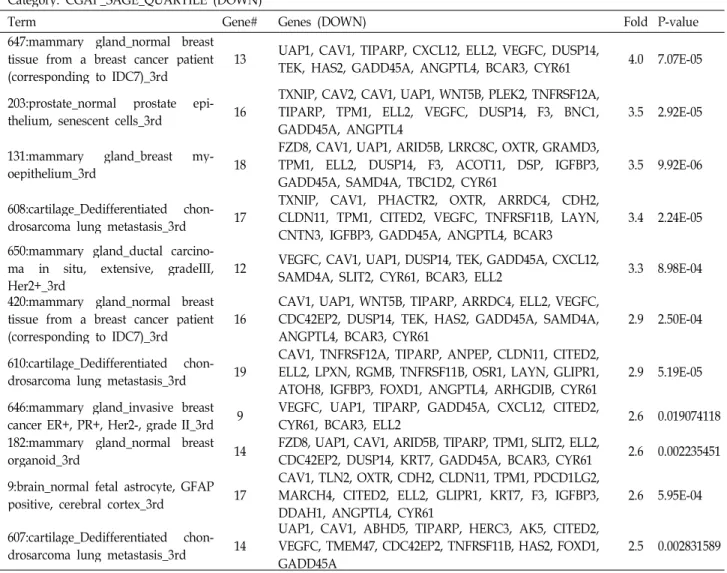
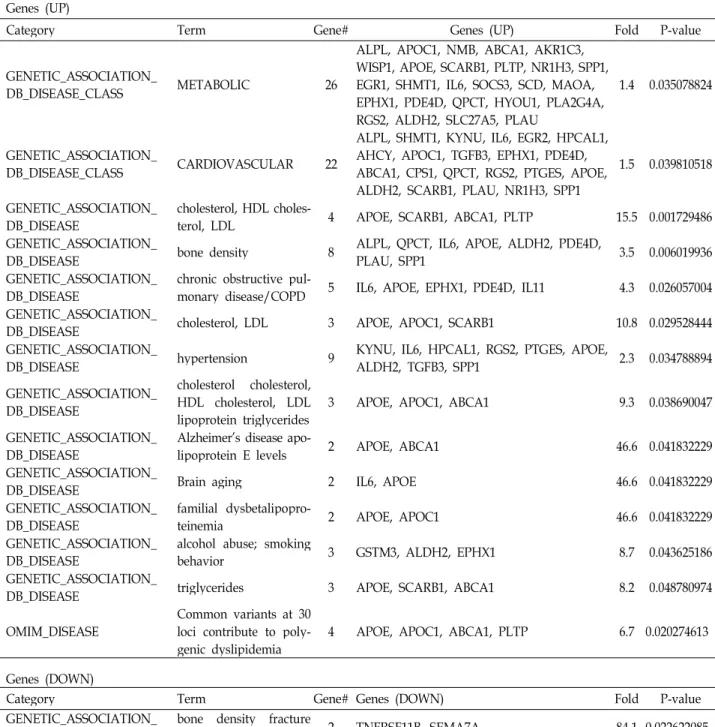
Tissue and disease related to differentially expressed genes
To determine which tissues are closely related to differ- entially regulated genes, we used Serial Analysis of Gene Expression (SAGE) of Cancer Genome Anatomy Project (CGAP) in National Cancer Institute (NCI) through DAVID.
SAGE displays the relative expression of a given gene in normal and malignant tissues of the human body.
Interestingly, normal breast tissues from breast cancer pa- tients were included in highly enriched terms in both up and down-regulated gene groups (Table 3). Diseases linked to the up-regulated gene group include dysfunction of cho- lesterol and lipid metabolism, brain aging, chronic ob- structive pulmonary disease (COPD) and cardiovascular disease. It is worthy of notice that only one disease category, bone density fracture risk, was acquired with very high fold enrichment in down-regulated gene group (Table 4).
Signal transduction pathway related to differentially expressed genes
Signal pathway of up-regulated genes included DNA rep-
lication, and important pathways for cell division and pu-
rine/pyrimidine production such as arginine and ser-
ine/glycine biosynthesis. Notch signaling pathway, which
is a critical signal cascade for cell-cell communication and
Table 2. Protein class of differentially regulated genes PANTHER (UP)
PANTHER Protein Class Gene numbers Fold P-value
primase 2 200.0 3.19E-05
DNA glycosylase 2 20.0 4.34E-03
Hsp70 family chaperone 2 20.0 5.06E-03
chemokine 3 7.7 7.08E-03
interleukin superfamily 2 6.9 3.44E-02
cytokine 8 6.3 5.03E-05
hydroxylase 2 5.7 4.94E-02
phosphatase 8 4.3 5.99E-04
basic helix-loop-helix transcription factor 4 4.2 1.65E-02
chaperone 4 3.8 2.14E-02
membrane-bound signaling molecule 4 3.7 2.30E-02
peptide hormone 5 3.7 1.23E-02
growth factor 4 3.0 4.50E-02
signaling molecule 22 2.8 1.03E-05
G-protein modulator 6 2.7 2.56E-02
oxidoreductase 11 2.5 5.16E-03
PANTHER (DOWN)
PANTHER Protein Class Gene numbers Fold P-value
neurotrophic factor 1 25.0 4.25E-02
actin binding motor protein 1 20.0 4.77E-02
calcium channel 2 11.8 1.26E-02
growth factor 4 4.5 1.28E-02
transcription cofactor 5 3.6 1.30E-02
cytokine receptor 4 3.4 2.92E-02
actin family cytoskeletal protein 4 3.3 3.33E-02
homeobox transcription factor 4 3.2 3.86E-02
helix-turn-helix transcription factor 4 3.2 3.86E-02
cytoskeletal protein 7 2.9 1.05E-02
protein kinase 8 2.9 6.77E-03
ion channel 5 2.7 3.87E-02
signaling molecule 13 2.5 2.16E-03
kinase 9 2.4 1.18E-02
receptor 14 2.4 2.09E-03
cancer cell progression, was most significantly enriched (p=4.44E-05) in un-regulated genes. Ligand of notch path- way, JAG1, and target genes of notch signal such as HEY1, HES6, HES1, and HEYL were simultaneously activated. In addition, tumor suppressor p53 pathway and TGF-β signal related genes, which are important regulator of apoptosis and cell cycle [4,7], were included in down-regulated gene group (Table 5).
Discussion
Cancer associated fibroblasts (CAF) are spindle shaped mesenchymal cell and one of the important components of
the cancer niche. CAF facilitates the growth and invasion of cancer cells by modulating tumor microenvironment via direct cell-cell contact or paracrine modulation. The origins of CAF are diverse including resident normal fibroblast, epi- thelial cell, MSCs, endothelial cell and pericyte [18,34,51].
Recently, MSCs have been reported as a critical source for
the cancer associated fibroblast [2]. However, molecular
mechanism underlying tumor supportive features of MSCs
are not well understood. In this study, we used microarray
and comparative gene expression analysis by a differential
clustering approach to investigate the influence of cancer
cells on phenotypic changes of MSCs leading promotion of
Table 3. Tissue expression of diffenretially expressed genes (Top 10 fold enrichment) Category: CGAP_SAGE_QUARTILE (UP)
Term Gene# Genes (UP) Fold P-value
1983:white blood cells_plaque macro-
phage_3rd 21
EGR1, HYAL1, CCL3, EGR2, LITAF, PTGER4, SOCS3, CXCL2, APOC1, TMEM51, ABCA1, RGS2, CCL20, SLC39A8, CFD, RAB20, TNFAIP2, PLAU, PLTP, NR1H3, SPP1
4.5 2.95E-08
650:mammary gland_ductal carcino- ma in situ, extensive, gradeIII, Her2+_3rd
19
EGR1, ABCA8, HYAL1, CCL3, KLF9, C21ORF63, SOCS3, CXCL2, COL15A1, RGS16, HES1, HSP90B1, RGS2, SFRP2, SLC39A8, TM4SF1, CFD, RASD1, MGST2
3.1 2.98E-05
183:mammary gland_normal breast
stroma_3rd 21
EGR1, ABCA8, CCL3, EGR2, LITAF, SOCS3, CXCL2, APOC1, OLFML2A, CPS1, QPCT, PITPNM1, KRT18, RGS2, COL7A1, SFRP2, PDGFRB, TM4SF1, CFD, RASD1, PLTP
3.1 1.12E-05
1984:white blood cells_plaque macro-
phage_3rd 21
EGR1, CCL3, EGR2, LITAF, PTGER4, SOCS3, CXCL2, APOC1, TMEM51, ABCA1, RGS2, CCL20, SLC39A8, CFD, RAB20, TNFAIP2, PLAU, PLTP, GBP2, NR1H3, SPP1
3.0 1.48E-05 647:mammary gland_normal breast
tissue from a breast cancer patient (corresponding to IDC7)_3rd
16
EGR1, HYAL1, CCL3, PTGER4, SOCS3, CXCL2, COL15A1, TMEM51, HES1, HSP90B1, RGS2, SFRP2, SLC39A8, TM4SF1, CFD, RASD1
3.0 2.62E-04 683:mammary gland_recurrent phyll-
odes tumor, malignant, high grade, poorly differentiated_3rd
14 HYAL1, CCL3, CXCL2, NMB, RGS16, TNS3, HSP90B1,
WISP1, COL7A1, RGS2, PTGES, SLC39A8, PDGFRB, SPP1 2.9 9.04E-04 676:mammary gland_Grade I, ER+,
PR+, Her2- invasive ductal carcino- ma_3rd
17
EGR1, HYAL1, CCL3, LOC401233, KLF9, SOCS3, CXCL2, JAG1, RGS16, HES1, WISP1, C1QTNF6, RGS2, SFRP2, PDGFRB, TNFRSF19, PLAU
2.9 2.20E-04
646:mammary gland_invasive breast cancer ER+, PR+, Her2-, grade II_3rd 16
EGR1, CCL3, PTGER4, KLF9, MLPH, CXCL2, COL15A1, LIF, HSP90B1, C1QTNF6, RGS2, SFRP2, SLC39A8, TM4SF1, RAB20, RASD1
2.8 4.75E-04
420:mammary gland_normal breast tissue from a breast cancer patient (corresponding to IDC7)_3rd
24
EGR1, KYNU, CCL3, LITAF, PTGER4, KLF9, C21ORF63, SOCS3, CXCL2, COL15A1, EPHX1, TMEM51, RGS16, ITPR1, HES1, QPCT, HSP90B1, RGS2, SFRP2, SLC39A8, TM4SF1, CFD, RAB20, RASD1
2.7 2.50E-05
703:mammary gland_extensive LCIS_3rd 13 EGR1, HYAL1, CCL3, PTGER4, MLPH, RGS16, HSP90B1,
COL7A1, RGS2, SLC39A8, TM4SF1, PLAU, SPP1 2.6 0.004366986 645:mammary gland_invasive breast
cancer, ER+, PR+, Her-, grade II_3rd 15
EGR1, HYAL1, CCL3, LITAF, MLPH, CXCL2, IL11, LIF, PITPNM1, HSP90B1, DNAJC12, CYP2R1, TM4SF1, RASD1, ETV4
2.4 0.004200298
malignancy. Differentially altered gene expression in ASCs
co-cultured with cancer cells compared to transcripts of ASCs cultured alone were analyzed in diverse aspects in- cluding biological process, molecular function, cellular com- ponent, protein class, tissue expression, disease, and signal pathway. Our data presented various potential evidences that cancer cells manipulated MSCs to accelerate the tumor progression. Highly up-regulated (>4-fold) genes in ASCs co-cultured with cancer cells included laminin (LAMA5) and collagen (COL4A5, COL15A1) (Table 1) which are important ECM components to constitute physical microenvironment
for cancer cell survival and progression [16,19,23,33].
Phenotypic and functional changes of ASCs to CAF-like cells
were shown in analysis data of differentially expressed
genes. The characteristics of fibroblast such as collagen pro-
duction, weakness of cell-cell adhesion, enrichment of ECM
structural components were obvious in expression profile of
ASCs co-cultured with cancer cells. In the same context, de-
crease of mesodermal lineage development and membrane
lipid raft formation, which is important for maintaining mul-
tipotency [25,28], in biological processes could be explained
by loss of stemness of ASCs undergoing phenotypic changes
Table 3. Continued
Category: CGAP_SAGE_QUARTILE (DOWN)
Term Gene# Genes (DOWN) Fold P-value
647:mammary gland_normal breast tissue from a breast cancer patient
(corresponding to IDC7)_3rd 13 UAP1, CAV1, TIPARP, CXCL12, ELL2, VEGFC, DUSP14,
TEK, HAS2, GADD45A, ANGPTL4, BCAR3, CYR61 4.0 7.07E-05 203:prostate_normal prostate epi-
thelium, senescent cells_3rd 16 TXNIP, CAV2, CAV1, UAP1, WNT5B, PLEK2, TNFRSF12A, TIPARP, TPM1, ELL2, VEGFC, DUSP14, F3, BNC1,
GADD45A, ANGPTL4 3.5 2.92E-05
131:mammary gland_breast my-
oepithelium_3rd 18 FZD8, CAV1, UAP1, ARID5B, LRRC8C, OXTR, GRAMD3, TPM1, ELL2, DUSP14, F3, ACOT11, DSP, IGFBP3,
GADD45A, SAMD4A, TBC1D2, CYR61 3.5 9.92E-06
608:cartilage_Dedifferentiated chon-
drosarcoma lung metastasis_3rd 17 TXNIP, CAV1, PHACTR2, OXTR, ARRDC4, CDH2, CLDN11, TPM1, CITED2, VEGFC, TNFRSF11B, LAYN,
CNTN3, IGFBP3, GADD45A, ANGPTL4, BCAR3 3.4 2.24E-05 650:mammary gland_ductal carcino-
ma in situ, extensive, gradeIII,
Her2+_3rd 12 VEGFC, CAV1, UAP1, DUSP14, TEK, GADD45A, CXCL12,
SAMD4A, SLIT2, CYR61, BCAR3, ELL2 3.3 8.98E-04 420:mammary gland_normal breast
tissue from a breast cancer patient
(corresponding to IDC7)_3rd 16 CAV1, UAP1, WNT5B, TIPARP, ARRDC4, ELL2, VEGFC, CDC42EP2, DUSP14, TEK, HAS2, GADD45A, SAMD4A,
ANGPTL4, BCAR3, CYR61 2.9 2.50E-04
610:cartilage_Dedifferentiated chon-
drosarcoma lung metastasis_3rd 19 CAV1, TNFRSF12A, TIPARP, ANPEP, CLDN11, CITED2, ELL2, LPXN, RGMB, TNFRSF11B, OSR1, LAYN, GLIPR1,
ATOH8, IGFBP3, FOXD1, ANGPTL4, ARHGDIB, CYR61 2.9 5.19E-05 646:mammary gland_invasive breast
cancer ER+, PR+, Her2-, grade II_3rd 9 VEGFC, UAP1, TIPARP, GADD45A, CXCL12, CITED2,
CYR61, BCAR3, ELL2 2.6 0.019074118
182:mammary gland_normal breast
organoid_3rd 14 FZD8, UAP1, CAV1, ARID5B, TIPARP, TPM1, SLIT2, ELL2,
CDC42EP2, DUSP14, KRT7, GADD45A, BCAR3, CYR61 2.6 0.002235451 9:brain_normal fetal astrocyte, GFAP
positive, cerebral cortex_3rd 17 CAV1, TLN2, OXTR, CDH2, CLDN11, TPM1, PDCD1LG2, MARCH4, CITED2, ELL2, GLIPR1, KRT7, F3, IGFBP3,
DDAH1, ANGPTL4, CYR61 2.6 5.95E-04
607:cartilage_Dedifferentiated chon-
drosarcoma lung metastasis_3rd 14 UAP1, CAV1, ABHD5, TIPARP, HERC3, AK5, CITED2, VEGFC, TMEM47, CDC42EP2, TNFRSF11B, HAS2, FOXD1,
GADD45A 2.5 0.002831589
to fibroblast. In addition, disease states related to up-regu- lated genes included COPD in which fibrosis of air way is important pathogenesis of shortness of breath (Table 4) [43].
Our data also showed that lipid and cholesterol metabo- lism were highly up-regulated in ASCs co-cultured with can- cer cells (Fig. 4). Disease states related to up-regulated genes also indicated that abnormal lipid metabolism was closely related to phenotypic changes of ASCs affected by cancer cells (Table 4). This means that fat metabolites are important energy source for cancer cell progression supported by sur- rounding MSCs. Actually, it had been reported that cancer cells mainly utilize fat derivatives for its survival, and lipid metabolism is up-regulated in cancer patient [27,41].
It has been reported that cancer cells increases surround- ing fibroblast proliferation and enhances invasive properties of carcinoma cells through integrin signal [39,44]. Our data
also included the up-regulation of collagens which are major
ligands for integrin signal, and enrichment of cell pro-
liferation related processes such as expression of CDC42, de-
crease of p53 and TGF-beta related pathway, increase of en-
ergy metabolism, DNA replication and repair, and biosyn-
thesis for cell division (Fig. 4, Table 2, 4, 5). In addition,
Dudley et al [12] and Patocs et al [36] reported that attenu-
ation of the tumor suppressor p53 in stromal cells of tumor
microenvironment contributes to lymph node metastases
and decreased sensitivity to chemotherapy. Furthermore,
loss of TGF-beta signal in prostate stroma was correlated
with carcinogenesis of prostate epithelium [14]. Notably,
notch pathway was most significantly enriched (p=4.44E-05)
in over-expressed gene group. This indicates that cancer cell
promotes cell-cell interaction with MSCs to manipulate and
utilize it [17]. Simultaneous activation of notch signaling li-
Table 4. Disease list related to differentially expressed genes Genes (UP)
Category Term Gene# Genes (UP) Fold P-value
GENETIC_ASSOCIATION_
DB_DISEASE_CLASS METABOLIC 26
ALPL, APOC1, NMB, ABCA1, AKR1C3, WISP1, APOE, SCARB1, PLTP, NR1H3, SPP1, EGR1, SHMT1, IL6, SOCS3, SCD, MAOA, EPHX1, PDE4D, QPCT, HYOU1, PLA2G4A, RGS2, ALDH2, SLC27A5, PLAU
1.4 0.035078824
GENETIC_ASSOCIATION_
DB_DISEASE_CLASS CARDIOVASCULAR 22
ALPL, SHMT1, KYNU, IL6, EGR2, HPCAL1, AHCY, APOC1, TGFB3, EPHX1, PDE4D, ABCA1, CPS1, QPCT, RGS2, PTGES, APOE, ALDH2, SCARB1, PLAU, NR1H3, SPP1
1.5 0.039810518
GENETIC_ASSOCIATION_
DB_DISEASE cholesterol, HDL choles-
terol, LDL 4 APOE, SCARB1, ABCA1, PLTP 15.5 0.001729486
GENETIC_ASSOCIATION_
DB_DISEASE bone density 8 ALPL, QPCT, IL6, APOE, ALDH2, PDE4D,
PLAU, SPP1 3.5 0.006019936
GENETIC_ASSOCIATION_
DB_DISEASE chronic obstructive pul-
monary disease/COPD 5 IL6, APOE, EPHX1, PDE4D, IL11 4.3 0.026057004 GENETIC_ASSOCIATION_
DB_DISEASE cholesterol, LDL 3 APOE, APOC1, SCARB1 10.8 0.029528444
GENETIC_ASSOCIATION_
DB_DISEASE hypertension 9 KYNU, IL6, HPCAL1, RGS2, PTGES, APOE,
ALDH2, TGFB3, SPP1 2.3 0.034788894
GENETIC_ASSOCIATION_
DB_DISEASE
cholesterol cholesterol, HDL cholesterol, LDL
lipoprotein triglycerides 3 APOE, APOC1, ABCA1 9.3 0.038690047 GENETIC_ASSOCIATION_
DB_DISEASE Alzheimer's disease apo-
lipoprotein E levels 2 APOE, ABCA1 46.6 0.041832229
GENETIC_ASSOCIATION_
DB_DISEASE Brain aging 2 IL6, APOE 46.6 0.041832229
GENETIC_ASSOCIATION_
DB_DISEASE familial dysbetalipopro-
teinemia 2 APOE, APOC1 46.6 0.041832229
GENETIC_ASSOCIATION_
DB_DISEASE alcohol abuse; smoking
behavior 3 GSTM3, ALDH2, EPHX1 8.7 0.043625186
GENETIC_ASSOCIATION_
DB_DISEASE triglycerides 3 APOE, SCARB1, ABCA1 8.2 0.048780974
OMIM_DISEASE Common variants at 30 loci contribute to poly-
genic dyslipidemia 4 APOE, APOC1, ABCA1, PLTP 6.7 0.020274613 Genes (DOWN)
Category Term Gene# Genes (DOWN) Fold P-value
GENETIC_ASSOCIATION_
DB_DISEASE bone density fracture
risk 2 TNFRSF11B, SEMA7A 84.1 0.022622085
gand, JAG1 and downstream target genes including HEY1, HES6, HES1 and, HEYL implied that the autocrine activation of notch pathway in MSCs were as important as its paracrine effects to cancer cells for tumor supportive function of MSCs (Table 5).
Immune cells have been considered as key regulator of tumor microenvironment. Especially, tumor associated mac- rophage (TAM) and regulatory T-cells are critical because
they support tumor progression by regulating immune re-
sponse, inflammation, angiogenesis, and cancer invasion
[9,50]. Our data showed that ASCs regulated by cancer cells
express macrophage activation related genes and TGF-β
(Fig. 4, Table 1). TGF-β signaling related genes such as
RRAS2, FOXD1, and CITED2 [5,8,13] were decreased in
ASCs but expression of TGF-β itself was increased more
than 7-fold on average in our data and this might affect the
Table 5. Signal pathway of differentially expressed genes PANTHER (UP)
Pathway Gene# Gene (UP) Fold P-value
Arginine biosynthesis 2 ASS, CPS1 33.3 1.97E-03
Phenylethylamine degradation 2 ALDH2, MAOA 25.0 3.04E-03
Serine glycine biosynthesis 1 SHMT1 25.0 3.94E-02
Notch signaling pathway 5 JAG1,HEY1,HES6,HES1,HEYL 13.2 4.44E-05
5-Hydroxytryptamine degredation 2 ALDH2, MAOA 12.5 1.16E-02
DNA replication 2 PRIM1, SPP1 11.8 1.27E-02
Adrenaline and noradrenaline biosynthesis 2 MAOA, SLC6A15 7.7 2.78E-02
Inflammation mediated by chemokine and cyto-
kine signaling pathway 8 ITPR1,PLA2G4A 3.5 2.21E-03
Integrin signalling pathway 5 HSD17B8, COL15A1, COL4A5, COL7A1, CPS1 3.4 1.60E-02 Heterotrimeric G-protein signaling pathway-Gi al-
pha and Gs alpha mediated pathway 4 PYGL, RGS2, PHKA1, RGS16 3.0 4.58E-02
PANTHER (DOWN)
Pathway Gene# Gene (DOWN) Fold P-value
Axon guidance mediated by Slit/Robo 2 CXCL12, SLIT2 18.2 5.43E-03
Blood coagulation 2 F3, SERPINB2 7.7 2.84E-02
Cadherin signaling pathway 6 CAV2, PCDH18, FZD8, EGFR, WNT5B, CDH2 7.5 1.63E-04
Angiogenesis 7 CAV2, F3, FZD8, EPHB1, TEK, LPXN, WNT5B 6.7 8.95E-05
p53 pathway 3 TMEM47, GADD45A, IGFBP3 4.9 2.40E-02
Alzheimer disease-presenilin pathway 3 CAV2, FZD8, WNT5B 4.5 2.92E-02
TGF-beta signaling pathway 3 RRAS2, FOXD1, CITED2 3.8 4.49E-02
Wnt signaling pathway 6 CAV2, PCDH18, FZD8, WNT5B, DKK1, CDH2 3.5 7.85E-03
TGF-β signal of surrounding cells of ASCs. TGF-β converts effector T-cells, which attack cancer, into regulatory T-cells, which suppress the inflammatory reaction and favor tumor growth [6,47,49]. Interestingly, angiogenesis were enriched in both up and down-regulated gene groups. This result was consistence with our previous report in which vessel devel- opment of tumor cells co-injected with ASCs to nude mice was not different from those of tumor cells injected alone [52].
Bone fracture risk was the only proposed disease linked to down-regulated genes (Table 4). Osteoclast, which is key cell types dissolving bone matrix and decreasing bone den- sity, is activated by IL-6 potently, which is also up-regulated cytokine in myeloma and oral cancer niche [15,20,40]. IL-6 is a protumorigenic molecule which promotes cancer surviv- al by up-regulating survival related genes and confers tumor cells resistance to chemotherapeutic agents [11,24,30]. IL-6 was increased more than 7-fold on average in our data (Table 1). Lastly, analysis result of tissue expression showed that none-cancerous tissues surrounding breast cancer were highly enriched tissue types in both up and down-regulated gene groups (Table 3). This information further supported the possibility that features of MSCs co-cultured with cancer
cells are closely similar to cancer associated fibroblast.
Recently, the significance of targeting CAFs in cancer ther- apy has been increasingly emphasized in many reports [29,32].
In conclusion, our comparative expression data analysis show that cancer cells change the behavior of MSCs into cancer supportive cells by affecting its energy metabolism, stemness, cellular structure components, proliferation and secretory function in variety levels. Our understanding from this study could not only be applied to CAFs targeting can- cer therapy but also improve safety of MSCs utilizing cancer treatment and regenerative medicine.
Acknowledgement
This work was supported for two years by 2009 Pusan National University Research Grant.
References
1. Alhadlaq, A. and J. J. Mao. 2004. Mesenchymal stem cells:
isolation and therapeutics.
Stem Cell Dev
. 13, 436-448.2. Bagley, R. G., W. Weber, C. Rouleau, M. Yao, N. Honma, S. Kataoka, I. Ishida, B. L. Roberts, and B. A. Teicher. 2009.
Human mesenchymal stem cells from bone marrow express tumor endothelial and stromal markers.
Int. J. Oncol
. 34, 619-627.3. Bergfeld, S. A. and Y. A. DeClerck. 2010. Bone marrow-de- rived mesenchymal stem cells and the tumor microenvironment
. Cancer Metastasis Rev
. 29, 249-261.4. Blobe, G. C., P. S. William, and H. F. Lodish. 2002. Role of Transforming Growth Factor β in Human Disease.
N.
Engl. J. Med.
342, 1350-1358.5. Casas-Tinto, S., M. Gomez-Velazquez, B. Granadino, and P.
Fernandez-Funez. 2008. FoxK mediates TGF-beta signalling during midgut differentiation in flies.
J. Cell Biol
. 183, 1049-1060.6. Chen, W., W. Jin, N. Hardegen, K. J. Lei, L. Li, N. Marinos, G. McGrady, and S. M. Wahl. 2003. Conversion of periph- eral CD4+CD25- naive T cells to CD4+CD25+ regulatory T cells by TGF-beta induction of transcription factor Foxp3.
J. Exp. Med.
198, 1875-1886.7. Chiarugi, V., L. Magnelli, and M. Cinelli. 1997. Complex in- terplay among apoptosis factors: RB, p53, E2F, TGF-beta, cell cycle inhibitors and the bcl2 gene family.
Pharmacol. Res.
35, 257-261.
8. Chou, Y. T., H. Wang, Y. Chen, D. Danielpour, and Y. C.
Yang. 2006. Cited2 modulates TGF-beta-mediated upregula- tion of MMP9.
Oncogene
25, 5547-5560.9. Colombo, M. P. and S. Piconese. 2007. Regulatory-T-cell in- hibition versus depletion: the right choice in cancer immunotherapy.
Nat. Rev. Cancer
7, 880-887.10. Dennis, J. E. and P. Charbord. 2002. Origin and differ- entiation of human and murine stroma.
Stem Cells
20, 205-214.11. Dreuw, A., H. M. Hermanns, R. Heise, S. Joussen, F.
Rodríguez, Y. Marquardt, F. Jugert, H. F. Merk, P. C.
Heinrich, and J. M. Baron. 2005. Interleukin-6-type cytokines upregulate expression of multidrug resistance-associated proteins in NHEK and dermal fibroblasts.
J. Invest. Dermatol.
124, 28-37.
12. Dudley, A. C., S. C. Shih, A. R. Cliffe, K. Hida, and M.
Klagsbrun. 2008. Attenuated p53 activation in tumour-asso- ciated stromal cells accompanies decreased sensitivity to etoposide and vincristine.
Br. J. Cancer
99, 118-125.13. Erdogan, M., A. Pozzi, N. Bhowmick, H. L. Moses, and R.
Zent. 2008. Transforming growth factor-beta (TGF-beta) and TGF-beta-associated kinase 1 are required for R-Ras-medi- ated transformation of mammary epithelial cells.
Cancer Res.
68, 6224-6231.
14. Franco, O. E., M. Jiang, D. W. Strand, J. Peacock, S.
Fernandez, R. S. Jackson 2nd, M. P. Revelo, N. A.
Bhowmick, and S. W. Hayward. 2011. Altered TGF-{beta}
Signaling in a Subpopulation of Human Stromal Cells Promotes Prostatic Carcinogenesis.
Cancer Res.
[Epub ahead of print]15. Gerlo, S., G. Haegeman, and W. Vanden Berghe. 2008.
Transcriptional regulation of autocrine IL-6 expression in multiple myeloma cells.
Cell Signal.
20, 1489-1496.16. Giannelli, G. and S. Antonaci. 2000. Biological and clinical
relevance of Laminin-5 in cancer.
Clin. Exp. Metastasis.
18, 439-443.17. Guo, S., M. Liu, and R. R. Gonzalez-Perez. 2010. Role of Notch and its oncogenic signaling crosstalk in breast cancer.
Biochim. Biophys. Acta
. 1815, 197-213.18. Huang, da. W., B. T. Sherman, and R. A. Lempicki. 2009.
Systematic and integrative analysis of large gene lists using DAVID bioinformatics resources.
Nat. Protoc.
4, 44-57.19. Imamura, T., T. Manabe, G. Ohshio, Z. H. Wang, K. Yamaki, T. Yoshimura, H. Suwa, and M. Imamura. 1995.
Immunohistochemical staining for type IV collagen and laminin in the stroma of human pancreatic cancer.
Int. J.
Pancreatol.
18, 95-99.20. Kayamori, K., K. Sakamoto, T. Nakashima, H. Takayanagi, K. Morita, K. Omura, S. T. Nguyen, Y. Miki, T. Iimura, A.
Himeno, T. Akashi, H. Yamada-Okabe, E. Ogata, and A.
Yamaguchi. 2010. Roles of interleukin-6 and parathyroid hormone-related peptide in osteoclast formation associated with oral cancers: significance of interleukin-6 synthesized by stromal cells in response to cancer cells.
Am. J. Pathol.
176, 968-980.
21. Kebriaei, P. and S. Robinson. 2011. Treatment of graft-ver- sus-host-disease with mesenchymal stromal cells.
Cytotherapy
[Epub ahead of print].22. Khakoo, A. Y., S. Pati, S. A. Anderson, W. Reid, M. F. Elshal, I. I. Rovira, A. T. Nguyen, D. Malide, C. A. Combs, G. Hall, J. Zhang, M. Raffeld, T. B. Rogers, W. Stetler-Stevenson, J.
A. Frank, M. Reitz, and T. Finkel. 2006. Human mesen- chymal stem cells exert potent antitumorigenic effects in a model of Kaposi's sarcoma.
J. Exp. Med.
203, 1235-1247.23. Kim, B. G., H. J. An, S. Kang, Y. P. Choi, M. Q. Gao, H.
Park, and N. H. Cho. 2011. Laminin-332-rich tumor micro- environment for tumor invasion in the interface zone of breast cancer.
Am. J. Pathol.
178, 373-381.24. Lee, G. and M. Piquette-Miller. 2001. Influence of IL-6 on MDR and MRP-mediated multidrug resistance in human hepatoma cells.
Can. J. Physiol. Pharmacol.
79, 876-884.25. Lee, M. Y., J. M. Ryu, S. H. Lee, J. H. Park, and H. J. Han.
2010. Lipid rafts play an important role for maintenance of embryonic stem cell self-renewal
. J. Lipid Res.
51, 2082-2089.26. Lee, R. H., B. Kim, I. Choi, H. Kim, H. S. Choi, K. T. Suh, Y. C. Bae, and J. S. Jung. 2004. Characterization and ex- pression analysis of mesenchymal stem cells from human bone marrow and adipose tissue.
Cell. Physiol. Biochem.
14, 311-324.27. Legaspi, A., M. Jeevanandam, H. F. Starnes Jr, and M. F.
Brennan. 1987. Whole body lipid and energy metabolism in the cancer patient.
Metabolism
36, 958-963.28. Liu, Z. J., Y. Zhuge, and O. C. Velazquez. 2009. Trafficking and differentiation of mesenchymal stem cells.
J. Cell Biochem.
106, 984-991.29. Loeffler, M., J. A. Krüger, A. G. Niethammer, and R. A.
Reisfeld. 2006. Targeting tumor-associated fibroblasts im- proves cancer chemotherapy by increasing intratumoral drug uptake.
J. Clin. Invest.
116, 1955-1962.30. Löffler, D., K. Brocke-Heidrich, G. Pfeifer, C. Stocsits, J.
Hackermüller, A. K. Kretzschmar, R. Burger, M. Gramatzki, C. Blumert, K. Bauer, H. Cvijic, A. K. Ullmann, P. F. Stadler, and F. Horn. 2007. Interleukin-6 dependent survival of mul- tiple myeloma cells involves the Stat3-mediated induction of microRNA-21 through a highly conserved enhancer.
Blood
110, 1330-1333.31. Mi, H., Q. Dong, A. Muruganujan, P. Gaudet, S. Lewis, and P. D. Thomas. 2010. PANTHER version 7: improved phylo- genetic trees, orthologs and collaboration with the Gene Ontology Consortium.
Nucleic Acids Res.
38, D204-210.32. Micke, P. and A. Ostman. 2005. Exploring the tumour envi- ronment: cancer-associated fibroblasts as targets in cancer therapy.
Expert. Opin. Ther. Targets
9, 1217-1233.33. Ohlund, D., C. Lundin, B. Ardnor, M. Oman, P. Naredi, and M. Sund. 2009. Type IV collagen is a tumour stro- ma-derived biomarker for pancreas cancer.
Br. J. Cancer
101, 91-97.34. Orimo, A. and R. A. Weinberg. 2006. Stromal fibroblasts in cancer: a novel tumor-promoting cell type.
Cell Cycle
5, 1597-1601.35. Ostman, A. and M. Augsten. 2009. Cancer-associated fibro- blasts and tumor growth--bystanders turning into key players.
Curr. Opin. Genet. Dev.
19, 67-73.36. Patocs, A., L. Zhang, Y. Xu, F. Weber, T. Caldes, G. L.
Mutter, P. Platzer, and C. Eng. 2007. Breast-cancer stromal cells with TP53 mutations and nodal metastases.
N. Engl.
J. Med.
357, 2543-2551.37. Picinich, S. C., P. J. Mishra, P. J. Mishra, J. Glod, and D.
Banerjee. 2007. The therapeutic potential of mesenchymal stem cells. Cell- & tissue-based therapy.
Expert. Opin. Biol.
Ther
. 7, 965-973.38. Pittenger, M. F., A. M. Mackay, S. C. Beck, R. K. Jaiswal, R. Douglas, J. D. Mosca, M. A. Moorman, D. W. Simonetti, S. Craig, and D. R. Marshak. 1999. Multilineage potential of adult human mesenchymal stem cells
. Science
284, 143-147.39. Rathinam, R. and S. K. Alahari. 2010. Important role of in- tegrins in the cancer biology.
Cancer Metastasis Rev
. 29, 223-237.40. Rozen, N., S. Ish-Shalom, A. Rachmiel, H. Stein, and D.
Lewinson. 2000. Interleukin-6 modulates trabecular and en- dochondral bone turnover in the nude mouse by stimulat- ing osteoclast differentiation.
Bone
26, 469-474.41. Russell, S. T. and M. J. Tisdale. 2002. Effect of a tu- mour-derived lipid-mobilising factor on glucose and lipid metabolism
in vivo. Br. J. Cancer
87, 580-584.42. Safford, K. M., K. C. Hicok, S. D. Safford, Y. D. Halvorsen, W. O. Wilkison, J. M. Gimble, and H. E. Rice. 2002.
Neurogenic differentiation of murine and human adi- pose-derived stromal cells.
Biochem. Biophys. Res. Commun.
294, 371-379.
43. Salazar, L. M. and A. M. Herrera. 2011. Fibrotic response of tissue remodeling in COPD.
Lung
[Epub ahead of print].44. Semba, S., Y. Kodama, K. Ohnuma, E. Mizuuchi, R. Masuda, M. Yashiro, K. Hirakawa, and H. Yokozaki. 2009. Direct can- cer-stromal interaction increases fibroblast proliferation and enhances invasive properties of scirrhous-type gastric carci- noma cells.
Br. J. Cancer
101, 1365-1373.45. Studeny, M., F. C. Marini, J. L. Dembinski, C. Zompetta, M. Cabreira-Hansen, B. N. Bekele, R. E. Champlin, and M.
Andreeff. 2004. Mesenchymal stem cells: potential pre- cursors for tumor stroma and targeted-delivery vehicles for anticancer agents.
J. Natl. Cancer Inst.
96, 1593-1603.46. Studeny, M., F. C. Marini, R. E. Champlin, C. Zompetta, I. J. Fidler, and M. Andreeff. 2002. Bone marrow-derived mesenchymal stem cells as vehicles for interferon-beta deliv- ery into tumors.
Cancer Res.
62, 3603-3608.47. Thomas, D. A. and J. Massagué. 2005. TGF-beta directly tar- gets cytotoxic T cell functions during tumor evasion of im- mune surveillance.
Cancer Cell
8, 369-380.48. Valtieri, M. and A. Sorrentino. 2008. The mesenchymal stro- mal cell contribution to homeostasis.
J. Cell Physiol.
217, 296-300.49. Wahl, S. M. and W. Chen. 2005. Transforming growth fac- tor-beta-induced regulatory T cells referee inflammatory and autoimmune diseases.
Arthritis Res. Ther.
7, 62-68.50. Weigert, A., D. Sekar, and B. Brüne. 2009. Tumor-associated macrophages as targets for tumor immunotherapy.
Immunotherapy
1, 83-95.51. Xing, F., J. Saidou, and K. Watabe. 2010. Cancer associated fibroblasts (CAFs) in tumor microenvironment.
Front Biosci.
15, 166-179.
52. Yu, J. M., E. S. Jun, Y. C. Bae, and J. S. Jung. 2008.
Mesenchymal stem cells derived from human adipose tis- sues favor tumor cell growth