Printed in the Republic of Korea
https://doi.org/10.5012/jkcs.2018.62.4.328
Notes
Photo-Control of Adsorption of Dye Metal Complexes Incorporating Chiral Schiff Base Ligands Containing Azo-Groups on TiO
2Shinnosuke Tanaka†, Hiroki Sato†, Yota Ishida†, Yanyang Deng†, Tomoyuki Haraguchi†, Takashiro Akitsu†,*, Mutsumi Sugiyama‡, Michikazu Hara§, and Dohyun Moon#,*
†Department of Chemistry, Faculty of Science, Tokyo University of Science, Tokyo, Japan.
*E-mail: [email protected]
‡Department of Electrical Engineering, Faculty of Science and Technology, Tokyo University of Science, Chiba, Japan
§Materials and Structures Laboratory, Tokyo Institute of Technology, Kanagawa, Japan
#Beamline Department, Pohang Accelerator Laboratory, Korea (Received March 19, 2018; Accepted June 20, 2018) Key words: Schiff base, Azobenzene, Chirality, DFT, Crystal structure
INTRODUCTION
Dye sensitized solar cells (DSSC) are attracting much attention as devices replacing silicon type solar cells.1−4 Particularly, conversion efficiency of some ruthenium dyes exceeds 10%, which may be quite expensive but effec- tive dye. Therefore, in recent years, many researches focused on low cost dyes composed of the first transition metals and suitable organic ligands.5−8
Azobenzene has long π-conjugated system and is widely known as a molecule that causes cis-trans photoisomer- ization by light. Azobenzene has also liquid crystallinity, and orientation of molecules can be aligned anisotropi- cally by irradiating polarized light.9−11 We have also stud- ied on chiral salen-type metal complexes as dye12−14 using the following merits: (1) High stability of the complex due to chelating effect, (2) Structural diversity by introducing substituents, and (3) Catalytic action of asymmetric syn- thesis and redox reaction. However, salen-type complex has a disadvantage that the absorbance is small and the absorp- tion wavelength region is the ultraviolet part.15
In this study, by introducing an azobenzene moiety into
salen-type complexes (Fig. 1), we expected increase of absorbance, long wavelength shifts of absorption bands, and their changes (control) by light irradiation. Interestingly, we discovered novel effect to increase and change in adsorp- tion amount of dye complexes onto TiO2 surface by polar- ized UV light irradiation.
EXPERIMENTAL
Materials and Synthesis
To a methanol solution (15 mL) of 4,4'-((1S,2S)-1,2-diam- inoethane-1,2-diyl) dibenzoate (0.072 g, 0.25 mmol),16 meth- anol solution (15 mL) of potassium hydroxide (0.014 g, 0.25 mmol) and 2-hydroxy-5-(phenyldiazenyl) benzalde- hyde (0.1132 g, 0.5 mmol)17 was added dropwise, and the resultant mixture was stirred at 313 K for 3 h. Then iron(II) sulfate heptahydrate (0.070 g, 0.25 mmol) was added, and the solution was stirred for 3 h. After the reaction and fil- tration, the filtrate was concentrated under reduced pres- sure, to obtain a black brown solid. This crude solid was washed with methanol and n-hexane to give rise to the Fe- L complex. Synthesis of other metal complexes were car- ried out in almost similar way instead of the corresponding metal sources (copper(II) acetate monohydrate or bihy- drate).
Fe-L: Yield 0.156 g (80.9 %). Anal. Found: C, 57.14; H, 3.38; N, 9.16%. Calcd. for C42H30N6O8K2Fe: C, 57.14; H, 3.65; N, 9.52%. IR (KBr, cm-1) 536 (m), 656 (w), 688 (w), 769 (w), 849 (w), 1018 (w), 1114 (m), 1223 (w), 1301 (m), 1378 (m), 1421 (w), 1536 (w), 1606 (s, C=N), 1721 (m, C=O), 2342 (w), 2359 (w), 2951 (w), 3434 (br, s, -OH). μeff=4.86 B.M. at 300 K (theoretical value high spin d6 is 4.90 B.M.) Figure 1. Chemical structures of complexes (M(II)=Fe(II), Cu(II),
and Zn(II) for Fe-L, Cu-L and Zn-L, respectively).
(w), 786 (w), 1017 (w), 1112 (w), 1307 (w), 1385 (m), 1413 (w), 1548 (m), 1630 (s, C=N), 1721 (w, C=O), 2339 (w), 2966 (w), 3445 (br, s).
Physical Measurements and Computational Method Elemental analyses (C, H and N) were performed using a Perkin-Elmer 2400 II CHNS/O analyzer at the Tokyo University of Science. Infrared (IR) spectra were recorded as KBr pellets on a JASCO FT-IR 4200 plus spectrophotometer in the range 4000–400 cm−1 at 298 K. Electronic (UV-vis) spectra were obtained on a JASCO V-570 UV–vis–NIR spectrophotometer in the range 1500–200 nm at 298 K.
Circular dichroism (CD) spectra were obtained on a JASCO J-820 spectropolarimeter in the range 900–250 nm at 298 K.
Fluorescence spectra were recorded on a JASCO FP-6200 spectrophotometer at 298 K. Electrochemical (cyclic voltammetry, CV) measurements were carried out on a BAS SEC2000- UV/VIS and ALS2323 system with Ag/AgCl electrodes range of -0.50–0.80 V vs. Ag/Ag+. The conversion efficiency as DSSC cell was determined from J–V curves obtained under air mass 1.5 conditions at an illumination of 100 mW/cm2 using an ADCMT 6241A DC voltage/current source/monitor according to the literature procedures.12 The magnetic properties were investigated using a Quantum Design MPMS-XL superconducting quantum interference device (SQUID) magnetometer at an applied field of 1.0 T in the temperature range of 5-300 K. XPS measurement was carried out using Mg Kα source (10 kV, 25 mA) on a SHIMADZU ESCA3400.
Powder X-ray diffraction patterns of Fe-L and Cu-L were collected at 298 K with a Rigaku Smart Lab using Cu Kα source at the University of Tokyo and Pohang Light Source II 2D Supramolecular Crystallography Beamline (PLSII-2D-SMC), respectively. Powder of Cu-L was packed in the 0.5 mm diameter (wall thickness is 0.01 mm) capillary and the diffraction data measured transparency as Debye- Scherrer at 298 K respectively, with the 100 mm of detector distance in 10 sec exposures with synchrotron radiation (λ
= 1.20007 Å) on an ADSC Quantum-210 detector at 2D SMC with a silicon (111) double crystal monochromator (DCM) at the Pohang Accelerator Laboratory, Korea. The
PAL BL2D-SMDC program18 was used for data collection, and Fit2D program19 was used converted 2D to 1D pattern and wavelength and detector distance refinement. Rietveld analysis20 was carried out with a Rigaku PDXL2 ver.2.2.1.0, commercially available program package by the following procedures: indexing, cell and space group determination, input composition and initial structural model from DFT, direct space method, addition of displacement parameters for non-hydrogen atoms, and refinement with hydrogen atoms under restraint (Fig. S1).
Crystallographic data (Table 1) of Fe-L and Cu-L have been deposited with the Cambridge Crystallographic Data Center as CCDC 1824200 and 1824206, respectively. These data can be obtained free of charge from the Cambridge Crystallographic Data Center via www.ccdc.cam.ac.uk/
data_request/cif.
Calculations of all complexes were performed using the Gaussian 09W software Revision D.02 (Gaussian, Inc.).21 The gas phase geometry optimizations were carried out using TD-DFT with B3LYP functional. The vertical exci- tation energy was calculated with the Lanl2dz for Fe, Cu and Zn with the 6-31+G(d) basis set for H, C, N and O method based on the singlet ground state geometry.
RESULTS AND DISCUSSION
Crystal Structures
Fe-L crystalizes in Triclinic, space group P1 with Z = 1.
b / Å 14.66(2) 13.21(3)
c / Å 11.71(3) 12.18(2)
α / ° 94.18(14) 103.12(11)
β / ° 107.1(2) 114.10(6)
γ / ° 86.35(18) 81.04(9)
V/(Å3) 1787(6) 1181(6)
Z 1 1
D/gcm−3 0.750 0.719
F (000) 418 421
S 3.8307 1.3637
Rwp (%) 4.93 1.04
As shown in Fig. 2 and Table 2, Fe-L affords a six-coor- dinated octahedral cis-[FeN2O4] coordination geometry with two axial water ligands, which is in agreement with the expected value of magnetic moment. For the chelate ligand, Fe1-O1, Fe1-O3, Fe1-N1, Fe1-N3 bond distances are ranging from 2.008 to 2.221 Å, while axial Fe1-O5 and Fe1-O8 bond distances are 2.221 and 2.103 Å, respectively.
The chiral amine moiety adopts a λ configuration with tor- sion angle of C18-C10-C11-C12 = 64.01°.
Cu-L crystalizes in Triclinic, space group P1 with Z = 1.
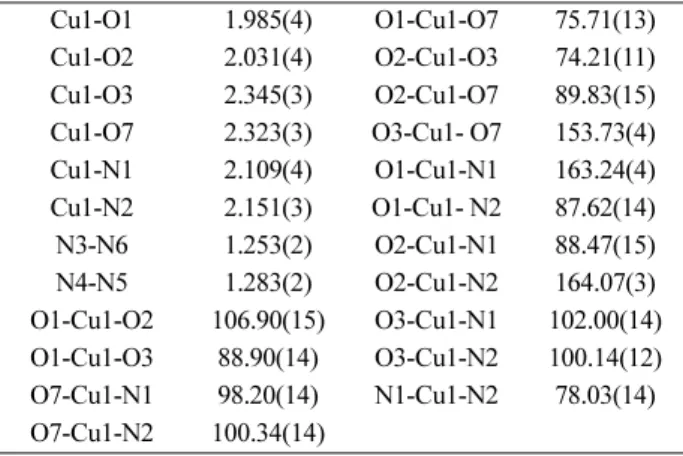
As shown in Fig. 3 and Table 3, Cu-L affords a six-coor- dinated elongated octahedral cis-[CuN2O4] coordination geometry with two axial water ligands. For the chelate ligand, Cu1-O1, Cu1-O3, Cu1-N1, Cu1-N3 bond distances are ranging from 1.985 to 2.151 Å, while axial Cu1-O3 and Cu1- O7 bond distances are 2.345 and 2.323 Å, respectively, which is expected due to Jahn-Teller distortion commonly.
The chiral amine moiety adopts a λ configuration with tor- sion angle of C12-C11-C10-C18 = 61.07°. For both com- plexes, the other geometrical parameters are within a common range of the related compounds.12−15 Due to low crystal- linity, Zn-L could not be analyzed, though it may be also
expected to be similar structures to Fe-L or Cu-L. Both complexes are aligned along the c axis without charac- teristic interactions (Fig. S2).
UV-vis and Fluorescence Spectra
The UV-vis spectra (Fig. 4) appeared intense π-π*
Figure 2. Molecular structures of Fe-L.2H2O showing selected atom labeling scheme. Hydrogen atoms and crystalline water are omitted for clarity.
Table 2. Selected bond lengths [Å] and angles [°] for Fe-L.2H2O
Fe1-O1 2.149(5) O1-Fe1-O8 99.5(2)
Fe1-O3 2.008(5) O1-Fe1-N1 164.34(5)
Fe1-O5 2.430(5) O1-Fe1-N3 88.8(2)
Fe1-O8 2.327(5) O3-Fe1-N3 161.57(7) Fe1-N1 2.221(5) O5-Fe1-O8 153.89(3) Fe1-N3 2.103(5) O8-Fe1-N1 91.04(19) N2-N4 1.258(3) O5-Fe1-N1 109.57(2)
N5-N6 1.352(3) O5-Fe1-N3 98.68(5)
O1-Fe1-O3 108.4(2) O8-Fe1-N3 101.32(19) O3-Fe1-O8 70.11(19) O3-Fe1-N1 86.0(2) N1-Fe1-N3 77.7(2)
Figure 3. Molecular structures of Cu-L.2H2O showing selected atom labeling scheme. Hydrogen atoms and crystalline water are omitted for clarity.
Table 3. Selected bond lengths [Å] and angles [°] for Cu-L.2H2O Cu1-O1 1.985(4) O1-Cu1-O7 75.71(13) Cu1-O2 2.031(4) O2-Cu1-O3 74.21(11) Cu1-O3 2.345(3) O2-Cu1-O7 89.83(15) Cu1-O7 2.323(3) O3-Cu1- O7 153.73(4) Cu1-N1 2.109(4) O1-Cu1-N1 163.24(4) Cu1-N2 2.151(3) O1-Cu1- N2 87.62(14) N3-N6 1.253(2) O2-Cu1-N1 88.47(15) N4-N5 1.283(2) O2-Cu1-N2 164.07(3) O1-Cu1-O2 106.90(15) O3-Cu1-N1 102.00(14) O1-Cu1-O3 88.90(14) O3-Cu1-N2 100.14(12) O7-Cu1-N1 98.20(14) N1-Cu1-N2 78.03(14) O7-Cu1-N2 100.34(14)
Figure 4. UV-vis spectra (in DMSO) for Fe-L, Cu-L, Zn-L, and previous Fe(II) complex (Fe-L’).15
peaks at 368, 387, and 352 nm for Fe-L, Cu-L, and Zn-L, respectively, which are shifted to long wavelength region than the corresponding previous complexes without azo- moiety (e.g. 322 nm for Fe(II) one).15 Due to π orbitals in the ligands, the bonds covered around 400 nm, in particular Fe-L exhibits a shoulder around 450-500 nm, for which DFT (based on an optimized structure, dipole moment of Fe-L is 1.74 D from Fe(II) ion to COO- groups) exhibited HOMO- 2→LUMO+1 and HOMO→ LUMO+4 (orbitals spread- ing in -COO- groups) transitions at 376 and 449 nm, respec- tively. Therefore, owing to introduction of azo-moiety, three present complexes became to be useful dyes for DSSC in view of light absorption.
Among the three complexes, only Zn-L showed fluo- rescence peak at 467 nm by excitation of 280 and 370 nm light (Fig. 5). The corresponding previous complex with- out azo-moiety exhibited at 465 nm,15 which is almost iden- tical to Zn-L.
Electrochemical Properties
Table 4 lists HOMO-LUMO gap (Eg) and other elec- trochemical data obtained from CV measurement. For all complexes, LUMO exists in a higher level than the TiO2 conduction band (-0.50 V), and HOMO exists in a lower level than the iodine (I-/I3-) HOMO (+0.40 V). Therefore, it is conceivable that all complexes can inject electrons into TiO2 and restore function as a dye for DSSC. Com- paring with the previous Fe(II) complex,15 these differ-
At first, sample was prepared on ITO substrates, The TiO2 paste involving polyethylene glycol (molecular weight 2000) was coated on an indium doped tin-oxide (ITO) using spin-coat method. The ITO glass supported TiO2 film (0.25 cm2) was then sintered at 723 K for 1 h. The electrode was immersed into solution of Zn-L (0.3 mM DMSO, 24 h) when the oven temperature was cooled to 313 K. Adsorp- tion of Zn-L complex on TiO2 surface was confirmed with XPS, appearance of not only 1024.6 eV (Zn2p3/2) and 1047.6 eV (Zn2p1/2) but also shift to 460.9 eV (Ti2p3/2) 466.6 eV (Ti2p1/2).
The amount of Fe-L adsorbed on TiO2 was increased up to 61% after linearly polarized UV irradiation, which was found for the first time. Dye loading amounts were 2.33, 3.43, and 3.75×10⁻⁷ mol/cm2 for before and after natural or linearly polarized UV light (<350 nm) for 10 min, respectively.
Since TiO2 is a porous material (Fig. 6), it is considered that the amount of adsorption increased due to molecules entering the space of TiO2 by irradiating polarized UV light to the dye and adsorbing it while trans to cis-photoisomer- Figure 5. Fluorescence spectra (in DMSO) for Zn-L.
Table 4. Electrochemical data
Fe-L’15 Fe-L Cu-L Zn-L
Eox(NHE)/V 1.069 1.043 0.550 1.139 Ered(NHE)/V -1.248 -1.191 -0.977 -1.143
HOMO/eV -5.509 -5.483 -5.312 -5.579
LUMO/eV -3.192 -3.429 -3.785 -3.297
Eg/eV 2.317 2.234 1.527 2.282
Figure 6. Schematic representation of increasing adsorption amounts of complexes by polarized UV light irradiation. (blue circles) initial trans-azo-dye (red circles) aligned cis-azo-dye into porous surface.
ization and also reorientation towards anisotropic alignment (Weigert effect11) and mutual aggregation.24
CONCLUSION
Three new salen-type complexes containing azoben- zene moieties have been synthesized and characterized.
Structures of similar six-coordinated complexes (Fe-L and Cu-L) were determined by (synchrotron) X-ray analysis.
both complexes by introducing azo-moiety as well as ben- eficial charge transfer to anchoring -COO- groups, absorp- tion bands shifted to around 400 nm and enhanced their intensity. Also calculation data suggested that Fe-L show- ing a band at 449 nm, is considered as the most beneficial as DSSC dye neglecting the loss of the present cell. When (linearly polarized) UV light were irradiated, adsorption amounts of dye complexes onto TiO2 was increased sig- nificantly, which suggested novel and useful effect due to photo-isomerization and alignment of dye-complexes.
Acknowledgements. The synchrotron X-ray crystal- lography experiment at PLS-II BL2D-SMC beamline was supported in part by MSICT and POSTECH. The laboratory XRD work was partly conducted at the Advanced Char- acterization Nanotechnology Platform of the University of Tokyo (Prof. Kazuhiro Fukawa), supported by the Nan- otechnology Platform of the Ministry of Education, Culture, Sports, Science and Technology (MEXT), Japan.
Supporting Information. Additional supporting infor- mation is available in the online version of this article.
REFERENCES
1. O’Regan, B.; Grätzel. M. Nature 1991, 353, 737.
2. Kinoshita, T.; Joanne, D. Y.; Uchida, S.; Kubo, T.; Segawa, H. Nat. Photonics 2013, 7, 535.
3. Jella, T.; Srikanth, M.; Bolligara, R.; Soujanya, Y.; Singh, S. P.; Giribabu, L. Dalton trans. 2015, 44, 14697.
4. Chadwick, N.; Kumar, D. K.; Ivaturi, A.; Grew, B. A.;
Upadhyaya, H. M.; Yellowlees, L. J.; Robertson, N. Eur.
J. Inorg. Chem. 2015, 4878.
5. Mukherjee, S.; Bowman, D. N.; Jakubikova, E. Inorg. Chem.
2015, 54, 560.
6. Harlang, T. C. B.; Yizhu, L.; Gordivska, O.; Fredin, L. A.
Nat. Chem. 2015, 7, 883.
7. Mara, M. W.; Bowman, D. N.; Buyukcakir, O; Shelby, M.
L.; Haldrup, K.; Huang, L.; Harpham, M. R.; Stickrath, A. B.; Zhang, X.; Stoddart, J. F.; Coskun, A.; Jakubikova, E.; Chen, L. X. J. Am. Chem. Soc. 2015, 137, 9670.
8. Jia, Y.; Gou, F.; Fang, R.; Jing, H.; Zhu, Z. Chin. J. Chem.
2014, 32, 513.
9. Ouskova, E.; Vapaavuori, J.; Kaivola, M. Opt. Mater. Express.
2011, 1, 1463.
10. Kubo, S.; Taguchi,R.; Hadano, S.; Narita, M.; Watanabe, O.; Iyoda, T.; Nakagawa, M. ACS Appl. Mater. Interfaces 2014, 6, 811.
11. Yamazaki, A.; Akitsu, T. RSC ADV. 2012, 2, 2975.
12. Shoji, R.; Ikenomoto, S.; Sunaga, N.; Sugiyama, M.; Akitsu, T. J. Appl. Sol. Chem. Model. 2016, 5, 48.
13. Yamaguchi, M.; Tsunoda, Y.; Tanaka, S.; Haraguchi, T.;
Sugiyama, M.; Noor; S.; Akitsu, T. J. Indian Chem. Soc., 2017, 94, 761.
14. Takahashi, K.; Tanaka, S.; Yamaguchi, M.; Tsunoda, Y.;
Akitsu, T.; Sugiyama, M.; Soni, R. K.; Moon. D. J.
Korean Chem. Soc. 2017, 61, 129.
15. Yamane, S.; Hiyoshi, Y.; Tanaka, S.; Ikenomoto, S.; Numata, T.; Takakura, K.; Haraguchi, T.; Palafox, M. A.; Hara, M.;
Sugiyama, M.; Akitsu, T. J. Chem. Chem. Eng., 2018, 11, 135.
16. Numata, T.; Ikenomoto, S.; Akitsu, T. IUCrData. 2013, 1, x160252.
17. Pandhurnekar, C. P.; Meshram, E. M.; Chopde, H. N.; Batra, R. J. Org. Chem. Int. http://dx,doi.org/10.1155/2013/582079.
18. Shin, J. W.; Eom, K.; Moon, D. J. Synchrotron Rad. 2016, 23, 369.
19. Andy H. Fit2D program, FRANCE.
20. Rietveld, H. M. J. Appl. Crystallogr., 1968, 2, 65.
21. Frisch, M. J.; Trucks, G. W.; Schlegel, H. B.; Scuseria, G. E.;
Robb, M. A.; Cheeseman, J. R.; Scalmani, G.; Barone, V. et al.
Gaussian 09, Revision D.01; Gaussian, Inc.; Wallingford, CT, 2009.
22. Lu, Z.-Z.; Peng, J.-D., Wu, A.-K.; Lin, C.-H.; Wu, C.-G.; Ho, K.-C.; Lin, Y.-C.; Lu, K.-L. Eur. J. Inorg. Chem., 2016, 8, 1214.
23. Sharma, G. D.; Singh, S. P.; Kurchania, R.; Ball, R. J. RSC ADV. 2013, 3, 6036.
24. Zhang, L.; Cole, J. M. J. Mater. Chem., 2017, 5, 19541.