Land-cover Change Analysis of North Korea Based on the IPCC Land-cover Classification Scheme
Soojeong Myeong ․ Hong Hyun Jung ․ Jeon Seong Woo Korea Environment Institute,
E-mail : [email protected]
Abstract
Recently, natural disasters such as intense rain, typhoons, flooding, and drought have dramatically increased worldwide. In North Korea's case, food shortages have led to the clearing of forested areas for use as agricultural land; a process which increases the likelihood of additional disasters and makes North Korea more vulnerable to climate change. To develop a strategy against natural disasters, land use analysis should be implemented first. To provide basic data useful for climate change, this study analyzed land use changes in North Korea based on the IPCC classification scheme. Through our analysis, it was found that forested land decreased the most;
from 91866.6㎢ in the 1980s to 86720.6㎢ in the 1990s. Roughly 4.2% of North Korea's forested area decreased while agricultural land increased by 2.2%. As this trend is continuing, more analysis will be provided in the future. The results of this study provide useful data for developing strategies for disaster prevention and climate change.
1. INTRODUCTION
Globally, natural disasters such as intense rain, typhoons, flooding, drought, and unusually high temperatures are occurring. In North Korea, decreased agricultural productivity and energy shortages have led to an increase in the destruction of North Korea's forests, one of its main natural resources. Large forested areas have been converted into agricultural
land in order to overcome the shortage of food. However, deforestation weakens nature's buffering function against flooding and drought, and increases vulnerability to severe weather.
Heavy rain in 1995 and 1996, and unusually high temperatures and drought in 1996 and 1997 caused millions of people to starve to death.
Hundreds of people disappeared and thousands of houses, buildings, bridges, and railroad were damaged due to
intense rain in Pyongyang and its vicinity in 2007. For these reasons, it is necessary for North Korea to develop a comprehensive plan to deal with their environmental problems. To develop a proper strategy against natural disasters, land use analysis should be conducted first.
International cooperation and assistance should be provided to North Korea since it is under severe threat from natural disasters. To provide basic data which is useful for developing strategies to cope with disasters and climate change, this study analyzed land use changes in North Korea based on the classification scheme of the Intergovernmental Panel on Climate Change (IPCC), and added water cover.
2. METHOD AND RESULTS
Changes to Forested Areas in North Korea
Land cover imagery provides useful information regarding land use status for certain areas. Therefore, it is widely used for spatial analysis and environmental planning and management. This study reclassified imagery of the Korean Peninsula (80s and 90s) from the Ministry of Environment of Korea. The six land cover classes suggested by the IPCC, as well as water cover class were analyzed.
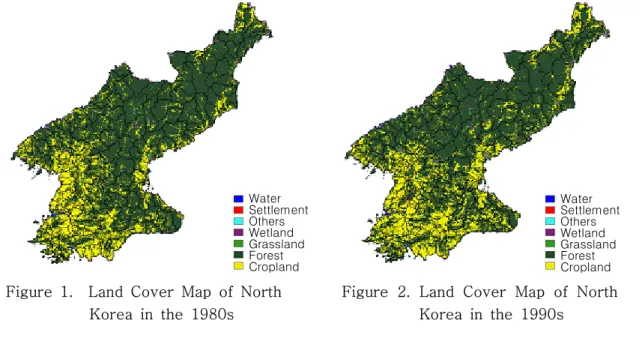
The classes are forested land, cropland, grassland, wetland, settlements, and other land and water areas (Figure 1 and Figure 2).
It was found that the most notable land cover changes occurred around forested land and cropland.
Figure 1. Land Cover Map of North Korea in the 1980s
Figure 2. Land Cover Map of North Korea in the 1990s
Water Settlement Others Wetland Grassland Forest Cropland
Water Settlement Others Wetland Grassland Forest Cropland
Class 1980s 1990s Change
Area(㎢) Rate(%) Area(㎢) Rate(%) Area(㎢) Rate(%) Increase
Water 1448.0 1.2 1506.0 1.2 58.0 0.0 +
Settlement 1409.8 1.1 2128.1 1.7 718.3 0.6 +
Wetland 458.1 0.4 317.3 0.3 -140.8 -0.1 -
Grassland 5058.9 4.1 6083.8 5.0 1024.9 0.8 +
Forest 91866.6 74.9 86720.6 70.7 -5146.0 -4.2 -
Cropland 21434.8 17.5 24129.2 19.7 2694.4 2.2 +
Others 1029.7 0.8 1821.0 1.5 791.3 0.6 +
Total 122705.9 100.0 122705.9 100.0 ․ ․ ․
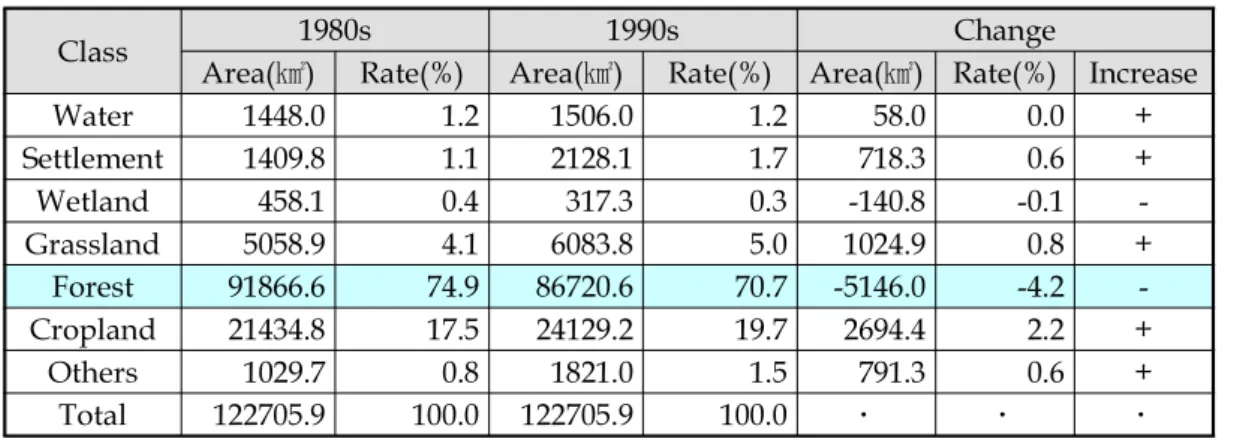
Table 1. Land Cover Change in North Korea
Forested land decreased from 91866.6
㎢ in the 1980s to 86720.6㎢ in the 1990s. Cropland increased from 21434.8
㎢ to 24129.2㎢. The widespread deforestation eventually caused serious natural disasters such as landslides and flooding.
Analysis of the Forested Area of Sariwon
To examine land use changes in North Korea in more detail, this study chose Sariwon, Hamkyung Bukdo for detailed analysis. Sariwon was chosen because it has diverse land cover types
including settlements, cropland, and forested Areas. Forested land in Sariwon in the 1980s was analyzed in order to figure out trends in land use conversion the 1990s.
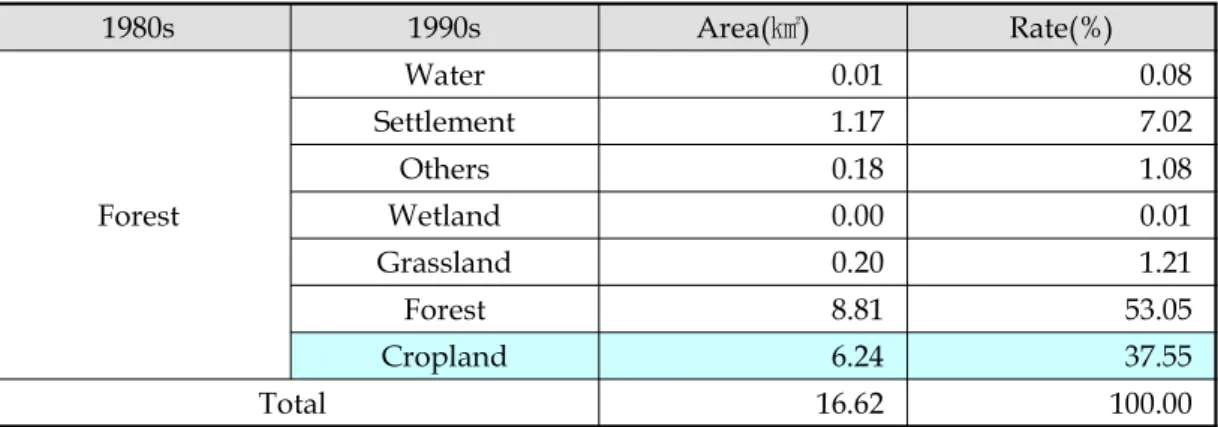
It turned out that forested areas totaling 16.62㎢ were converted to other land use types in the 1980s and almost half of the forested area had changed.
Around 37% of forested areas were converted to cropland; a total which reinforced the notion that forest conversion was occurring due to food shortages.
Figure 3. Changes to Forested Area in Sariwon
1980s 1990s Area(㎢) Rate(%)
Forest
Water 0.01 0.08
Settlement 1.17 7.02
Others 0.18 1.08
Wetland 0.00 0.01
Grassland 0.20 1.21
Forest 8.81 53.05
Cropland 6.24 37.55
Total 16.62 100.00
Table 2. Changes to Forested Area in Sariwon
3. CONCLUSION
This study examined land use changes in North Korea in order to provide basic data useful for the development of strategies to cope with climate change and prevent natural disasters. The reclassified imagery of North Korea based on the IPCC land use scheme revealed that great amounts of forested areas had been converted to other land use types. It is assumed that this trend will continue. Further analysis of recent land cover changes will be provided in the future.
REFERENCES
Burby, R.J.(Ed). 1998. Cooperating with nature: Confronting natural hazards with land use planning for sustainable communities. Washington, DC: Joseph Henry. National Academy Press.
IPCC. 2006. Guidelines for National Greenhouse Gas Inventories.
Korea Forest Research Institute. 2003.
The Status of Forestry in North Korea.
Pyungyang Times. September 1st, 2007 UNEP. 2003. DPRK: State of the
Environment 2003.