© 2011 The Korean Nutrition Society DOI 10.4163/kjn.2011.44.2.119
한국인의 대사증후군과 다량 영양소의 섭취패턴*
정현주1
·
송원옥2·
백희영1·
정효지3§서울대학교 식품영양학과,1 Michigan State University,2 서울대학교 보건대학원3
Dietary Characteristics of Macronutrient Intake and the Status of Metabolic Syndrome among Koreans *
Jung, Hyun Ju
1ㆍSong, Won Ok
2ㆍPaik, Hee-Young
1ㆍJoung, Hyojee
3§1Department of Food and Nutrition, Seoul National University, Seoul 151-742, Korea
2Department of Food Science and Human Nutrition, Michigan State University, MI48824, USA
3Graduate School of Public Health, Seoul National University, Seoul 151-742, Korea
ABSTRACT
Metabolic syndrome (MetS), which is heavily dependent on dietary and lifestyle practices, is prevalent in Korean adults. Because dietary practices are unique for each race, nationality, and culture, it is important to identify Korean adult dietary practices that are associated with MetS. Macronutrient intake patterns were analyzed and compared across health status using the 2007-2008 Korean National Health and Nutrition Examination Survey data (8,143 adults who had dietary data and biomarkers related to MetS). Although intake levels were different by age, gender, and health status, carbohydrate intake was high and fat intake was low among Korean adults. The carbohydrate energy ratio was higher and the fat energy ratio was lower for subjects > 60 years old who were diagnosed with diabetes, hypertension, or MetS than those in other age groups. The main source of fat from food differed depending on the group. These re- sults demonstrated that macronutrient intake patterns were different between age, gender, and health status subgroups.
Hence, it is recommended that nutritional policy and practices aimed at controlling MetS should be based on the di- etary characteristics of the target group.
(Korean J Nutr 2011; 44 (2): 119 ~ 130)KEY WORDS:
metabolic syndrome, macronutrients, food, dish.
접수일:2010년 12월 30일 / 수정일:2011년 3월 22일 채택일:2011년 03월 28일
*This work was supported by a grant from the Cooperative Research Program for Agriculture Science & Technology Development (no. PJ007211), Rural Development Administra- tion, Republic of Korea.
§To whom correspondence should be addressed.
E-mail: [email protected]
서 론
대사증후군은 대사적 기원의 상호연관된 위험요인 (대사적 위험 요인)들이 공존하는 상태로, 죽상동맥경화성 심혈관계 질환 (atherosclerotic cardiovascular disease; ASCVD) 과 제2형 당뇨병 발생 위험을 직접적으로 촉진하는 것으로 알려져 있다.
1,2)가장 널리 인정되는 대사적 위험 요인은 죽종 형성 이상지혈증 (atherogenic dyslipidemia), 높은 혈압, 높 은 혈당이다. 한편 대사증후군의 주된 근원적인 위험 요인
은 복부 비만과 인슐린 저항증이며, 저조한 신체활동, 노화, 호르몬 불균형 등이 관련된 것으로 알려져 있다.
2)대사증후군은 한국인의 주요사망원인인 심혈관계 질환과 당뇨병의 위험을 높인다는 점에서 주목되고 있다.
3)심장 질 환은 사망원인 3위로 사망률이 1999년 인구 10만 명당 38.9 명에서 2009년 45.0명으로 지난 10년간 증가하였다. 당뇨병 은 사망원인 5위로 사망률이 인구 10만 명당 19.6명이며 지 난 10년간 증가하다가 약간 감소하였다. 그러나 2008년 국 민건강영양조사 결과에 의하면
4)우리나라의 당뇨병 유병률 은 30세 이상 성인에서 10.0%이며 65세 이상에서는 19.7%로 더욱 높은 유병률을 보여 고령화 사회에서 의료비 및 삶의 질에 큰 영향을 미치는 질환이 될 것임을 알 수 있다.
제3기 (2005년) 국민건강영양조사 심층분석보고서에 의
하면, National Cholesterol Education Program Adult
Treatment Panel (NCEP ATP) III의 진단기준에 허리둘
레는 대한비만학회에서 제시한 남자 90 cm 이상, 여자 85
cm 이상, 공복 혈당은 100 mg/dL 이상인 기준을 적용했을
때, 30세 이상 한국 성인의 연령 표준화 대사증후군 유병률 은 1998년 30.0%, 2001년 31.3%, 2005년 29.8%로 큰 변 화없이 30% 안팎이었다.
5)우리나라 40세 이상의 농촌 지역 주민을 대상으로 한 연구에서는 NCEP ATP III의 기준 (허 리둘레 조정하지 않았음)을 이용하였을 때 대사증후군 유 병률이 29.4%였고, WHO 기준을 적용하면 39.2%였다.
6)30~80세의 도시 지역 주민을 대상으로 한 다른 연구에서 는 허리둘레 기준을 남자 90 cm, 여자 80 cm로 낮추어 적 용했을 때 남자 29.0%, 여자 16.8%의 유병률을 보였다.
7)우 리나라 20~78세 성인을 대상으로 평균 8.7년의 추적 결과 대사증후군이 심혈관질환의 발병 위험과 관련이 있었으며 [OR = 1.98 (남자), 4.04 (여자)], 공복 혈당을 보정한 후에 도 남자에게서 당뇨병 발병 위험을 높인다 (OR = 1.79)는 연구도 있었다.
8)이러한 연구 결과들을 보았을 때 한국인에 게 대사증후군이 흔하게 존재하며, 앞으로 당뇨병이나 심혈 관계 질환의 위험도 높일 수 있다는 점에서 예방과 관리에 주목할 필요가 있다.
대사증후군의 관리는 생활 방식 변화를 통해 근원적인 위 험 요인들 (비만, 비활동, 죽종 형성 식사)를 완화시키는 것이 가장 중요한데, 체중을 정상 범위로 유지하고 신체 활동을 증가시키며 포화 지방, 트랜스 지방, 콜레스테롤의 섭취를 줄 이고 단순당의 섭취를 제한하도록 권장하고 있다. 아울러 과 일, 채소, 전곡류를 많이 섭취하고 특정 생선의 수은 함량 에 주의해 생선 섭취를 늘리는 것도 권장된다.
2)또, 탄수화 물 섭취가 너무 높으면 혈중 지질 이상을 악화시킨다고 알 려져 있다. 미국의 NCEP ATP III의 3차 보고서에서는 지방 을 총 열량의 25~35% 로 유지하도록 권고하면서 그 근거 로 총 에너지의 35%를 초과한 지방 섭취는 비만을 촉진하 면서 대사적 이상을 초래하고, 탄수화물 섭취를 총 에너지 의 60%를 초과하여 섭취하는 것은 대사증후군에서 흔한 혈중 지질 이상을 악화시킨다고 하였다.
1)이 보고서가 발간 된 2002년 이후에도 다량 영양소의 섭취와 대사증후군 유 병률의 관계에 관한 연구 결과가 다수 발표되었다. 저탄수화 물 식사 [탄수화물 : 단백질 : 지방 에너지비 = 48 : 19 : 33 (24%는 불포화지방)]가 고혈압과 고중성지방혈증의 유병률 을 유의하게 낮추었다는 연구 결과가 있으며,
9)총 에너지 섭 취량은 같도록 하되 탄수화물 섭취를 높이고 지방과 단백 질 섭취를 낮게 한 식사 (탄수화물 : 단백질 : 지방 에너지비
= 50 : 20 : 30)가 대사증후군의 유병률을 줄이는 것과 관 련있다는 연구 결과
10)도 있었다. 이 두 연구에서 탄수화물 에 너지비가 50% 안팎으로 거의 비슷함에도 불구하고 하나는 저탄수화물식사, 다른 하나는 고탄수화물식사라고 명명한 것은 비교 대상으로 한 다른 식사의 탄수화물, 지방 에너지
에 비해 상대적으로 탄수화물 에너지비가 낮거나 높다고 했 기 때문일 것이다. 한편 탄수화물의 종류에 따른 차이를 본 연구도 있는데, 혈당지수 (glycemic index)를 낮추면 총 콜 레스테롤과 LDL 콜레스테롤을 낮추고 인슐린 민감도를 향 상시켰다고 하였다.
11)우리나라 사람들을 대상으로 다량 영양 소의 비율을 조절하여 심혈관질환의 위험요인의 변화를 본 중재연구는 거의 없으나, 국민건강영양조사 자료를 이용하 여 중년 한국인의 대사증후군 보유에 따른 다량 영양소 섭 취비율을 비교한 연구에서 대사증후군을 가진 사람들의 탄 수화물 에너지비가 높고 지방 에너지비가 낮다고 하였다.
12)위에서 살펴본 바와 같이 대사증후군은 우리나라에서 유 병률이 높아 심혈관 질환과 당뇨병의 발생위험을 높일 수 있으므로, 식사를 비롯한 생활 양식의 변화로 조절해야 하 는 질환이다. 그러므로, 대사증후군과 관련된 것으로 알려진 식사요인들의 역학적 특성을 파악하고, 대사증후군 위험요 인과의 관련성을 분석하여, 식사개선방안의 과학적 근거자 료를 마련할 필요가 있다. 본 연구는 국민건강영양조사 데 이터를 이용하여 한국인의 대사증후군 보유 여부 및 만성질 환 진단 여부에 따라 다량 영양소의 섭취량, 에너지 기여율, 주 요 급원 식품 및 음식 등의 섭취패턴을 파악함으로써, 대사 증후군 예방 및 관리를 위한 식사개선방안 마련의 기초자료 를 제공하고자 수행하였다.
연 구 방 법
연구대상
국민건강영양조사 제4기 1, 2차년도 (2007~2008)에 참여 한 20세 이상 성인으로, 허리둘레, 혈압, 혈당, 혈중 HDL 콜 레스테롤, 혈중 중성지방 등 대사증후군 여부 판정을 위한 신체계측 및 혈액 검사 데이터와 1일치 식품섭취조사 (24시 간 회상법 1일치) 데이터가 존재하는 8,143명의 자료를 분 석하였다.
건강상태 및 대사증후군 판단기준
만성질병을 이미 진단받고 나면 식사를 종전과 달리 할 가
능성이 높으므로 국민건강영양조사 원시 자료에서 인지율을
알 수 있는 두 개의 만성질병, 즉, 당뇨병, 고혈압을 진단받은
적이 있는 대상자들을 따로 분석하였다. 당뇨병이나 고혈압
을 진단받은 적이 없는 사람들을 대사증후군 보유 여부에
따라 나누어, ‘당뇨병이나 고혈압 미진단, 대사증후군 없음
(Control)’, ‘당뇨병이나 고혈압 미진단, 대사증후군 있음
(New MetS)’, ‘당뇨병이나 고혈압 진단 (Control with dis-
ease)’ 등 세 군으로 건강상태를 분류하여 다량 영양소 섭
취실태를 비교하였다.
대사증후군은 기관에 따라 여러 가지 진단 기준이 있으나 본 연구에서는 NCEP ATP III의 기준을 따르되 공복혈당장 애 기준을 110 mg/dL에서 100 mg/dL으로 낮추어서 (최근 American Diabetes Association에서 조정하였음) AHA 와 NHLBI가 제시한 진단 기준
2)을 사용하였는데, 허리둘레 남자 90 cm 이상, 여자 80 cm 이상, 혈중 중성지방 150 mg/
dL 이상 또는 약물 복용, HDL콜레스테롤 남자 40 mg/dL 미만, 여자 50 mg/dL 미만 또는 약물 복용, 수축기 혈압 130 mmHg 이상 또는 이완기 혈압 85 mmHg 이상 또는 고혈 압 병력 있는 환자의 경우 약물 복용, 공복 혈당 100 mg/dL 이상 또는 약물 복용 중 어느 것이든 3개에 해당되면 대사증 후군으로 판단하였다.
다량 영양소의 섭취패턴 분석
탄수화물, 단백질, 지방 각각의 섭취량과 에너지 기여율, 급 원 식품과 음식 목록을 분석하여 다량 영양소의 섭취패턴 을 파악하고, 이러한 패턴이 건강상태에 따라 어떻게 다르게 나타나는지를 비교하였다.
개인별 1일 영양소의 섭취량을 구한 후 국민건강영양조사 의 표본 추출률과 응답률, 해당년도 모집단의 성별, 연령별 인구구조로 사후 보정하여 모집단인 국민의 다량 영양소 섭 취량 등을 추정하였다 (통계 소프트웨어 SAS의 Proc Sur- veymeans 이용). 분석 대상자 전체 뿐 아니라 성별, 연령대 별, 건강상태에 따라 통계량을 산출하고, 그룹별 평균의 차 이를 검정하였다.
각 다량 영양소의 에너지 기여율은 전체 다량 영양소 (탄수 화물, 단백질, 지방)로부터 섭취된 에너지 중 해당 다량 영양 소로부터 섭취된 에너지의 비율로 계산하였다 (Table 3의 각 주 참조). 다량 영양소의 주요 급원 식품과 음식은 섭취빈도 와 섭취량을 모두 고려하였다. 각 식품으로부터 섭취한 해당 다량 영양소의 섭취량 총량의 내림차순으로 정렬하여 20위 까지의 식품 목록을 추출하였고, 각 식품의 출현 빈도와 1회 섭취당 해당 다량 영양소의 평균 섭취량을 함께 제시하였다.
또, 분석 대상자의 1% 미만에 해당하는 빈도로 섭취된 식 품은 삭제하여 극소수 대상자가 다량으로 섭취한 식품이 주 요 급원 식품으로 포함되지 않도록 하였다. 음식의 경우는 개 인별 끼니별로 어떤 음식을 섭취한 경우를 섭취빈도 1회로 계 산하였고, 그 외의 분석 방법은 식품의 경우와 같았다.
건강상태에 따른 다량 영양소 섭취패턴의 차이 분석
건강상태별로 다량 영양소 섭취량과 에너지 기여율의 평균 및 중위수, 급원 식품과 음식 목록을 비교하였다. 각 건강상 태에 속한 대상자들 중 탄수화물 에너지비 70% 초과, 지방
에너지비 15% 미만, 단백질 에너지비 7% 미만 또는 20% 초 과한 사람들의 교차비 (odds ratio)를 당뇨병이나 고혈압을 진단받지 않았고 대사증후군이 없는 사람들을 기준으로 구 하였다. 국민건강영양조사가 복합표본설계임을 고려해 SAS 의 proc surveylogistic 프로시져를 이용하여 로지스틱 회 귀분석을 하였다.
결 과
대상자들의 특성
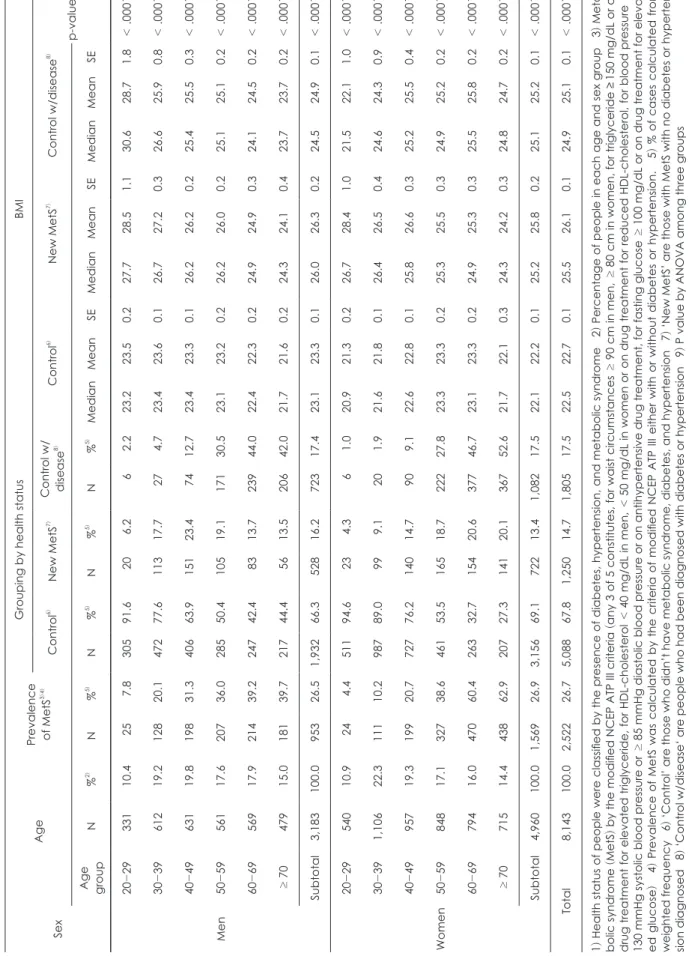
2007~2008 국민건강영양조사 결과로부터 추정한 한국인 의 대사증후군 유병률은 남자 26.5%, 여자 26.7%로 거의 비 슷하였다 (Table 1). 60대 이상의 여성의 대사증후군 유병 률은 60%를 넘어 다른 성별과 연령대에 비해 매우 높았다.
남녀 모두 연령이 높을수록 대사증후군 유병률도 높아졌는 데, 20대와 30대는 남자의 유병률이 여자의 2배 정도이다 가 50대에 성별 차이가 거의 없어졌고, 60대가 되면 여자의 유병률이 남자에 비해 급격히 증가하는 양상을 보였다. 국 민건강영양조사에서 파악 가능한 당뇨병, 고혈압 진단 여부 를 기준으로 이미 만성질병을 진단받은 사람들과 아닌 사람 들로 나누고, 진단받지 않은 사람들을 대사증후군 보유 여 부로 대상자들을 재분류하여 비교하여 보았다 (Table 1).
이미 당뇨병이나 고혈압을 진단받은 사람들이 전체의 17.5%
(남자 전체 17.4%, 여자 전체 17.5%) 정도였고, 남녀 모두 50 대부터 급격히 높아져, 여자 70세 이상은 52.6%가 당뇨병이 나 고혈압을 진단받았다. 만성질병으로 진단받지 않았으면서 대사증후군인 사람들은 남자 16.2%, 여자 13.4%였고 연령대 에 따라 큰 차이를 보였다 (Table 1). 아울러 당뇨병이나 고혈 압 진단을 받은 적이 없고 대사증후군도 아닌 사람들의 비 율도 연령이 증가할수록 줄어드는 경향을 보였는데, 특히 여 자 60대 이상은 30% 내외의 대상자가 이 그룹에 속했다. 이 사람들은 다른 질병 위험요인을 가지고 있을 수 있으나 비교 적 건강해 보이는 사람들의 비율로 볼 수 있는데, 이 숫자가 노 년층의 남자는 40%, 여자는 30% 정도밖에 되지 않았다. 남 녀 전체 및 각 연령대에서 건강상태에 따른 세 그룹간 BMI 의 평균이 통계적으로 유의한 차이를 보였는데, 당뇨병이나 고 혈압으로 진단받은 적이 없으면서 대사증후군이 없는 사람들 이 다른 두 그룹에 비해 BMI가 낮은 편이었다.
다량 영양소의 섭취패턴
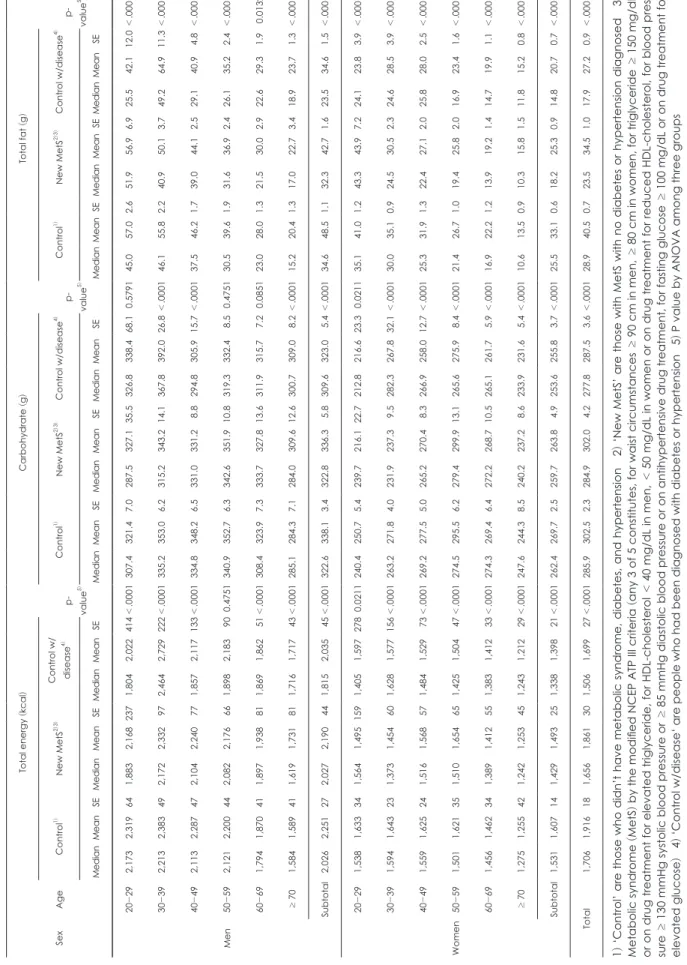
1인당 1일 평균 탄수화물 섭취량은 당뇨병이나 고혈압 진
단을 받지 않았고 대사증후군도 없는 그룹이 남자 338 g,
여자 270 g이었고, 대사증후군 그룹은 남자 336 g, 여자 264
Table 1. Distribution and characteristics of Korean adults by health status1) Sex Age
Prevalence of MetS
3)4)Grouping by health statusBMI Control6) New MetS7)
Control w/ disease
8)Control6) New MetS7) Control w/disease8) p-value9)
Age group
N%2) N%5) N%5) N%5) N%5) MedianMeanSEMedianMeanSEMedianMeanSE Men
20-29331 10.4 25 7.8 305 91.6 20 6.2 6 2.2 23.2 23.5 0.2 27.7 28.5 1.1 30.6 28.7 1.8 < .0001 30-39612 19.2 128 20.1 472 77.6 113 17.7 27 4.7 23.4 23.6 0.1 26.7 27.2 0.3 26.6 25.9 0.8 < .0001 40-49631 19.8 198 31.3 406 63.9 151 23.4 74 12.7 23.4 23.3 0.1 26.2 26.2 0.2 25.4 25.5 0.3 < .0001 50-59561 17.6 207 36.0 285 50.4 105 19.1 171 30.5 23.1 23.2 0.2 26.2 26.0 0.2 25.1 25.1 0.2 < .0001 60-69569 17.9 214 39.2 247 42.4 83 13.7 239 44.0 22.4 22.3 0.2 24.9 24.9 0.3 24.1 24.5 0.2 < .0001 ≥ 70479 15.0 181 39.7 217 44.4 56 13.5 206 42.0 21.7 21.6 0.2 24.3 24.1 0.4 23.7 23.7 0.2 < .0001 Subtotal3,183 100.0 953 26.5 1,932 66.3 528 16.2 723 17.4 23.1 23.3 0.1 26.0 26.3 0.2 24.5 24.9 0.1 < .0001 Women
20-29540 10.9 24 4.4 511 94.6 23 4.3 6 1.0 20.9 21.3 0.2 26.7 28.4 1.0 21.5 22.1 1.0 < .0001 30-391,106 22.3 111 10.2 987 89.0 99 9.1 20 1.9 21.6 21.8 0.1 26.4 26.5 0.4 24.6 24.3 0.9 < .0001 40-49957 19.3 199 20.7 727 76.2 140 14.7 90 9.1 22.6 22.8 0.1 25.8 26.6 0.3 25.2 25.5 0.4 < .0001 50-59848 17.1 327 38.6 461 53.5 165 18.7 222 27.8 23.3 23.3 0.2 25.3 25.5 0.3 24.9 25.2 0.2 < .0001 60-69794 16.0 470 60.4 263 32.7 154 20.6 377 46.7 23.1 23.3 0.2 24.9 25.3 0.3 25.5 25.8 0.2 < .0001 ≥ 70715 14.4 438 62.9 207 27.3 141 20.1 367 52.6 21.7 22.1 0.3 24.3 24.2 0.3 24.8 24.7 0.2 < .0001 Subtotal4,960 100.0 1,569 26.9 3,156 69.1 722 13.4 1,082 17.5 22.1 22.2 0.1 25.2 25.8 0.2 25.1 25.2 0.1 < .0001 Total8,143 100.0 2,522 26.7 5,088 67.8 1,250 14.7 1,805 17.5 22.5 22.7 0.1 25.5 26.1 0.1 24.9 25.1 0.1 < .0001 1) Health status of people were classified by the presence of diabetes, hypertension, and metabolic syndrome 2) Percentage of people in each age and sex group 3) Meta- bolic syndrome
(MetS
) by the modified NCEP ATP III criteria
(any
3 of 5 constitutes, for waist circumstances ≥ 90 cm in men, ≥ 80 cm in women, for triglyceride ≥ 150 mg/dL or on drug treatment for elevated triglyceride, for HDL-cholesterol < 40 mg/dL in men, < 50 mg/dL in women or on drug treatment for reduced HDL-cholesterol, for blood pressure ≥ 130 mmHg systolic blood pressure or ≥ 85 mmHg diastolic blood pressure or on antihypertensive drug treatment, for fasting glucose ≥ 100 mg/dL or on drug treatment for elevat- ed glucose) 4) Prevalence of MetS was calculated by the criteria of modified NCEP ATP III either with or without diabetes or hypertension. 5) % of cases calculated from weighted frequency 6) ‘Control’ are those who didn’t have metabolic syndrome, diabetes, and hypertension 7) ‘New MetS’ are those with MetS with no diabetes or hyperten- sion diagnosed 8
) ‘Control w/disease‘ are people who had been diagnosed with diabetes or hypertension 9 ) P value by ANOVA among three groups
Table 2. Energy and macronutrient intake of Korean adults by health status SexAge
Total energy
(kcal
)Carbohydrate
(g)Total fat
(g) Control w/ 1)2)3)ControlNew MetS4)diseasep- 5)value
Control1)New MetS2)3)Control w/disease4) p- value5)
Control1)New MetS2)3)Control w/disease4) p- value5) MedianMeanSEMedianMeanSEMedianMeanSEMedianMeanSEMedianMeanSEMedianMeanSEMedianMeanSEMedianMeanSEMedianMeanSE Men
20-292,1732,319641,8832,1682371,8042,022414<.0001307.4321.47.0287.5327.135.5326.8338.468.10.5791 45.057.02.651.956.96.925.542.112.0<.0001 30-392,2132,383492,1722,332972,4642,729222<.0001335.2353.06.2315.2343.214.1367.8392.026.8<.000146.155.82.240.950.13.749.264.911.3<.0001 40-492,1132,287472,1042,240771,8572,117133<.0001334.8348.26.5331.0331.28.8294.8305.915.7<.000137.546.21.739.044.12.529.140.94.8<.0001 50-592,1212,200442,0822,176661,8982,183900.4751 340.9352.76.3342.6351.910.8319.3332.48.50.4751 30.539.61.931.636.92.426.135.22.4<.0001 60-691,7941,870411,8971,938811,8691,86251<.0001308.4323.97.3333.7327.813.6311.9315.77.20.0851 23.028.01.321.530.02.922.629.31.90.0132 ≥ 701,5841,589411,6191,731811,7161,71743<.0001285.1284.37.1284.0309.612.6300.7309.08.2<.000115.220.41.317.022.73.418.923.71.3<.0001 Subtotal2,0262,251272,0272,190441,8152,03545<.0001322.6338.13.4322.8336.35.8309.6323.05.4<.000134.648.51.132.342.71.623.534.61.5<.0001 Women
20-291,5381,633341,5641,4951591,4051,5972780.0211 240.4250.75.4239.7216.122.7212.8216.623.30.0211 35.141.01.243.343.97.224.123.83.9<.0001 30-391,5941,643231,3731,454601,6281,577156<.0001263.2271.84.0231.9237.39.5282.3267.832.1<.000130.035.10.924.530.52.324.628.53.9<.0001 40-491,5591,625241,5161,568571,4841,52973<.0001269.2277.55.0265.2270.48.3266.9258.012.7<.000125.331.91.322.427.12.025.828.02.5<.0001 50-591,5011,621351,5101,654651,4251,50447<.0001274.5295.56.2279.4299.913.1265.6275.98.4<.000121.426.71.019.425.82.016.923.41.6<.0001 60-691,4561,462341,3891,412551,3831,41233<.0001274.3269.46.4272.2268.710.5265.1261.75.9<.000116.922.21.213.919.21.414.719.91.1<.0001 ≥ 701,2751,255421,2421,253451,2431,21229<.0001247.6244.38.5240.2237.28.6233.9231.65.4<.000110.613.50.910.315.81.511.815.20.8<.0001 Subtotal1,5311,607141,4291,493251,3381,39821<.0001262.4269.72.5259.7263.84.9253.6255.83.7<.000125.533.10.618.225.30.914.820.70.7<.0001 Total1,7061,916181,6561,861301,5061,69927<.0001285.9302.52.3284.9302.04.2277.8287.53.6<.000128.940.50.723.534.51.017.927.20.9<.0001 1) ‘Control’ are those who didn’t have metabolic syndrome, diabetes, and hypertension 2) ‘New MetS’ are those with MetS with no diabetes or hypertension diagnosed 3) Metabolic syndrome
(MetS
) by the modified NCEP ATP III criteria
(any
3 of 5 constitutes, for waist circumstances ≥ 90 cm in men, ≥ 80 cm in women, for triglyceride ≥ 150 mg/dL or on drug treatment for elevated triglyceride, for HDL-cholesterol < 40 mg/dL in men, < 50 mg/dL in women or on drug treatment for reduced HDL-cholesterol, for blood pres- sure ≥ 130 mmHg systolic blood pressure or ≥ 85 mmHg diastolic blood pressure or on antihypertensive drug treatment, for fasting glucose ≥ 100 mg/dL or on drug treatment for elevated glucose
) 4 ) ‘Control w/disease‘ are people who had been diagnosed with diabetes or hypertension 5 ) P value by ANOVA among
three groups
Table 3. Sources of energy intake of Korean adults by health status SexAge
Carbohydrate energy
(%
)1) Fat energy
(%
)2) Control3) New MetS4)5) Control w/ disease6) p- value7)Control3) New MetS4)5) Control w/ disease6) p- value7) MedianMeanSEMedianMeanSEMedianMeanSEMedianMeanSEMedianMeanSEMedianMeanSE Men
20-2963.461.50.762.461.31.870.467.73.7< .000121.522.50.621.723.51.517.017.42.2< .0001 30-3964.163.50.566.164.31.167.363.02.70.002019.721.00.518.020.00.919.221.32.5< .0001 40-4967.065.80.666.665.50.967.965.81.60.257817.218.60.417.018.80.715.917.71.2< .0001 50-5969.168.10.770.668.80.969.669.10.8< .000114.816.20.513.915.80.813.715.10.6< .0001 60-6974.172.50.773.672.01.273.571.30.90.018411.613.40.511.914.00.912.014.10.60.1882 ≥ 7078.275.30.777.775.61.575.573.80.8< .00019.111.30.69.811.51.110.712.50.6< .0001 Subtotal68.065.20.369.066.70.572.269.50.5< .000116.719.30.315.918.00.412.515.20.4< .0001 Women
20-2963.762.90.560.559.52.967.869.63.1< .000121.322.10.424.225.12.418.017.02.1< .0001 30-3968.066.80.467.066.81.270.467.92.40.942517.618.70.317.518.21.014.117.42.40.2995 40-4970.668.70.572.070.70.970.167.91.4< .000114.716.80.413.714.90.715.516.91.0< .0001 50-5973.472.10.574.372.81.175.973.10.8< .000112.414.10.412.013.40.710.713.40.6< .0001 60-6976.473.60.679.075.81.077.174.70.7< .000110.712.90.59.212.00.89.911.80.5< .0001 ≥ 7080.077.80.779.076.31.178.476.30.6< .00018.09.60.58.310.70.89.310.80.4< .0001 Subtotal70.267.80.374.571.70.676.673.70.4< .000115.317.80.212.014.50.410.412.70.3< .0001 Total69.466.60.272.069.00.475.171.70.4< .000115.918.50.213.516.40.311.313.90.3< .0001 1) carbohydrate energy = [carbohydrate intake
(g)
× 4
(kcal/g )]/[carbohydrate intake × 4 + protein intake × 4 + fat intake × 9
] × 100 2
) fat energ
y = [fat intake
(g)
× 9
(kcal/
g)]/(carbohydrate intake × 4 + protein intake × 4 + fat intake × 9
) × 100 3
) ‘Control’ are those who didn’t have metabolic syndrome, diabetes, and hypertension 4
) ‘New ) MetS’ are those with MetS with no diabetes or hypertension diagnosed 5Metabolic syndrome
(MetS
) by the modified NCEP ATP III criteria
(any
3 of 5 constitutes, for waist cir- cumstances ≥ 90 cm in men, ≥ 80 cm in women, for triglyceride ≥150 mg/dL or on drug treatment for elevated triglyceride, for HDL-cholesterol < 40 mg/dL in men, < 50 mg/dL in women or on drug treatment for reduced HDL-cholesterol, for blood pressure ≥ 130 mmHg systolic blood pressure or ≥ 85 mmHg diastolic blood pressure or on antihyperten- sive drug treatment, for fasting glucose ≥ 100 mg/dL or on drug treatment for elevated glucose 6) ‘Control w/disease‘ are people who had been diagnosed with diabetes or hypertension 7
) P value by ANOVA among three groups
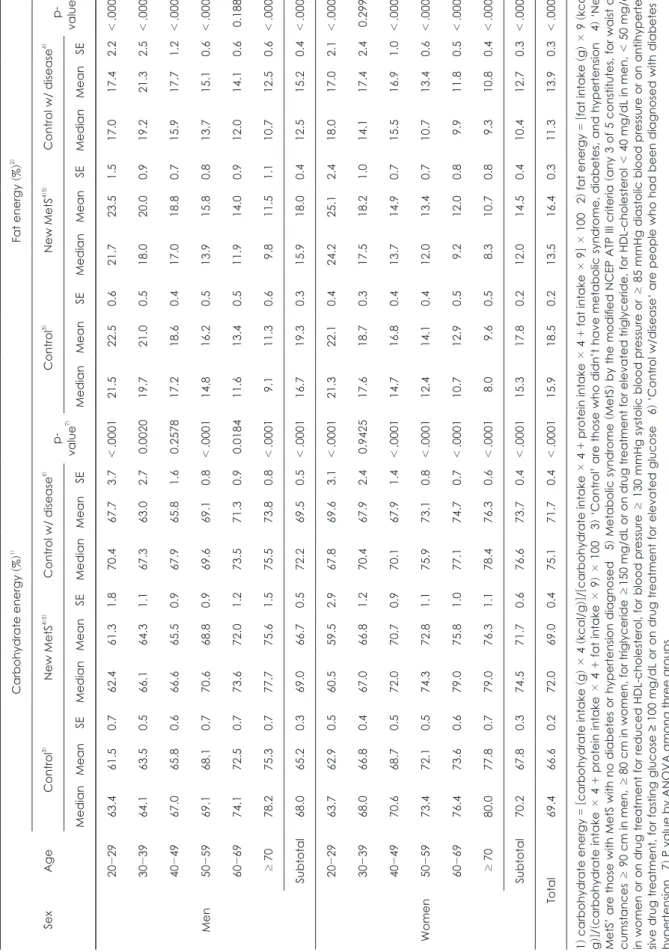
g으로 비슷한 수준이었다. 당뇨병이나 고혈압으로 진단받은 그룹은 남자 323 g, 여자 256 g으로 이상의 두 그룹에 비해 낮은 편이었다. 각 성별의 연령대별로 따로 비교했을 때 조 금씩 다른 경향을 보였다 (Table 2). 그러나 전체 다량 영양 소로부터 섭취한 에너지 중 탄수화물 에너지비를 계산한 결 과는 탄수화물 섭취량과는 다른 경향을 보였다 (Table 3).
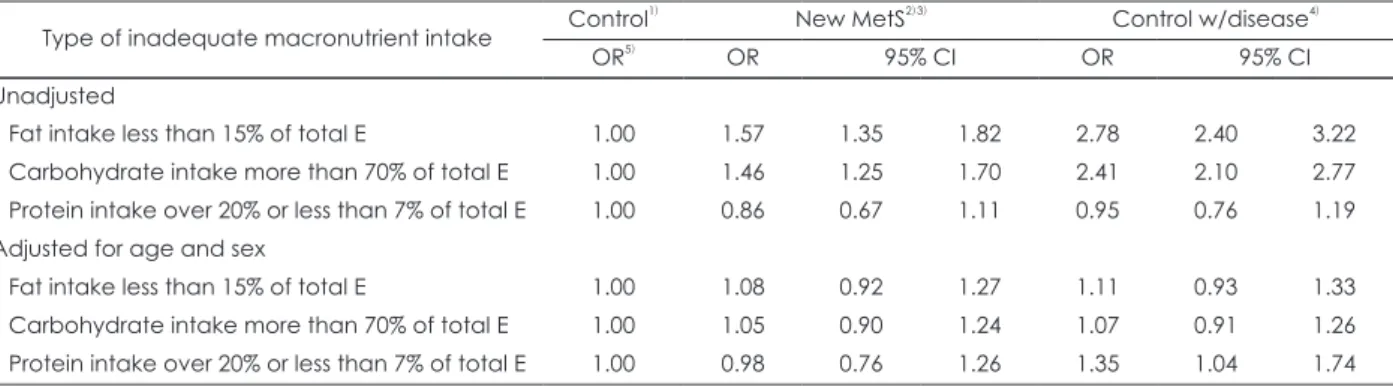
남자가 여자보다 더 낮았고, 연령대가 높을수록 탄수화물 에너지비가 증가하는 경향을 보였으며, 당뇨병이나 고혈압 진단을 받지 않았고 대사증후군도 없는 그룹에 비해 대사 증후군이 있는 그룹과 당뇨병이나 고혈압 진단을 받은 그룹 의 탄수화물 에너지비가 더 높았다. 각 성별의 연령대별로 비교하면 그룹 간 차이가 없는 연령대도 있었으나 대체로 같은 경향을 보였다. 당뇨병이나 고혈압을 진단 받은 사람들 의 61%가 탄수화물 에너지가 70%를 초과하여, 당뇨병이나 고혈압을 진단받지 않았고 대사증후군이 없는 그룹 (40%), 대사증후군이 있는 그룹 (38%)에 비해 거의 2배에 달해, 이 미 당뇨병이나 고혈압을 진단받은 사람들의 에너지 급원이 지나치게 탄수화물 중심임을 알 수 있었다 (자료 미제시).
그러나, 성별과 연령을 보정한 후에는 건강상태에 따라 탄 수화물 에너지비가 70%를 초과하는 사람들의 교차비는 그 룹간에 유의한 차이가 없었다 (Table 4).
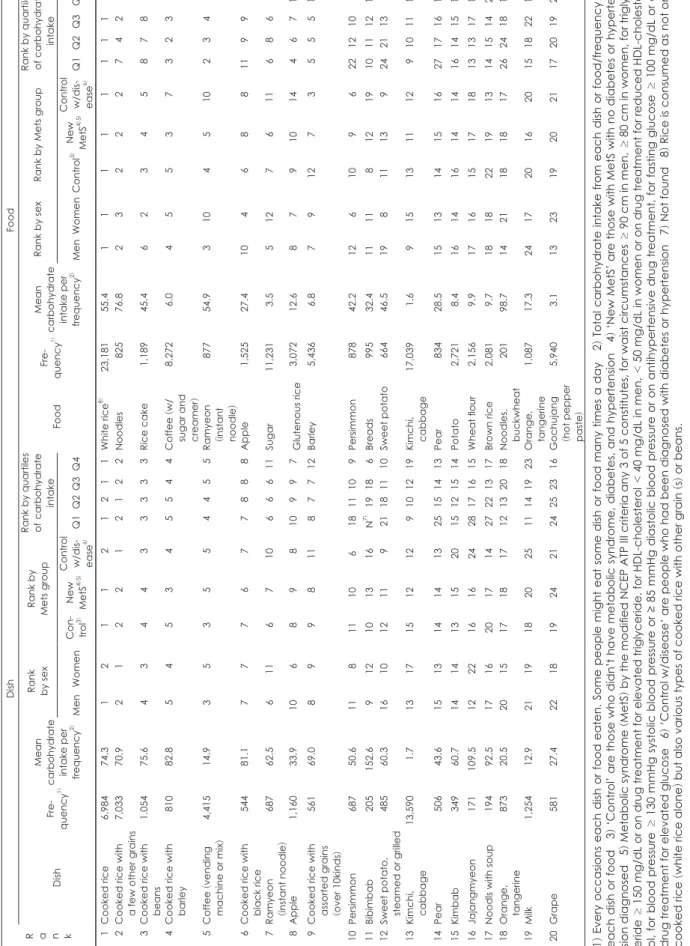
탄수화물의 주요 급원 식품은 백미, 국수, 떡, 커피, 라면, 사과, 설탕, 찹쌀, 보리, 감 등이었다 (Table 5). 커피는 설탕 과 분말크리머가 혼합된 형태를 포함하기 때문에 주요 탄수 화물 급원으로 등장했다고 생각된다. 성별에 따라 탄수화 물 급원 식품의 차이가 있었는데, 남자는 라면의 순위가 두 드러지게 높았고 배추김치를 통한 탄수화물 섭취도 상당했 으나, 여자의 경우는 사과, 감과 같은 과일과 고구마, 감자,
떡으로부터의 탄수화물 섭취가 남자에 비해 높았다. 건강 상태에 따라 비교하면, 당뇨병이나 고혈압 진단을 받은 사 람들은 라면, 빵, 커피, 설탕, 찹쌀의 순위가 다른 두 그룹에 비해 낮았고, 보리, 감, 현미의 순위가 높았다. 당뇨병이나 고 혈압 진단을 받지 않았고 대사증후군도 없는 그룹은 빵의 순위가 높고 현미의 순위가 낮은 편이었다. 탄수화물 섭취 량 사분위별로 탄수화물 급원 식품을 비교하면 감, 고구마 는 탄수화물 섭취가 높은 그룹으로 갈수록 순위가 뚜렷하 게 올라갔다. 탄수화물 섭취가 가장 낮은 사람들은 배추김 치로부터의 탄수화물 섭취도 상당하였으며, 3사분위까지는 커피가 2~3위에 나타났다. 탄수화물 섭취가 가장 높은 사 람들의 탄수화물 급원은 백미, 커피, 국수류 뿐 아니라 과 일, 떡 등 다양한 식품들이 등장하였다.
탄수화물을 공급하는 음식으로는 밥류와 밀크커피, 라면, 과일이 상위에 나타났으며, 남성의 경우 라면의 순위가 높고 칼국수와 같은 음식이 탄수화물의 주요 급원 음식으로 뽑 혔다 (Table 5). 건강 상태에 따라 비교하면 당뇨병이나 고혈 압을 진단받은 사람들의 라면, 비빔밥 등의 순위가 다른 두 그룹에 비해 낮고, 감의 순위가 높았다. 탄수화물 섭취량 수 준에 따라 순위의 차이가 뚜렷한 음식들은 비빔밥, 감, 고 구마, 배추김치, 배, 자장면, 잔치국수, 귤, 우유 등이었다.
지방 섭취량은 성별과 연령대에 따라 큰 차이를 보였으며, 남녀 모두 고령층에서 섭취량이 급격히 감소하였다 (Table 2). 전체 및 각 성별, 각 연령대에서 건강상태에 따른 평균 지방 섭취량이 유의적인 차이를 보였는데, 대체로 당뇨병이 나 고혈압을 진단받은 사람들, 대사증후군이 있는 사람들 에 비해 당뇨병이나 고혈압을 진단받지 않았고 대사증후군 이 없는 사람들의 지방 섭취량이 높은 편이었으나, 남자 30
Table 4. Odds ratios of inadequate macronutrient intake by health status
Type of inadequate macronutrient intake Control1) New MetS2)3) Control w/disease4)
OR5) OR 95% CI OR 95% CI
Unadjusted
Fat intake less than 15% of total E 1.00 1.57 1.35 1.82 2.78 2.40 3.22
Carbohydrate intake more than 70% of total E 1.00 1.46 1.25 1.70 2.41 2.10 2.77 Protein intake over 20% or less than 7% of total E 1.00 0.86 0.67 1.11 0.95 0.76 1.19 Adjusted for age and sex
Fat intake less than 15% of total E 1.00 1.08 0.92 1.27 1.11 0.93 1.33
Carbohydrate intake more than 70% of total E 1.00 1.05 0.90 1.24 1.07 0.91 1.26 Protein intake over 20% or less than 7% of total E 1.00 0.98 0.76 1.26 1.35 1.04 1.74 1) ‘Control’ are those who didn’t have metabolic syndrome, diabetes, and hypertension 2) ‘New MetS’ are those with MetS with no diabetes or hypertension diagnosed 3) Metabolic syndrome (MetS) by the modified NCEP ATP III criteria any 3 of 5 constitutes, for waist circumstances ≥ 90 cm in men, ≥ 80 cm in women, for triglyceride ≥ 150 mg/dL or on drug treatment for elevated tri- glyceride, for HDL-cholesterol < 40 mg/dL in men, < 50 mg/dL in women or on drug treatment for reduced HDL-cholesterol, for blood pressure ≥ 130 mmHg systolic blood pressure or ≥ 85 mmHg diastolic blood pressure or on antihypertensive drug treatment, for fasting glucose ≥ 100 mg/dL or on drug treatment for elevated glucose 4) ‘Control w/disease‘ are people who had been di- agnosed with diabetes or hypertension 5) Odds ratio
Table 5. Major dish and food sources of carbohydrate consumed by Korean adults
R a n k
DishFood DishFre- quency1)
Mean carbohydrate intake per frequency
2)
Rank by sex
Rank by Mets groupRank by quartiles of carbohydrate
intake FoodFre- quency1)Mean carbohydrate intake per frequency
2)
Rank by sexRank by Mets group
Rank by quartiles of carbohydrate
intake MenWomenCon- trol3)
New MetS
4)5)
Control w/dis
- ease6)Q1Q2Q3Q4MenWomenControl3)
New MetS
4)5)
Control w/dis
- ease6)Q1Q2Q3Q4 01Cooked rice6,98474.301020101021211White rice8)23,18155.4111111111 02Cooked rice with a few other grains7,03370.902010202012122Noodles82576.8232227422 03Cooked rice with beans1,05475.604030404033333Rice cake1,18945.4623458783 04Cooked rice with barley81082.805040503045544Coffee
(w/
sugar and creamer
)
8,2726.0455373238 05Coffee
(vending
machine or mix)4,41514.903050305054455Ramyeon (instant noodle)
87754.931045102347 06Cooked rice with black rice54481.107070706077888Apple1,52527.410468811994 07Ramyeon (instant noodle
)68762.5061106071066611Sugar11,2313.551276116869 08Apple1,16033.9100608090810997Glutenous rice3,07212.6879101446711 09Cooked rice with assorted grains (over 10kinds
)
56169.0080909081187712Barley5,4366.879127355513 10Persimmon68750.61108111061811109Persimmon87842.212610962212105 11Bibimbab205152.60912101316N7)19186Breads99532.411118121910111210 12Sweet potato, steamed or grilled48560.3161012110921181110Sweet potato66446.5198111392421136 13Kimchi, cabbage13,5901.713171512129101219Kimchi, cabbage17,0391.69151311129101117 14Pear50643.6151314141325151413Pear83428.5151314151627171612 15Kimbab34960.7141413152015121514Potato2,7218.4161416141416141516 16Jajangmyeon171109.5122216162428171615Wheat flour2,1569.9171615171813131718 17Noodls with soup19492.5171620171427221317Brown rice2,0819.7181822191314151421 18Orange, tangerine87320.5201517181712132018Noodles, buckwheat20198.7142118181726241814 19Milk1,25412.9211918202511141923Orange, tangerine1,08717.3241720162015182219 20Grape58127.4221819242124252316Gochujang (hot pepper paste)
5,9403.1132319202117201920 1) Every occasions each dish or food eaten. Some people might eat some dish or food many times a day 2) Total carbohydrate intake from each dish or food/frequency of each dish or food 3) ‘Control’ are those who didn’t have metabolic syndrome, diabetes, and hypertension 4) ‘New MetS’ are those with MetS with no diabetes or hyperten- sion diagnosed 5) Metabolic syndrome
(MetS
) by the modified NCEP ATP III criteria any 3 of 5 constitutes, for waist circumstances ≥ 90 cm in men, ≥ 80 cm in women, for triglyc- ≥<<eride 150 mg/dL or on drug treatment for elevated triglyceride, for HDL-cholesterol 40 mg/dL in men, 50 mg/dL in women or on drug treatment for reduced HDL-cholester- ol, for blood pressure ≥ 130 mmHg systolic blood pressure or ≥ 85 mmHg diastolic blood pressure or on antihypertensive drug treatment, for fasting glucose ≥ 100 mg/dL or on ) ) ) drug treatment for elevated glucose 6‘Control w/disease‘ are people who had been diagnosed with diabetes or hypertension 7Not found 8Rice is consumed as not only cooked rice
(white rice alone ) but also various types of cooked rice with other grain
(s) or beans.
Table 6. Major dish and food sources of fat consumed by Korean adults Rank
DishFood DishFre- quency1)Mean fat intake per frequency2)
Rank by sexRank by Mets groupRank by quartiles of fat intake FoodFre- quency1)Mean fat intake per frequency2)
Rank by sexRank by Mets groupRank by quartiles of fat intake MenWomenCon- trol3)New MetS4)5)Control w/dis- ease6)Q1Q2Q3Q4MenWomenCon- trol3)New MetS4)5)Control w/dis- ease6)Q1Q2Q3Q4 01Grilled samgyupsal (pork belly
)337 46.4 010101 01 02 N7)360801Pork3,853 10.4 01 0101 01 01 07020101 02Ramyeon (instant noodle
)687 16.4 020402 03 04 15040102Soybean oil7,520 03.0 02 02 02 02 03 09010202 03Coffee
(vending
machine or mix)4,415 02.4 030303 02 03 02020206Ramyeon (instant noodle
)877 14.7 03 06 03 03 08 22110303 04Milk1,254 07.8 060204 05 05 06030303Sesame oil13,304 00.9 05 04 04 05 04 04040505 05Cooked
rice with
a few other grains7,033 01.3 050305 04 01 01010411Beef3,426 03.5 04 05 05 04 05 11100704 06Stir-fried pork401 14.4 040906 06 08 32100604Milk1,682 06.6 08 03 06 06 09 12050408 07Kimchi stew1,131 04.5 070808 08 06 08060509Egg4,996 02.1 06 07 07 08 10 10080606 08Bibimbab205 22.1 080707 09 12 N7)261505Tofu4,430 02.2 07 09 08 07 06 06060809 09Soybean paste stew2,337 01.8 100609 07 07 04050922Soybean6,330 01.4 09 08 12 09 02 02030911 10Jajangmyeon 171 19.7 091510 11 13 N7)N7)0707Rice, polished23,181 00.4 10 10 11 10 07 01071114 11Cooked rice6,984 00.5111112 10 11 03071130Coffee
(w/
sugar and creamer)
8,272 00.9 11 11 10 11 11 03091013 12Kimchi, cabbage13,590 00.2 121313 12 10 05081233Mayonnaise654 09.6 13 12 09 14 22 N7) 25147 13Fried chicken228 12.6 141211 14 N7)N7)201013Breads995 05.2 14 13 13 15 23 24151210 14Grilled pork rib98 23.2 161918 17 N7)N7)N7)2514Coffee creamer2,390 01.9 12 16 14 12 13 13131315 15Braised pork rib with soysauce103 21.5 152416 45 N7)N7)78N7)10Soybean paste7,006 00.6 15 14 15 13 12 05121629 16Vegetable salad159 13.9 221415 18 53 N7)N7)4112Kimchi, cabbage17,039 00.2 16 17 19 16 14 08141725 17Cake81 26.9 N7) 1017 N7) N7) N7) N7) N7) 08Mackerel929 03.3 17 20 20 17 15 15161523 18Cup ramyeon114 19.0 13N7) 20 16 N7) N7) N7) 1717Chicken924 03.2 18 19 16 23 25 26191818 19Pork cutlet139 15.2 201714 27 N7)N7)472216Cake123 23.1 N7)15 17 22 N7)N7)N7)3412 20Cooked rice with beans1,054 02.0 211831 19 09 07091983Biscuits and cookies386 07.1 41 18 18 20 44 69301916 1) Every occasions each dish or food eaten. Some people might eat some dish or food many times a day 2) Total fat intake from each dish or food/frequency of each dish or food 3) ‘Control’ are those who didn’t have metabolic syndrome, diabetes, and hypertension 4) ‘New MetS’ are those with MetS with no diabetes or hypertension diagnosed 5) Metabolic syndrome
(MetS
) ≥≥≥by the modified NCEP ATP III criteria any 3 of 5 constitutes, for waist circumstances 90 cm in men, 80 cm in women, for triglyceride 150 mg/ dL or on drug treatment for elevated triglyceride, for HDL-cholesterol < 40 mg/dL in men, < 50 mg/dL in women or on drug treatment for reduced HDL-cholesterol, for blood ≥≥≥pressure 130 mmHg systolic blood pressure or 85 mmHg diastolic blood pressure or on antihypertensive drug treatment, for fasting glucose 100 mg/dL or on drug treatment for elevated glucose 6
) ‘Control w/disease‘ are people who had been diagnosed with diabetes or hypertension 7 ) Not found