Outcomes and Use of Therapeutic Drug Monitoring in Multidrug-Resistant
Tuberculosis Patients Treated in Virginia, 2009–2014
Scott K. Heysell, M.D., M.P.H.
1, Jane L. Moore, M.H.A.
2, Charles A. Peloquin, Pharm.D.
3, David Ashkin, M.D.
4and Eric R. Houpt, M.D.
11
Division of Infectious Diseases and International Health, University of Virginia, Charlottesville, VA,
2Tuberculosis Control and Newcomer Health, Virginia Department of Health, Richmond, VA,
3College of Pharmacy and Emerging Pathogens Institute, University of Florida, Gainesville, FL,
4Southeastern National Tuberculosis Center and the University of Miami, Miami, FL, USA
Background: Reports of therapeutic drug monitoring (TDM) for second-line medications to treat multidrug-resistant tuberculosis (MDR-TB) remain limited.
Methods: A retrospective cohort from the Virginia state tuberculosis (TB) registry, 2009–2014, was analyzed for TDM usage in MDR-TB. Drug concentrations, measured at time of estimated peak (C
max), were compared to expected ranges.
Results: Of 10 patients with MDR-TB, 8 (80%) had TDM for at least one drug (maximum 6 drugs). Second-line drugs tested were cycloserine in seven patients (mean C
2hr, 16.6±10.2 µg/mL; 4 [57%] below expected range); moxifloxacin in five (mean C
2hr, 3.2±1.5 µg/mL; 1 [20%] below); capreomycin in five (mean C
2hr, 21.5±14.0 µg/mL; 3 [60%] below); para- aminosalicylic acid in five (mean C
6hr, 65.0±29.1 µg/mL; all within or above); linezolid in three (mean C
2hr, 11.4±4.1 µg/mL, 1 [33%] below); amikacin in two (mean C
2hr, 35.3±3.7 µg/mL; 1 [50%] below); ethionamide in one (C
2hr, 1.49 µg/mL, within expected). Two patients died: a 38-year-old woman with human immunodeficiency virus/acquired immune deficiency syndrome and TB meningitis without TDM, and a 76-year-old man with fluoroquinolone-resistant (pre-extensively drug- resistant) pulmonary TB and low linezolid and capreomycin concentrations.
Conclusion: Individual pharmacokinetic variability was common. A more standardized approach to TDM for MDR-TB may limit over-testing and maximize therapeutic gain.
Keywords: Pharmacokinetics; Cycloserine; Capreomycin; Moxifloxacin; Linezolid
Introduction
Multidrug-resistant tuberculosis (MDR-TB) is by definition resistant to isoniazid and rifampin and consequently requires complex therapy of five or more medications of considerable toxicity but less potency and administered, in most cases, for more than 2 years
1. Globally, MDR-TB treatment outcomes re- main poor, largely due to lack of diagnosis, delay in treatment initiation, access to an expanded formulary of active drugs and the considerable public health infrastructure necessary to assist a patient to treatment completion
2. While treatment out- comes for MDR-TB in the United States have been reported as equivalent to drug-susceptible tuberculosis (TB) in some Copyright © 2015
The Korean Academy of Tuberculosis and Respiratory Diseases.
All rights reserved.
Address for correspondence: Scott K. Heysell, M.D., M.P.H.
Division of Infectious Diseases and International Health, University of Virginia, Charlottesville, P.O. Box 801340, VA 22908-1340, USA Phone: 1-434-243-9064, Fax: 1-434-924-0075
E-mail: [email protected] Received: Oct. 20, 2014 Revised: Dec. 1, 2014 Accepted: Dec. 11, 2014
cc It is identical to the Creative Commons Attribution Non-Commercial License (http://creativecommons.org/licenses/by-nc/3.0/).
settings, the total cost of treating a MDR-TB patient has been estimated at $134,000, and as high as $430,000 for extensively drug-resistant (XDR)-TB, with the majority of patients requir- ing medication changes during therapy
3-5.
In Virginia, MDR-TB cases usually comprise less than 1% of total TB annually and patients are managed with expert guid- ance from state TB consultants. Increasingly state TB consul- tants have practiced therapeutic drug monitoring (TDM) for medications in the MDR-TB regimen to assure adequate peak concentrations and minimize toxicity. Given the association of suboptimal drug concentrations with poor outcome for drug- susceptible TB
6,7, Virginia has operationalized the use of TDM for slow responders to drug-susceptible TB treatment and for all TB patients with diabetes
8. Similar state guidelines have not been applied to TDM for MDR-TB. While some centers regu- larly employ TDM for MDR-TB management
9, actual reports of TDM usage for second-line medications remain limited.
Therefore, we sought to describe TDM usage patterns and pharmacokinetics for patients treated for MDR-TB in Virginia from 2009–2014, and relate these findings to emerging trends in management.
Materials and Methods
The state TB registry was searched for all patients with My- cobacterium tuberculosis and microbiologically confirmed
resistance to isoniazid and rifampin from 2009–2014. Surveil- lance data were retrieved and included demographics (age, sex, and country of origin), comorbidities including human immunodeficiency virus and diabetes, prior TB history, and the anatomic focus of the current TB episode. Additional drug resistance results by conventional phenotypic drug- susceptibility testing was performed per routine at the state TB laboratory for isoniazid, rifampin, streptomycin, pyrazin- amide, and ethambutol, but second-line drug susceptibility was performed at one or more referral laboratories. Outcomes reported were completion of treatment, time to sputum cul- ture conversion to negative (in months for subjects with pul- monary MDR-TB), relapse following treatment completion, acquisition of new drug resistance in a TB strain previously susceptible to a given drug, and death from any cause during treatment. Information about medication-related adverse events was obtained from the state TB medical consultants.
All TDM required authorization by the state TB control office and laboratory report forms were thus reflective of ac- tual usage patterns for each patient. The standard procedure for TDM was for patients to be given their daily dose of TB medications in the morning while fasting and then observed for 2 hours, during which they were restricted from eating or drinking. At 2 hours after medication administration (C
2hr), venous blood was collected and serum was separated be- fore transport on dry ice to the referral laboratory. All TDM
was performed at the Infectious Diseases Pharmacokinetics Laboratory at the University of Florida with validated high- performance liquid chromatography, gas chromatography- mass spectrometry or colorimetric assays. The drug concen- trations were compared to the expected C
2hrranges as an estimate of peak concentration
10. For patients in whom TDM was performed for para-aminosalicylic acid, the concentration was checked at 6 hours given the known delayed peak. Some clinicians elected to check C
6hrTDM as a marker of delayed absorption for other medications in the regimen and when available these results were compared to the C
2hrresult from the same day to calculate the C
max.
Data analyses were largely descriptive with simple pro- portions reported and for continuous variables, means with standard deviation or medians with minimum and maximum values when appropriate. For the medications most frequently utilized for TDM, exploration of a demographic variable’s as- sociation with a C
2hrvalue below the expected range was cal- culated by univariable regression. The study was approved by the Institutional Review Boards at the Virginia Department of Health and the University of Virginia.
Results
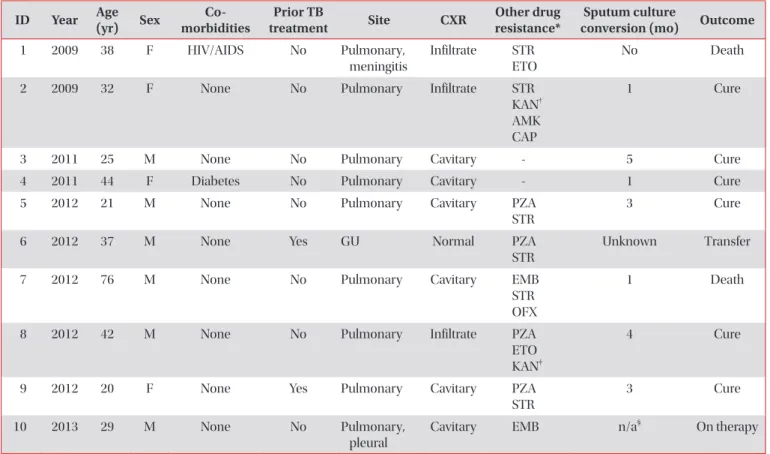
During the study period, 10 patients with MDR-TB were initiated on treatment. The mean age was 36.4±16.4 years, 6 (60%) were male, and all were foreign born (Table 1). Three patients had pre-XDR-TB including a 76-year-old man with cavitary pulmonary disease and a M. tuberculosis isolate with additional ofloxacin resistance (patient 7), a 32-year-old wom- an with non-cavitary pulmonary disease and an isolate with additional resistance to all injectable agents (patient 2), and a 42-year-old man with non-cavitary disease and kanamycin re- sistance but retained susceptibility to other injectable agents (patient 8). All patients were ultimately treated with regimens of ≥4 active drugs based on drug-susceptibility testing (Table 1). Of the five patients identified in 2012, four were genotypi- cally linked to two separate clusters.
1. TDM usage
Eight patients (80%) had TDM for at least one drug per- formed (maximum 6 drugs). Patients without TDM either died early (patient 2) or were transferred out of care (patient 6). Initial TDM was performed at a median of 6.5 weeks (minimum 2, maximum 14 weeks) after MDR-TB treatment initiation. Of the eight subjects with initial TDM, six (75%) had at least one follow-up concentration performed, though for some medications repeat testing was performed without dose adjustment (Figure 1). All dose increase or decrease led to C
2hrincrease or decrease respectively in subjects with follow-up
samples, while follow-up C
2hrconcentrations were not signifi-
cantly different if the dose was unchanged (Figure 1). Limited 6-hour concentrations for delayed absorption generally sup- ported the 2-hour result (Table 2). For the medications most frequently checked (cycloserine, capreomycin, and moxifloxa- cin), no demographic characteristic was associated with a C
2hrvalue below the expected range.
2. Low dose cycloserine
Cycloserine was the most common medication for which TDM was performed, tested in seven (88%) of patients with TDM. Cycloserine C
2hrvalues were below the expected range in 4 (57%) of initial concentrations (mean, 16.6±10.2 µg/mL) (Table 2). Five patients were treated with a 250 mg daily dose despite some recommendations of initial bid dosing or total daily doses up to 750 mg
11. All C
2hrconcentrations below the expected range were in patients on daily dosing, yet only two patients had doses subsequently changed (to 250 mg twice a day). No patient on cycloserine was reported to have experi- Table 1. Demographics and treatment outcomes for patients with multidrug-resistant TB in Virginia, 2009–2013
ID Year Age
(yr) Sex Co-
morbidities Prior TB
treatment Site CXR Other drug
resistance* Sputum culture
conversion (mo) Outcome
1 2009 38 F HIV/AIDS No Pulmonary,
meningitis
Infiltrate STR ETO
No Death
2 2009 32 F None No Pulmonary Infiltrate STR
KAN
†AMK CAP
1 Cure
3 2011 25 M None No Pulmonary Cavitary - 5 Cure
4 2011 44 F Diabetes No Pulmonary Cavitary - 1 Cure
5 2012 21 M None No Pulmonary Cavitary PZA
STR
3 Cure
6 2012 37 M None Yes GU Normal PZA
STR
Unknown Transfer
7 2012 76 M None No Pulmonary Cavitary EMB
STR OFX
1 Death
8 2012 42 M None No Pulmonary Infiltrate PZA
ETO KAN
‡4 Cure
9 2012 20 F None Yes Pulmonary Cavitary PZA
STR
3 Cure
10 2013 29 M None No Pulmonary,
pleural
Cavitary EMB n/a
§On therapy
*All patients’ Mycobacterium tuberculosis isolate with resistance to isoniazid and rifampin by conventional susceptibility testing.
†Isolate with rrs mutation.
‡Isolate with eis mutation, retained conventional susceptibility to amikacin and capreomycin.
§Patient positive culture for M.
tuberculosis from bronchoalveolar lavage sample, sputum negative.
TB: tuberculosis; Year: treatment initiation; CXR: chest X-ray; HIV: human immunodeficiency virus; AIDS: acquired immune deficiency syndrome; STR: streptomycin; ETO: ethionamide; KAN: kanamycin; AMK: amikacin; CAP: capreomycin; PZA: pyrazinamide; GU:
genitourinary; EMB: ethambutol; OFX: ofloxacin; n/a: not applicable.
Figure 1. Mean change in 2-hour concentration in repeated sam- ples with or without dose adjustment in second-line medications.
CYC: cycloserine; AMK: amikacin; CAP: capreomycin; MXF: moxi- floxacin; LNZ: linezolid. ↑: C
2hrconcentration after dose increase; ↓:
dose decrease; or ↔: no change in dose. No repeat samples from patients with initial therapeutic drug monitoring for para-aminosal- icylic acid or ethionamide.
70 60 50 40 30 20 10 C(g/mL)2hr
0
Initial Follow-up
CYC CYC AMK CAP CAP CAP MXF MXF
n=1 n=2
n=3
n=4
n=1 n=1
n=6 n=1 n=2
LNZ