Print ISSN: 2288-4637 / Online ISSN 2288-4645 doi:10.13106/jafeb.2021.vol8.no2.0195
Evaluation Factors Influencing Construction Price Index in Fuzzy Uncertainty Environment*
Phong Thanh NGUYEN 1 , Vy Dang Bich HUYNH 2 , Quyen Le Hoang Thuy To NGUYEN 3
Received: September 02, 2020 Revised: December 30, 2020 Accepted: January 08, 2021
Abstract
In recent years, Vietnam’s economic growth rate has been attributed to the growth of many well-managed industries within Southeast Asia.
Among them is the civil construction industry. Construction projects typically take a long time to complete and require a huge budget.
Many socio-economic variables and factors affect total construction project costs due to market fluctuations. In recent years, crucial socio- economic development indicators of construction reached a fairly high growth rate. Also, most infrastructure and construction projects have a high degree of complexity and uncertainty. This makes it challenging to predict the accurate project price. These challenges raise the need to recognize significant factors that influence the construction price index of civil buildings in Vietnam, both micro and macro.
Therefore, this paper presents critical factors that affect the construction price index using the fuzzy extent analysis process in an uncertain environment. This proposed quantitative model is expected to reflect the uncertainty in the process of evaluating and ranking the influencing factors of the construction price index in Vietnam. The research results would also allow project stakeholders to be more informed of the factors affecting the construction price index in the context of Vietnam’s civil construction industry. They also enable construction contractors to estimate project costs and bid rates better, enhancing their project and risk management performance.
Keywords: Construction Management, Price Index, Fuzzy Logic, Project Management, Uncertainty Environment JEL Classification Code: G32, L74, O18
1. Introduction
The economic growth rate of a developing country like Vietnam in recent years has been attributed to the development and growth of many industries including the construction industry due to rapid globalization and international market integration (Nguyen & Bui, 2020; Nguyen et al., 2018;
Phong et al., 2017). However, between 1996 and 2011, more than 70% of the 975 completed projects encountered cost deviations exceeding 10% (Zhang et al., 2019). Fluctuations in construction costs is a major risk to the contractor and the budget of the owner (Akanbi et al., 2019; Ashuri et al., 2012; Memon et al., 2010; Nguyen & Likhitruangsilp, 2017;
Sy et al., 2017; Wang & Mei, 1998; Xie & Fang, 2018).
Since construction projects take a long time to complete, the construction costs are subject to market fluctuations.
For instance, the cost of building in civil engineering and construction projects varies over time due to the complexity and high risk involved. (Dong et al., 2020; Long et al., 2019; Nguyen & Nguyen, 2020; Thong et al., 2020; Tran et al., 2018). For the success of civil construction projects,
*Acknowledgements:
[1] This research is funded by the Ministry of Education and Training, Vietnam, and Ho Chi Minh City Open University under the grant number B2019-MBS-05.
[2] The authors would like to thank the anonymous reviewers for their helpful comments and suggestions. We also would like to thank Dr.
Thu Anh Nguyen, BIM Lab Director, Ho Chi Minh City University of Technology (HCMUT), VNU-HCM; Mr. Minh Cong Pham; Mr.
Nghiem Vu Tran and Bach Khoa Construction Consultant Training Corporation for helping in this research.
1
First Author. Lecturer, Department of Project Management, Ho Chi Minh City Open University, Vietnam. Email: [email protected]
2
Head, Department of Learning Material, Ho Chi Minh City Open University, Vietnam. Email: [email protected]
3
Corresponding Author. Assistant Professor, Deputy Director, Office of Cooperation and Research Management, Ho Chi Minh City Open University, Vietnam [Postal Address: 97, Vo Van Tan Street, District 3, Ho Chi Minh City, 724000, Vietnam]
Email: [email protected]
© Copyright: The Author(s)
This is an Open Access article distributed under the terms of the Creative Commons Attribution
Non-Commercial License (https://creativecommons.org/licenses/by-nc/4.0/) which permits
unrestricted non-commercial use, distribution, and reproduction in any medium, provided the
original work is properly cited.
a construction price index is of paramount importance.
The construction price index acts as an optimal solution to cost-related issues of infrastructure and construction projects (Elfahham, 2019; Nguyen & Nguyen, 2020).
Many developed countries, such as the United States and the European Union (EU) have made substantial use of the construction price index because it helps to reliably predict project costs, prepare the budget at the initial planning level, and track and monitor costs over the life of the construction project (Saar et al., 2019; Wang & Ashuri, 2017). Therefore, this paper addresses important assessment factors that influence the construction price index using the fuzzy extent analysis process (FEAP) to precisely estimate it.
2. Literature Review
The construction price index is an efficient solution for controlling construction costs, allowing contractors to better predict costs and plan budgets to ensure winning bids (Cao & Ashuri, 2020; Dong et al., 2020; Elfahham, 2019).
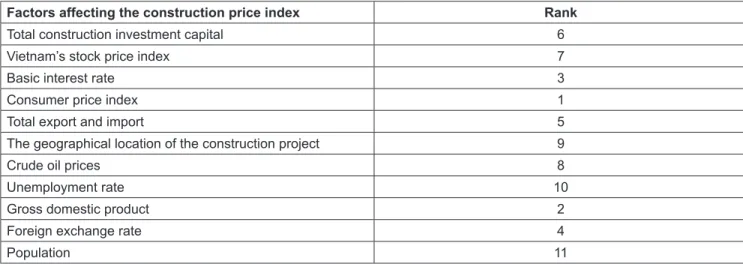
The construction price index has been extensively used by developing nations (i.e., the United States and the European Union). In the United States, Shahandashti and Ashuri (2013) indicated some factors influencing the construction price indexes, including the consumer price index, the gross domestic product, the permits for construction, the currency supply, the production cost index, the price of crude oil and the rate of jobs in the construction industry. The interest rates, investment intention, new empowerment of architects, drawing production, specifications, orders, planned job volume, and construction costs are leading factors that influence construction price indices (Akintoye et al., 1998). In Vietnam, construction price indices are published by the Department of Construction and determined for five types of construction work (civil, industrial, transport, waterworks, and technical infrastructural works). In Vietnam, nine critical factors impacting the construction price index were discussed by Nguyen and Nguyen (2020). Based on in-depth interviews of construction experts, the unemployment rate and population are added to the framework of those factors.
Besides, construction contractors in Vietnam also consider other price indicators in addition to the construction price index, such as the building price index, labor cost index, equipment cost index, material price index, etc. In essence, these price indices are subcomponents of the construction price index, as such, their discrete influence partly affects the overall construction price index.
3. Research Methodology
The fuzzy extent analysis process (FEAP) is a systematic instrument for assessing variables or factors (Chang, 1996;
Hsieh et al., 2004; Nguyen et al., 2020). It integrates the
principles of fuzziness and the analytical hierarchy process (AHP) method (Huynh et al., 2018; Lee, 2014). Fuzziness is a common characteristic of issues related to decision-making problems, along with the benefits of fuzzy logic (Duong et al., 2020; Jocic et al., 2020; Nguyen, 2020; Tomaševic et al., 2020;
Vesković et al., 2020). Fuzzy logic is a mathematical logic algorithm that solves the problem of imprecise input data values or uncertainty to make an exact judgment. Fuzzy Logic is an approach to variable processing that allows for multiple values to be processed through the same variable. Fuzzy logic attempts to solve problems with an open, imprecise spectrum of data that makes it possible to obtain an array of accurate conclusions.
(Ahad et al., 2017; Nguyen et al., 2017, 2019, 2020; Stanujkic et al., 2015). The fuzzy logic and analytical hierarchy process were conducted based on the group decision evaluation of construction experts in Vietnam. In other words, we developed all the pairwise comparison matrices based on expert input data Therefore, using the FEAP, a set of values instead of a fixed value determines a problem (Stanujkic et al., 2017, 2019).
Three main steps are presenting the calculation process of the weights of factors affecting construction price index based on fuzzy logic and analytical hierarchy process are given below (Kwong & Bai, 2003; Phong & Quyen, 2017; Thipparat et al., 2009; Zhu et al., 1999):
Let Z = { z z
1, , ,
2… z
n} be an object set, and
{
1, , ,
2 m}
V = v v … v be an objective set.
Then, the extent analysis values for each i
thobject for goals are obtained and shown as follows:
i gj
M
where i = 1, 2,..., n; j = 1, 2,…, m Step 1: Obtain priority weights
The value of fuzzy extended analysis synthetic on the i
this expressed as:
1 1 1
1 1 1
1 1 1
, , , ,
m m m
i i i i n n n
i i i
i i i
i i i
S a b c
c b a
= = =
= = =
= ⊗
∑ ∑ ∑
∑ ∑ ∑ (1)
Step 2: Comparing degrees of possibility
The degree of possibility of N
2≥ N
1is expressed as follows:
( ) ( )
2 1
2 1 1 2
1 2
2 2 1 1
1 if ( ) 0 if a
otherwise b b
V N N c
a c
b c b a
≥
≥ = ≥
−
− − −
(2)
Step 3: Obtaining the weight vector Assume that
'( ) min (
i i k)
d B = V S ≥ S (3)
for k = 1, 2,…, n; k ≠ i.
Then, the weight vector is given by:
' ( '( ), '( ), , '( ))
1 2 n TW = d B d B … d B (4)
where
B
i(i = 1,2,…, n) are n elements.
Step 4: Calculate the normalized weight vector ( ( ), ( ), , ( ))
1 2 n TW = d B d B … d B (5)
Step 5. Ranking of the factors
After having components weights, the ranking of all factors is known.
4. Results and Discussion
Experts’ synthetic fuzzy pairwise comparison matrices would be created. The weights of the critical factors influencing the construction price index are then calculated using the fuzzy scale. The normalized weight vector gained from the matrices of synthetic pairwise comparison is:
1
1 1
1 , 1 , 1
184.4710 136.2661 99.3572
n m
gij
i j
M
−
= =
=
∑∑
After applying equation (1), it is possible to evaluate the fuzzy synthetic extent values:
F1
S = (0.0474, 0.0893, 0.1686);
F2
S = (0.0431, 0.0814, 0.1583);
F3
S = (0.0542, 0.1035, 0.1947);
F4
S = (0.0641, 0.1197, 0.2167);
F5
S = (0.0493, 0.0910, 0.1656);
F6
S = (0.0460, 0.0822, 0.1492);
F7
S = (0.0465, 0.0834, 0.1516);
F8
S = (0.0401, 0.0737, 0.1404);
F9
S = (0.0588, 0.1086, 0.1951);
F10
S = (0.0516, 0.0981, 0.1845);
F11
S = (0.0376, 0.0690, 0.1319).
And
1 1
'( ) min (
k)
d B = V S ≥ S = 0.775;
2 2
'( ) min (
k)
d B = V S ≥ S = 0.711;
3 3
'( ) min (
k)
d B = V S ≥ S = 0.890;
4 4
'( ) min (
k)
d B = V S ≥ S = 1.000;
5 5
'( ) min (
k)
d B = V S ≥ S = 0.779;
6 6
'( ) min (
k)
d B = V S ≥ S = 0.694;
7 7
'( ) min (
k)
d B = V S ≥ S = 0.707;
8 8
'( ) min (
k)
d B = V S ≥ S = 0.624;
9 9
'( ) min (
k)
d B = V S ≥ S = 0.922;
10 10
'( ) min (
k)
d B = V S ≥ S = 0.848;
11 11