IEG 환경지질연구정보센터
11
0
0
전체 글
(2) 온대 낙엽 활엽수림에서의 강수량에 따른 메탄 흡수 감소. 25. due to the formation of an anaerobic condition and it decreases methanotrophic activity by reducing the oxidized zone. CH4 oxidation occurs at 20 to 60% of soil water content in dry season and it decreases at higher than 60% of soil water content in rainy reason (Castro et al., 1995). Temperate forest regions with lower precipitation are known for CH4 oxidation (Castro et al., 1995). CH4 oxidation is suppressed in wet summer due to the inhibition of oxygen diffusion and CH4 production in anoxic microsites (Itoh et al., 2009). Forest soils can emit CH4 in wet summer (e.g. Keller and Reiners., 1994; Weitz et al., 1999; Davidson et al., 2004; Vasconcelos et al., 2004; Teh et al., 2005). CH4 dynamics in forest soils may differ in regions with heavy summer precipitation. Itoh et al. (2009) reported CH4 oxidation -0.45 kg ha−1 y−1 in a dry season and CH4 emission 1.80 kg ha−1 y−1 in a rainy season. Wetting of dry soils generally increases the microbial activity within minutes (Borken et al., 2003; Lee et al., 2004; Sponseller 2007) or hours (Pulleman & Tietema., 1999; Prieme & Christensen., 2001). Diffusion of CH4 from the atmosphere into soil usually explained with Fick’s first law (Ishizuka et al., 2000; Nakano et al., 2004; Wang et al., 2014). Soil. Fig. 1. On field experimental treatments to determine the effect of variable precipitation on CH4 uptake.. water content controls CH4 uptake by regulating CH4 diffusion from the atmosphere into mineral soils (Castro et. subsoil. CH4 uptake may decrease after precipitation due to. al., 1994; Czepiel et al., 1995; Whalen and Reeburgh.,. water-filled pore space and in result limited space for. 1996). Soil wetting and drying experiments revealed. atmospheric CH4 uptake.. significant reduction in CH4 uptake with wetting (Kim et al., 2012). Kessavalou et al., (1998) reported that CH4. 2. Materials and Methods. uptake declined by about 60% after rewetting of dry soil. To best of our knowledge instant effect of variable intensity of. The experiment was conducted in a mature Platanus. precipitation on CH4 uptake has not been reported.. occidentalis forest on Hanyang University campus, Seoul,. Moreover, CH4 fluxes in forest soils are monitored weekly. Republic of Korea (37°33'33''N, 127°02'47''E). The soil. or biweekly using manually closed chamber method and. texture was sandy loam with sand, silt, and clay proportions. then results are interpolated to estimate annual fluxes.. of 55.1, 33.8, and 11.1%, respectively. Daily temperature. Instant change in CH4 flux due to precipitation may mislead. and precipitation varied between -18.6 to 36.7oC and 0.1 to. the total annual CH4 flux. Precipitation varies throughout a. 260 mm, respectively (Korea Metrological Administration. year and this variation affects soil moisture, which thereby. 2010-2017).. affects CH4 uptake or emission. The objectives of this study. Three experimental plots were located as shown in Fig. 1.. were to investigate the instant effect of variable precipi-. Each plot was 40 × 260 cm and distance between two. tation on CH4 uptake and to estimate the contribution of. adjacent plots was 10 cm. Each plot comprised with five. precipitation in reducing net CH4 uptake in temperate forest.. treatments such as P-0, P-10, P-20, P-40, and P-80, where. We hypothesized that CH4 emission will occur when it. (P) is precipitation and the number followed by P is amount. starts to rain because rain water will replace CH4 present in. of the water equivalent to precipitation (mm day−1). The J. Soil Groundwater Environ. Vol. 24(1), p. 24~34, 2019.
(3) 나다르 후세인 코카르·박재우. 26. water 0.34, 0.67, 1.35, and 2.69 L was sprayed in P-10, P-. where F is the hourly CH4 flux (μg m−2 h−1), V is the gas. 20, P-40, and P-80, respectively. Water was sprayed inside. volume (m3), A is the area of the chamber base (m2), and. the chamber bases on alternate gas sampling days. When. dc ----- is the rate of CH4 concentration change over a 60 min dt. water was not sprayed we assume no precipitation (NP),. period in the chamber (μg m−3 h−1).. henceforth mentioned as (NP-0, NP-10, NP-20, NP-40, and. Temperatures of ambient air, the air inside the chamber,. NP-80). To minimize soil disturbance, one plot was. and the soil were recorded at the time of CH4 sampling. Soil. exclusively dedicated for soil sampling and remaining two. temperature and water content were monitored at 10, 20,. plots were used for gas sampling. P-0 was used as control. and 30 cm depth of one plot on each sampling day. Soil. treatment and water was not sprayed in this treatment. The. samples were collected inside the chambers using a. volume of water for corresponding precipitation that was. sampling tube with 2.5 cm internal diameter and 100 cm. calculated by using guidelines of food and agriculture. height. Soil gravimetric water content (θg) was determined. organization (Dastane 1978). The volume of water used in. using the oven drying method at the controlled temperature. this experiment was within the range of average daily. of 105oC for 24 h. Bulk density (ρb) of soil was measured. precipitation 0.1 to 260 mm in 2010-2017 (Korea Metrological. before and after the experiment at 10, 20 and 30 cm depth. Administration. water. using core sampler. Soil samples for bulk density were. corresponded to precipitation below 10 mm was too low to. collected outside and inside of each chamber before and. spray on given surface area of chamber. Precipitation above. after experiment, respectively. The volumetric water content. 80 mm was much higher than the volume of closed chamber. (θv) was calculated as:. 2010-2017).. The. volume. of. above ground. Therefore, treatments for precipitation below 10 mm and above 80 mm were not installed were not. θv = ρb × θg. (2). Volumetric water content was converted into absolute air-. installed. Five polyvinyl chloride (PVC) chamber bases of (20 cm. filled porosity (AFP, cm3 cm−3) knowing the bulk density. diameter and 20 cm height) were randomly inserted 5 cm. (ρb) and the particle density of soil (ρs) with the equation. into the ground in each plot. An air-tight lid made of PVC. (Epron et al., 2016):. was kept on the chamber base for one hour and a 30 mL gas sample was collected from the chamber at 0, 15, 30, 45 and. AFP = ( 1 – ρb ⁄ ρs ) – θv. (3). 60 min after chamber closure. All gas samples were stored. Soil particle density (ρs) was assumed 2.65 g cm−3 of. in 25 mL glass vials sealed with aluminum caps and gray. rock, sand grains and other soil mineral particles (Gao et al.,. butyl septa. Samplings were conducted between 09:00 to. 2018; Zhu et al., 2013). The water-filled pore space. 10:00 between 14th September to 15th October in 2018. (WFPS) was calculated with the equation (Gao et al., 2018):. every third day. Gas samples were analyzed using a gas chromatograph (YL 6100, Young Lin Instrument Co., Korea) equipped with a flame ionization detector and GSAlumina Agilent column (length, 50 m; inner diameter,. WFPS = θv ⁄ ( 1 – ρb ⁄ 2.65 ). (4). Both AFP and WFPS were then converted in percent by multiplying with 100.. 0.53 mm). The temperatures of the column, injector, and detector were 120, 250, and 250oC, respectively. Helium −1. was used as the carrier gas at a flow rate of 30 ml min .. 2.1. Statistical analysis The SPSS 20 statistical software package was used for. Hourly CH4 flux was calculated from the change in gas. statistical analysis. Independent-sample t-test was used to. concentration over 60 min chamber closure for first. test the significant difference between control and litter P-. experiment and 30 min closure for second experiment. (0-80) and NP-(0-80) treatments. One-way ANOVA was. (Rolston 1986):. used to test the significant difference between the results of CH4 emission in all treatments of P-(0-80) and NP-(0-80).. V dc 273 F = --- × ----- × ⎛ -----------------⎞ A dt ⎝ 273 + T⎠. (1). J. Soil Groundwater Environ. Vol. 24(1), p. 24~34, 2019. The difference level was set at p<0.05. linear regression.
(4) 온대 낙엽 활엽수림에서의 강수량에 따른 메탄 흡수 감소. 27. analysis was performed to establish correlation between CH4 uptake and (soil moisture content, soil temperature, AFP, and WFPS).. 3. Results and discussion Average CH4 uptake in the entire experimental period was 30.6, 8.3, 5.6, 5.5, and 4.4 µg m−2 h−1 in P-0, P-10, P20, P-40, and P-80, respectively. Average CH4 uptake 29.3, 42.5, 44.4, 26.2, and 21.7 was observed in NP-0, NP-10, NP-20, NP-40, and NP-80, respectively (Fig. 2a). Average CH4 uptake in P-0, P-10, P-20, P-40, and P-80 was 5, 80, 87, 79, and 80%, respectively, lower than NP-0, NP-10, NP-20, NP-40, and NP-80, respectively. Average CH4 uptake in P-(10-80) was significantly lower than NP-(1080) treatments (p=0.05). No significant difference was observed in control treatments P-0 and NP-0 (p=0.05). In all treatments, soil temperature decreased consistently throughout the experimental period (Fig. 2b). Maximal and minimal soil temperature was observed on September and October, respectively. Average soil temperature 17.9, 18.2, 18.5, 19.7, and 20.7oC was observed in P-0, P-10, P-20, P-40, and P-80, respectively. Relatively low temperature 16.4, 16.2, 16.1, 16.3, and 16.6 oC was observed in NP-0, NP-10,. Fig. 2. (a), CH4 flux; (b), soil temperature; and (c), soil water content with variable precipitation 0, 10, 20, 40, and 80 mm per day. Error bars represent ±1 standard error of mean. *water was applied on these dates.. NP-20, NP-40, and NP-80, respectively. Soil temperature was not significantly different among the treatments in both. 0.40, 0.64, 0.10, 0.40, and 0.96, respectively).. P (0-80) and NP (0-80) (p=0.05). Soil temperature was. Average soil air filled porosity in 0-10 cm soil depth was. positively correlated with CH4 uptake in P-0, P-10, P-20, P-. 48.1, 43.0, 36.2, 37.9, and 33.9%, in P-0, P-10, P-20, P-40,. 2. 40, and P-80 (R =0.14, 0.49, 0.17, 0.44, and 0.12, respec-. and P-80, respectively. AFP in 10-20 cm soil depth was. tively). Soil temperature was also positively correlated with. 39.0, 23.3, 31.2, 25.9, and 21.2%, in P-0, P-10, P-20, P-40,. CH4 uptake in NP-0, NP-10, NP-20, NP-40, and NP-80. and P-80, respectively. AFP in 20-30 cm soil depth was. 2. (R =0.74, 0.65, 0.57, 0.03, and 0.29, respectively). Average. 40.7, 31.5, 33.6, 25.8, and 23.4%, in P-0, P-10, P-20, P-40,. soil water content in entire experimental period was 20.8,. and P-80, respectively. Average AFP in all soil depths (0-30. 26.2, 24.4, 24.4, and 27.2% in P-0, P-10, P-20, P-40, and P-. cm) of P-10 treatment was not significantly different form. 80, respectively. Average soil water content in NP-0, NP-. P-0 (p=0.05). Average AFP in all soil depths (0-30 cm) of. 10, NP-20, NP-40, and NP-80 was 22.3, 21.7, 20.5, 20.7,. P-20, P-40, and P-80 treatment was significantly different. and 24.5, respectively. Statistically there was no significant. form P-0 (p=0.05). CH4 uptake was positively correlated. difference in P (0-80) and NP (0-80) (p=0.05). Average soil. with AFP in all soil depths (0-30 cm) and all treatments. water content was positively correlated with average CH4. (Fig. 3). CH4 uptake decrease significantly in P-80 due to. 2. uptake in P-0, P-10, P-20, P-40, and P-80 (R =0.84, 0.61,. lowest AFP. CH4 uptake was weakly correlated with AFP. 0.40, 0.64, and 0.13, respectively). Average soil water. (P-80) in all soil depths (0-30 cm). Average AFP in soil. content was also positively correlated with average CH4. depths 0-10, 10-20, and 20-30 cm in NP-0, NP-10, NP-20,. 2. uptake in NP-0, NP-10, NP-20, NP-40, and NP-80 (R =. NP-40, and NP-80 treatments was (50.2, 46.6, 41.78, 39.5, J. Soil Groundwater Environ. Vol. 24(1), p. 24~34, 2019.
(5) 28. 나다르 후세인 코카르·박재우. Fig. 3. Relationships (a-e, P (0-80) and a-e, NP (0-80)) between CH4 emission and soil air filled porosity in different soil depths (0-10, 1020, and 20-30 cm).. and 35.2%), (37.8, 36.0, 36.3, 31.3, 25.2%), and (35.6, 38.3,. significantly in NP-(10-80) as compare to P- (10-80) due to. 34.8, 32.0, 27.9%), respectively. Average AFP soil depth 0-. increase in AFP. CH4 uptake was positively correlated with. 10 cm in treatments NP-40 and NP-80 were only significantly. AFP in NP-(0-40) and negatively correlated in NP-80 in all. different from NP-0 (p=0.05). All other treatments NP (10-. soil depths 0-30 cm. Negative correlation in NP-80 was due. 80) in all depths (0-30 cm) ware not significantly different. to lowest AFP as compared to NP-(0-40). Soil CH4 uptake. from NP-0. This indicates soil water content was. significantly increased as AFP increased (Díaz et al., 2018).. significantly evaporated form all treatments NP- (10-80). Relationship between WFPS and CH4 uptake in all. and all soil depths (0-30 cm). CH4 uptake increased. treatments was exactly opposite to relationship between. J. Soil Groundwater Environ. Vol. 24(1), p. 24~34, 2019.
(6) 온대 낙엽 활엽수림에서의 강수량에 따른 메탄 흡수 감소. 29. Fig. 4. Relationships (a-e, P-(0-80) and NP-(0-80)) between CH4 emission and soil water filled pore space in different soil depths (0-10, 10-20, and 20-30 cm).. AFP and CH4 uptake (Fig. 4). CH4 uptake was negatively. Immediate effect of water application on CH4 reduction. correlated with WFPS in all treatments P-(0-80) and NP-(0-. was prominent. CH4 uptake in P-(10-80) was extrapolated. 40). CH4 uptake was positively correlated with WFPS in all. to actual precipitation in 2017 (Fig. 5). Hourly precipitation. treatments NP-80). Positive correlation in NP-80 was due to. varied between 0.0042 to 6.021 mm m−2 h−1 (Korea. highest WFPS as compared to NP-(0-40). WFPS in all soil. Metrological Administration 2017). Estimated daily CH4. depths (0-30 cm) of P-(10-80) and NP-(10-80) was not. uptake due to precipitation was calculated by extrapolation. significantly different from P-0 and NP-80, respectively. of field results. Since, average CH4 uptake in P-(20-80) was. (p=0.05).. not significantly different from each other, CH4 uptake at PJ. Soil Groundwater Environ. Vol. 24(1), p. 24~34, 2019.
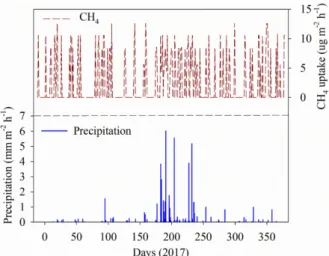
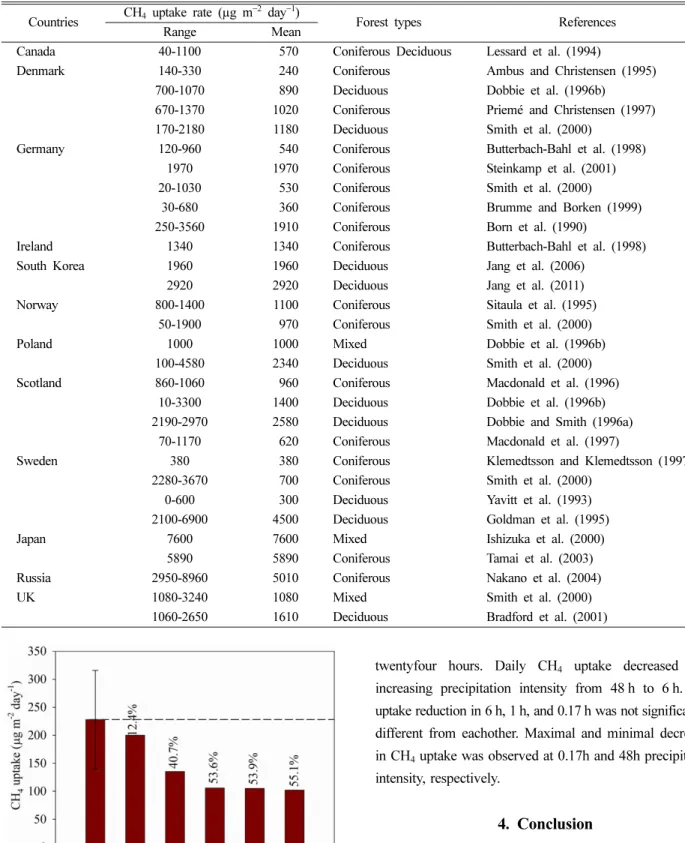
(7) 30. 나다르 후세인 코카르·박재우. Fig. 7. CH4 uptake at different intensities of precipitation. Fig. 5. Average daily precipitation, estimated average daily CH4 uptake, South Korea.. study was decreased by 11.3 and 4.2%. Total estimated CH4 uptake in this study was not significantly different from weekly and biweekly CH4 uptake subtracted data (p=0.05). CH4 uptake at variable intensity of precipitation was calculated by interapolation of CH4 uptake results in this study (Fig. 7). Maximal total precipitation in 2017 was 372.7, 370.1, 275, 112.5, and 39.2 mm in 48 h, 24 h, 6 h, 1 h, and 0.17 h, respectively (Korea Metrological Administration 2017). Precipitation intensity increased with decresing total precipitation time. Maximal and minimal precipitation was observed at 0.17 and 48 h, respectively. CH4 uptake decreased with increasing precipitation intensity. CH4 uptake in 24, 6, 1, and 0.17 h was 32.5, 47.2, 47.5, and. Fig. 6. Estimated total CH4 uptake (2017) in this study and its difference (%) with weekly and biweekly sampling frequencies.. 48.9% lower than CH4 uptake in 48 h, respectively. CH4 uptake in 6, 1 and 0.17 h was not significantely different from each other. CH4 uptake esponse to precipitation. −2. −1. 80 was assumed same for precipitation above 80 mm m h . Minimal and maximal CH4 uptake 4.4 and 12.6 µg m−2 h−1 was observed at precipitation 80 and 0.1 mm m. −2. −1. h ,. respectively.. intensity was in agreement with CH4 uptake in this study. Average annual CH4 uptake in temperate forests of different countries varied between 240 to 5890 µg m−2 day−1 as shown in Table 1. Annual CH4 uptake in the temperate. Effect of CH4 sampling frequency (weekly and biweekly). forest of South Korea has been reported 1960 to 2920 µg. on estimated total CH4 uptake 2017 was compared (Fig. 6).. m−2 day−1 with an average uptake 2440 µg m−2 day−1.. The most common CH4 sampling frequencies in temperate. Mininal and maximal daily CH4 uptake in this study was. forests have been reported weekly and biweekly (Brumme. 186.2 and 957.0 µg m−2 day−1, respectively. This indicates. and Borken., 1999; Kim et al., 2016; Kirschke et al., 2013).. that the experimental results from this research is not very. We assumed that CH4 uptake was measured on weekly or. different from the previous reports. It also confirms that the. biweekly from the field. Weekly and biweekly data of daily. experimental procedure in this research is sound and. CH4 uptake was subtracted from estimated CH4 uptake in. comparable to the others. Average CH4 uptake in (P-0+NP-. 2017. After subtracting weekly and biweekly CH4 uptake,. 0) was compared with reduced CH4 uptake due to variable. total estimated CH4 uptake was 18.2 and 19.7 mg m−2 y−1,. precipitation intensities as shown in Fig. 8. Hourly CH4. respectively. Total estimated CH4 uptake in 2017 in this. uptake was converted to daily uptake by multiplied with. J. Soil Groundwater Environ. Vol. 24(1), p. 24~34, 2019.
(8) 온대 낙엽 활엽수림에서의 강수량에 따른 메탄 흡수 감소. 31. Table 1. Summary of published CH4 uptake in temperate forests Countries Canada Denmark. Germany. Ireland South Korea Norway Poland Scotland. Sweden. Japan Russia UK. CH4 uptake rate (µg m−2 Range 40-1100 140-330 700-1070 670-1370 170-2180 120-960 1970 20-1030 30-680 250-3560 1340 1960 2920 800-1400 50-1900 1000 100-4580 860-1060 10-3300 2190-2970 70-1170 380 2280-3670 0-600 2100-6900 7600 5890 2950-8960 1080-3240 1060-2650. day−1) Mean 570 240 890 1020 1180 540 1970 530 360 1910 1340 1960 2920 1100 970 1000 2340 960 1400 2580 620 380 700 300 4500 7600 5890 5010 1080 1610. Forest types. References. Coniferous Deciduous Coniferous Deciduous Coniferous Deciduous Coniferous Coniferous Coniferous Coniferous Coniferous Coniferous Deciduous Deciduous Coniferous Coniferous Mixed Deciduous Coniferous Deciduous Deciduous Coniferous Coniferous Coniferous Deciduous Deciduous Mixed Coniferous Coniferous Mixed Deciduous. Lessard et al. (1994) Ambus and Christensen (1995) Dobbie et al. (1996b) Priemé and Christensen (1997) Smith et al. (2000) Butterbach-Bahl et al. (1998) Steinkamp et al. (2001) Smith et al. (2000) Brumme and Borken (1999) Born et al. (1990) Butterbach-Bahl et al. (1998) Jang et al. (2006) Jang et al. (2011) Sitaula et al. (1995) Smith et al. (2000) Dobbie et al. (1996b) Smith et al. (2000) Macdonald et al. (1996) Dobbie et al. (1996b) Dobbie and Smith (1996a) Macdonald et al. (1997) Klemedtsson and Klemedtsson (1997) Smith et al. (2000) Yavitt et al. (1993) Goldman et al. (1995) Ishizuka et al. (2000) Tamai et al. (2003) Nakano et al. (2004) Smith et al. (2000) Bradford et al. (2001). twentyfour hours. Daily CH4 uptake decreased with increasing precipitation intensity from 48 h to 6 h. CH4 uptake reduction in 6 h, 1 h, and 0.17 h was not significantely different from eachother. Maximal and minimal decreased in CH4 uptake was observed at 0.17h and 48h precipitation intensity, respectively.. 4. Conclusion We measured CH4 uptake in temperate plantation from Fig. 8. Comparison of CH4 uptake in this study with reduced CH4 uptake due to variable precipitation intensity. Error bar represent ±1 standard error of mean.. different treatments of variable precipitation, i.e., 0, 10, 20, 40, and 80 mm m−2 day−1. CH4 flux was observed immediately after water application in P-(10-80) and observed after two J. Soil Groundwater Environ. Vol. 24(1), p. 24~34, 2019.
(9) 나다르 후세인 코카르·박재우. 32. days interval when water was not applied NP-(0-80). CH4 uptake in P-(10-80) was significantly lower than NP-(1080). In our first hypothesis we assumed CH4 emission may occur because rain water will replace CH4 present in subsoil. Throughout the experimental period temperate forest soil was CH4 sink rather than source. CH4 uptake decreased significantly due to increasing water application in P-(10-80). We also hypothesized that CH4 uptake will decrease with increasing WFPS, in P-80 WFPS was 53% higher than P-0 CH4 uptake decreased 85.6% in P-80. This decrease in CH4 uptake was positively correlated with air filled porosity and negatively correlated with water filled pore space. Soil texture at experimental site was sandy loam, which is relatively coarse texture further studies needed to establish if the relationship between variable precipitation to CH4 uptake holds true across different soil texture classes. Our results can be used as a reference for regions with similar conditions. This study demonstrated the effects of variable precipitation on net daily CH4 uptake and it may help in calculating more accurate net annual CH4 sink in temperate forests in the world.. Acknowledgements This study was supported by the Basic Science Research Program through the National Research Foundation of Korea (NRF) funded by the Ministry of Science, ICT, & Future Planning (NRF-2018R1A2A1A05023555).. References Ambus, P. and Christensen, S., 1995, Spatial and seasonal nitrous oxide and methane fluxes in Danish forest-, grassland-, and agroecosystems, J Environ Qual, 24(5), 993-1001. Borken, W., Davidson, E.A., Savage, K., Gaudinski, J., and Trumbore, S.E., 2003, Drying and wetting effects on CO2 release from organic horizons, Soil Sci Soc Am J, 67, 1888-1897. Born, M., Dorr, H., and Levin, I., 1990, Methane consumption in aerated soils of the temperate zone, Tellus B, 42(1), 2-8. Bradford, M., Wookey, P., Ineson, P., and Lappin-Scott, H., 2001, Controlling factors and effects of chronic nitrogen and sulphur deposition on methane oxidation in a temperate forest soil, Soil Biol Biochem, 33(1), 93-102. Brumme, R. and Borken, W., 1999, Site variation in methane J. Soil Groundwater Environ. Vol. 24(1), p. 24~34, 2019. oxidation as affected by atmospheric deposition and type of temperate forest ecosystem, Global Biogeochem Cy, 13(2), 493-501. Butterbach-Bahl, K., Gasche, R., Huber, C., Kreutzer, K., and Papen, H., 1998, Impact of N-input by wet deposition on Ntrace gas fluxes and CH4-oxidation in spruce forest ecosystems of the temperate zone in Europe, Atmos Environ, 32(3), 559564. Castro, M.S., Melillo, J.M., Steudler, P.A., and Chapman, J.W., 1994, Soil moisture as a predictor of methane uptake by temperate forest soils, Can J For Res, 24(9), 1805-1810. Castro, M.S., Steudler, P.A., Melillo, J.M., Aber, J.D., and Bowden, R.D., 1995, Factors controlling atmospheric methane consumption by temperate forest soils, Global Biogeochem Cycles, 9(1), 1-10. Czepiel, P., Crill, P., and Harriss, R., 1995, Environmental factors influencing the variability of methane oxidation in temperate zone soils, J Geophys Res Atmos, 100(D5), 9359-9364. Dalal, R., Allen, D., Livesley, S., and Richards, G., 2008, Magnitude and biophysical regulators of methane emission and consumption in the Australian agricultural, forest, and submerged landscapes: a review, Plant and Soil, 309(1-2), 43-76. Dastane, N.G., 1978, Effective Rainfall in irrigated agriculture, Irrigation and Drainage Paper No. 25, Food and Agriculture Organization, Rome, Italy, www.fao.org/docrep/X5560E/ x5560e00.htm#Contents. Davidson, E.A., Ishida, F.Y., and Nepstad, D.C., 2004, Effects of an experimental drought on soil emissions of carbon dioxide, methane, nitrous oxide, and nitric oxide in a moist tropical forest, Global Change Biol, 10(5), 718-730. Díaz, M.A., Bown, H.E., Fuentes, J.P., and Martínez, A.M., 2018, Soils act as sinks or sources of CH4 depending on airfilled porosity in sclerophyllous ecosystems in semiarid central Chile, Appl Soil Ecol, 130, 13-20. Dobbie, K. and Smith, K., 1996a, Comparison of CH4 oxidation rates in woodland, arable and set aside soils, Soil Biol Biochem, 28(10-11), 1357-1365. Dobbie, K., Smith K., Prieme, A., Christensen, S., Degorska, A., and Orlanski, O., 1996b, Effect of land use on the rate of methane uptake by surface soils in northern Europe, Atmos Environ, 30(7), 1005-1011. Dutaur, L. and Verchot, L.V., 2007, A global inventory of the soil CH4 sink, Global Biogeochem Cycles, 21(4), 1-9. Epron, D., Plain, C., Ndiaye, F.-K., Bonnaud, P., Pasquier, C., and Ranger, J., 2016, Effects of compaction by heavy machine traffic on soil fluxes of methane and carbon dioxide in a temperate broadleaved forest, Forest Ecol Manag, 382, 1-9. Gao, J., Zhou, W., Liu, Y., Zhu, J., Sha, L., Song, Q., Ji, H., Lin,.
(10) 온대 낙엽 활엽수림에서의 강수량에 따른 메탄 흡수 감소. Y., Fei, X., Bai, X., Zhang, X., Deng, Y., Deng, X., Yu, G., Zhang, J., Zheng, X., Grace, J., and Zhang, Y., 2018, Effects of Litter Inputs on N2O Emissions from a Tropical Rainforest in Southwest China, Ecosystems, 21(5), 1013-1026. Goldman, M.B., Groffman, P.M., Pouyat, R.V., McDonnell, M.J., and Pickett, S.T., 1995, CH4 uptake and N availability in forest soils along an urban to rural gradient, Soil Biol Biochem, 27(3), 281-286. Gütlein, A., Zistl-Schlingmann, M., Becker, JN., Cornejo, N.S., Detsch, F., Dannenmann, M., Appelhans, T., Hertel, H., Kuzyakov, Y., and Kiese, R., 2017, Nitrogen turnover and greenhouse gas emissions in a tropical alpine ecosystem, Mt. Kilimanjaro, Tanzania, Plant and soil, 411(1-2), 243-259. IPCC, 2014, The Scientific Basis. Contribution of Working Group I to the Fifth Assessment Report of the intergovernmental Panel on Climate Change Cambridge University Press, Cambridge, United Kingdom and New York, NY, USA, 1535. Ishizuka, S., Sakata, T., and Ishizuka, K., 2000, Methane oxidation in Japanese forest soils, Soil Biol Biochem, 32(6), 769-777. Itoh, M., Ohte, N., and Koba, K., 2009, Methane flux characteristics in forest soils under an East Asian monsoon climate, Soil Biol Biochem, 41(2), 388-395. Jang, I., Lee, S., Hong, J.-H., and Kang, H., 2006, Methane oxidation rates in forest soils and their controlling variables: a review and a case study in Korea, Ecol Res, 21(6), 849-854. Jang, I., Lee, S., Zoh, K.-D., and Kang, H., 2011, Methane concentrations and methanotrophic community structure influence the response of soil methane oxidation to nitrogen content in a temperate forest, Soil Biol Biochem, 43(3), 620-627. Keller, M. and Reiners, W.A., 1994, Soilatmosphere exchange of nitrous oxide, nitric oxide, and methane under secondary succession of pasture to forest in the Atlantic lowlands of Costa Rica, Global Biogeochem Cycles, 8(4), 399-409. Kessavalou, A., Doran, J.W., Mosier, A.R., and Drijber, R.A., 1998, Greenhouse gas fluxes following tillage and wetting in a wheat-fallow cropping system, J Environ Qual, 27(5), 11051116. Kim, D.G., Thomas, A.D., Pelster, D., Rosenstock, T.S., and Sanz-Cobena, A., 2016, Greenhouse gas emissions from natural ecosystems and agricultural lands in sub-Saharan Africa: synthesis of available data and suggestions for further research, Biogeosciences, 13(16), 4789-4809. Kim, D.-G., Vargas, R., Bond-Lamberty, B., and Turetsky, M., 2012, Effects of soil rewetting and thawing on soil gas fluxes: a review of current literature and suggestions for future research, Biogeosciences, 9(7), 2459-2483. Kirschke, S., Bousquet, P., Ciais, P., Saunois, M., Canadell, J.G., Dlugokencky, E.J., Bergamaschi, P., Bergmann, D., Blake, D.R.,. 33. Bruhwiler, L., Cameron-Smith, P., Castaldi, S., Chevallier, F., Feng, L., Fraser, A., Heimann, M., Hodson, E.L., Houweling, S., Josse, B., Fraser, P.J., Krummel, P.B., Lamarque, J., Langenfelds, R.L., Quéré, C.L., Naik, V., O'Doherty, S., Palmer, P.I., Pison, I., Plummer, D., Poulter, B., Prinn, R.G., Rigby, M., Ringeval, B., Santini, M., Schmidt, M., Shindell, D.T., Simpson, I.J., Spahni, R., Steele, L.P., Strode, S.A., Sudo, K., Szopa, S., van der Werf, G.R., Voulgarakis, A., Weele, M.V., Weiss, R.F., Williams, J.E., and Zeng, G., 2013, Three decades of global methane sources and sinks, Nat Geosci, 6(10), 813. Klemedtsson, Å.K. and Klemedtsson, L., 1997, Methane uptake in Swedish forest soil in relation to liming and extra N-deposition, Biol. Fertil. Soils, 25(3), 296-301. Lee, X., Wu, H.J., Sigler, J., Oishi, C., and Siccama, T., 2004, Rapid and transient response of soil respiration to rain, Global Change Biol, 10, 1017-1026. Le Mer, J. and Roger, P., 2001, Production, oxidation, emission and consumption of methane by soils: A review, Eur J Soil Biol, 37(1), 25-50. Lessard, R., Rochette, P., Toppt, E., Patteyt, E., Desjardins, R.L., and Beaumont, G., 1994, Methane and carbon dioxide fluxes from poorly drained adjacent cultivated and forest sites, Can J Soil Sci, 74(2), 139-146. MacDonald, J.A., Skiba, U., Sheppard, L.J., Hargreaves, K.J., Smith, K.A., and Fowler, D., 1996, Soil environmental variables affecting the flux of methane from a range of forest, moorland and agricultural soils, Biogeochemistry, 34(3), 113-132. MacDonald, J.A., Skiba, U., Sheppard, L.J., Ball, B., Roberts, J.D., Smith, K.A., and Fowler, D., 1997, The effect of nitrogen deposition and seasonal variability on methane oxidation and nitrous oxide emission rates in an upland spruce plantation and moorland, Atmos. Environ, 31(22), 3693-3706. Moore, B., Kaur, G., Motavalli, P., Zurweller, B., and Svoma, B., 2018, Soil greenhouse gas emissions from agroforestry and other land uses under different moisture regimes in lower Missouri River Floodplain soils: a laboratory approach, Agroforest Syst, 92(2), 335-348. Nakano, T., Inoue, G., and Fukuda, M., 2004, Methane consumption and soil respiration by a birch forest soil in West Siberia, Tellus B Chem Phys Meteorol, 56(3), 223-229. Nakano, T., Sawamoto, T., Morishita, T., Inoue, G., and Hatano, R., 2004, A comparison of regression methods for estimating soil-atmosphere diffusion gas fluxes by a closed-chamber technique, Soil Biol Biochem, 36(1), 107-113. Ojima, D., Valentine, D., Mosier, A., Parton, W., and Schimel, D., 1993, Effect of land use change on methane oxidation in temperate forest and grassland soils, Chemosphere, 26(1-4), 675-685. J. Soil Groundwater Environ. Vol. 24(1), p. 24~34, 2019.
(11) 34. 나다르 후세인 코카르·박재우. Prieme, A. and Christensen S., 2001, Natural perturbations, drying-wetting and freezing-thawing cycles, and the emission of nitrous oxide, carbon dioxide and methane from farmed organic soils, Soil Biol Biochem, 33, 2083-2091. Priemé, A. and Christensen, S., 1997, Seasonal and spatial variation of methane oxidation in a Danish spruce forest, Soil Biol Biochem, 29(8), 1165-1172. Pulleman, M. and Tietema A., 1999, Microbial C and N transformation during drying and rewetting of coniferous forest floor material, Soil Biol Biochem, 31, 275-285. Reeburgh, W.S., 2003, Global methane biogeochemistry, Treatise on geochemistry, 4, 347. Rolston, D.E., 1986, Gas Flux, In: Klute, A. (ed.), Methods of Soil Analysis: Part 1-Physical and Mineralogical Methods, Soil Science Society of America, p. 1103-1119. Sitaula, B.K., Bakken, L.R., and Abrahamsen, G., 1995, CH4 uptake by temperate forest soil: effect of N input and soil acidification, Soil Biol Biochem, 27(7), 871-880. Smith, K.A., Dobbie, K.E., Ball, B.C., Bakken, L.R., Sitaula, B.K., Hansen, S., Brumme, R., Borken, W., Christensen, S., Priemé, A., Fowler, D., Macdonald, J.A., Skiba, U., Klemedtsson, L., Kasimir-Klemedtsson, A., Degórska, A., and Orlanski, P., 2000, Oxidation of atmospheric methane in Northern European soils, comparison with other ecosystems, and uncertainties in the global terrestrial sink, Global Change Biol, 6(7), 791-803. Smith, K.A., Ball, T., Conen, F., Dobbie, K.E., Massheder, J., and Rey, A., 2003, Exchange of greenhouse gases between soil and atmosphere: interactions of soil physical factors and biological processes, Eur J Soil Sci, 54(4), 779-791. Sponseller, R.A., 2007, Precipitation pulses and soil CO2 flux in a Sonoran Desert ecosystem, Global Change Biol, 13, 426-436. Steinkamp, R., Butterbach-Bahl, K., and Papen, H., 2001, Methane oxidation by soils of an N limited and N fertilized spruce forest in the Black Forest, Germany, Soil Biol Biochem, 33(2), 145-153. Tamai, N., Takenaka, C., Ishizuka, S., and Tezuka, T., 2003, Methane flux and regulatory variables in soils of three equal-. J. Soil Groundwater Environ. Vol. 24(1), p. 24~34, 2019. aged Japanese cypress (Chamaecyparis obtusa) forests in central Japan, Soil Biol Biochem, 35(5), 633-641. Teh, Y.A., Silver, W.L., and Conrad, M.E., 2005, Oxygen effects on methane production and oxidation in humid tropical forest soils, Global Change Biol, 11(8), 1283-1297. Vasconcelos, S.S., Zarin, D.J., Capanu, M., Littell, R., Davidson, E.A., Ishida, F.Y., Santos, E.B., Araújo, M.M., Aragão, D.V., Rangel-Vasconcelos, L.G.T., Oliveira, F.D.A., McDowell, W.H., and de Carvalho, C.J.R., 2004, Moisture and substrate availability constrain soil trace gas fluxes in an eastern Amazonian regrowth forest, Global Biogeochem Cycles, 18(2), 1-10 Von Fischer, J.C. and Hedin, L.O., 2007, Controls on soil methane fluxes: Tests of biophysical mechanisms using stable isotope tracers, Global Biogeochem Cycles, 21(2), 1-9. Wang, Y., Hu, C., Ming, H., Oenema, O., Schaefer, D.A., Dong, W., Zhang, Y., and Li, X., 2014, Methane, carbon dioxide and nitrous oxide fluxes in soil profile under a winter wheat-summer maize rotation in the North China Plain, PloS one, 9(6): e98445. Wei, H., Peng, C., Liu, S., Liu, X., Li, P., Song, H., Yuan, M., and Wang, M., 2018, Variation in Soil Methane Fluxes and Comparison between Two Forests in China, Forests, 9(4), 204. Weitz, A.M., Keller, M., Linder, E., and Crill, P., 1999, Spatial and temporal variability of nitrogen oxide and methane fluxes from a fertilized tree plantation in Costa Rica, J Geophys Res Atmos, 104(D23), 30097-30107. Whalen, S.C. and Reeburgh, W., 1996, Moisture and temperature sensitivity of CH4 oxidation in boreal soils, Soil Biol Biochem., 28, 1271-1281. Yavitt, J., Simmons, J., and Fahey, T., 1993, Methane fluxes in a northern hardwood forest ecosystem in relation to acid precipitation, Chemosphere, 26(1-4), 721-730. Zhu, J., Mulder, J., Wu, L.P., Meng, X.X., Wang, Y.H., and Dörsch. P., 2013, Spatial and temporal variability of N2O emissions in a subtropical forest catchment in China, Biogeosciences, 10(3), 1309-1321..
(12)
수치
관련 문서
- IMI International Management Institute Switzerland in Luzern에서 MBA과정수료 기회 제공 - 미국 시카고 North Park University MBA과정 입학 기회 제공.. 코드: GBD
또한 이미 존재하고 있는 지역사회정신보건센터와 종합사회복지관의 가족기능강화사업 및 가족복지서비스사업을 강화하는
미스터리 던전’ (Torneko's Great Adventure: The Mysterious Dungeon)이었다. 영어판은 나오지 만들어졌다.. 일본에서는 음악을 개선한 플레이스테이션 버전이
그러나 어떻게 이러한 프로세스를 활성화하고 현재 비즈니스 사례를 유 지할 뿐만 아니라 민첩한 변화와 변환을 위한 서비스 기반 아키텍처를 생성할
This much has emerged after analysing the resale values of Korean versus Japanese cars, reports True Price.. Darryl Jacobson, managing director of True Price, explains that
소화장애로 약물 치료 (metoclopramide, ranitidine) 중이었다...
Sulfonate Anion : 매우 약염기, 안정된 음이온 → 좋은 이탈기. O─H 결합의 끊어짐이 발생하나 C─O 결합에는 영향이 없음
자명성과 내재적 확실성은 매우 밀접히 관련되어 있지만 자명성과 내재적 확실성은 매우 밀접히 관련되어 있지만 한쪽이 다른
