• 검색 결과가 없습니다.

IEG 환경지질연구정보센터

N/A
N/A
Protected

Academic year: 2021

Share "IEG 환경지질연구정보센터"

Copied!
12
0
0

로드 중.... (전체 텍스트 보기)

전체 글

(1)

1. Introduction

Wildland fuels are particular significance to natural resource managers because unlike weather and topography, humans can change the available quantities of fuels (Keane et al., 2001; Roberts et al., 2003; Elmore et al., 2005). Remote sensing has the potential to reduce uncertainty when assessing fire fuels and offers the best approach for improving our abilities to assess spatially and temporally varying

fuel characteristics (Roberts and Dennision, 2003;

Chafer et al., 2004; Rolf et al., 2005). In the Korea Peninsula, the spring season climate with dry weather results in water deficits and ecosystems that are highly sensitive to climate perturbations. Spring drought coupled with the presence of shrub and forested communities makes wildfire that is one of the most serious economic and life-threatening natural disasters in the region. According to the National Emergency Management Agency statistics,

Application of Hyperion Hyperspectral Remote Sensing Data for Wildfire Fuel Mapping

Yeosang Yoon

and Yongseung Kim

Remote Sensing Department, Korea Aerospace Research Institute

Abstract : Fire fuel map is one of the most critical factors for planning and managing the fire hazard and risk. However, fuel mapping is extremely difficult because fuel properties vary at spatial scales, change depending on the seasonal situations and are affected by the surrounding environment. Remote sensing has potential to reduce the uncertainty in mapping fuels and offers the best approach for improving our abilities.

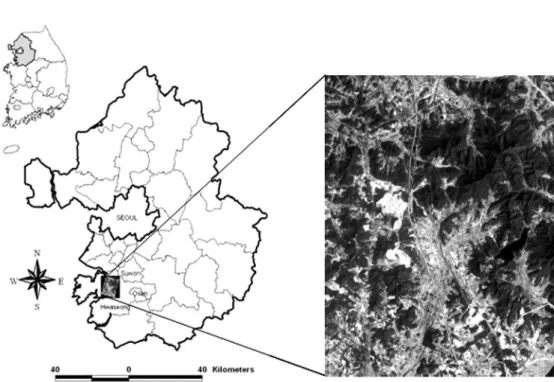
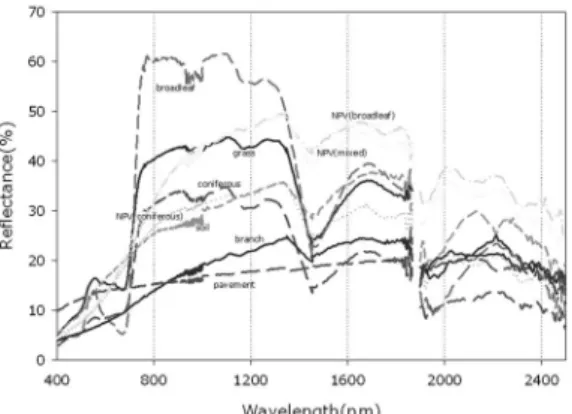
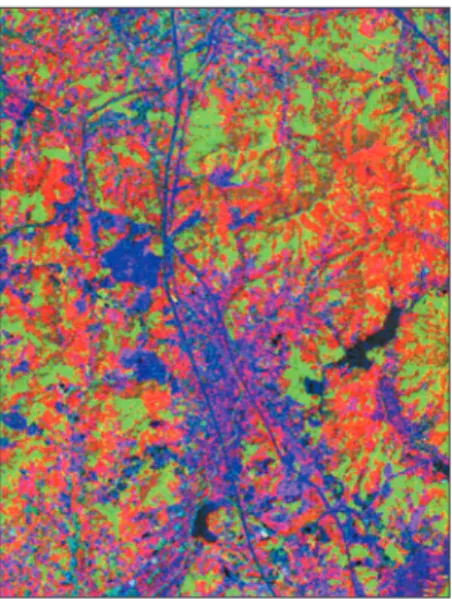
Especially, Hyperspectral sensor have a great potential for mapping vegetation properties because of their high spectral resolution. The objective of this paper is to evaluate the potential of mapping fuel properties using Hyperion hyperspectral remote sensing data acquired in April, 2002. Fuel properties are divided into four broad categories: 1) fuel moisture, 2) fuel green live biomass, 3) fuel condition and 4) fuel types. Fuel moisture and fuel green biomass were assessed using canopy moisture, derived from the expression of liquid water in the reflectance spectrum of plants. Fuel condition was assessed using endmember fractions from spectral mixture analysis (SMA). Fuel types were classified by fuel models based on the results of SMA.

Although Hyperion imagery included a lot of sensor noise and poor performance in liquid water band, the overall results showed that Hyperion imagery have good potential for wildfire fuel mapping.

Key Words : Hyperion, Fuel Mapping, Spectral Mixture Analysis, Canopy Moisture, Wildfire.

Received 13 December 2006; Accepted 20 February 2007.

Corresponding Author: Y. _ S. Yoon ([email protected])

(2)

about 60 percent of all wildfire broke out in spring time with a great deal of damage to the area.

Four fuel characteristics are essential for understanding the behaviour of wildfire: fuel moisture, fuel green live biomass, fuel condition, and fuel types (Anderson, 1982; Roberts et al., 2003).

Fuel moisture is the percentage of liquid water present relative to dry weight in both live and dead fuels. Fuel biomass describes both live and dead vegetation dry biomass. Fuel condition is the relative proportion of live to dead fuels. Dead fuels specially relate to control fire hazard because they contain less moisture and react strongly to change in environmental humidity. Fuel types are usually classified by surface-area-to-volume ratio, relative amounts of herbaceous and woody fuels, and size. In this study, we analysed four fuel characteristics for mapping fuel properties using Hyperion, an imaging spectrometer on the Earth Observation 1 (EO-1) satellite platform. We analysed the fuel moisture and fuel biomass in terms of expression of the liquid water bands. Fuel condition was assessed using green vegetation (GV) and non-photosynthetic vegetation (NPV) as endmembers for spectral mixture analysis (SMA). Fuel types were classified by fuel models based on the results of SMA including GV, NPV, bare soil, shadow, agricultural land, and impervious endmembers. The results of fuel condition and types were validated by comparing the true-color high resolution orthoimagery.

2. Background

In the most extreme conditions, such as strong winds, high temperature and very low humidity, fire will burn across land with very low fuels. However, the effects of fuels on fire behavior will differ, depending on type and structure of the vegetation, the

level of moisture in the fuel, the arrangement of the fuel, and the terrain (Roberts et al., 2003; Rolf et al., 2005). Therefore, there is a clear management advantage to have an understanding of fuel continuity across the landscape, especially for wildfire suppression planning. Remote sensing has been more explored in mapping fire danger. At a coarse scale, fire danger is assessed using broadband sensor such as the Advanced Very High Resolution Radiometer (AVHRR), and Thematic Mapper (TM). Kasischke et al.(1993) mapped forest fire boundaries by subtracting a late-summer AVHRR Normalized Difference Vegetation Index (NDVI) image from an early summer scene. Chuvieco and Salas(1996) assessed fire danger using TM, through some combination of fuel type mapping, meteorology and ancillary geographic information. High resolution and temporal variability imageries are usually used because of representing one of the greatest sources of uncertainty in predicting fire danger (Wang et al., 2004). Hyperspectral images reflected or emitted electromagnetic radiation over a large number of contiguous spectral bands. Fine spectral information also facilitates mapping of biophysical and chemical information that is directly related to the quality of wildfire fuels including fuel type, fuel moisture, green biomass and fuel condition (Roberts et al., 1999;

Dennison et al. 2000; Rolf et al. 2005). Thenkabail et al.(2004) compared the ability of Hyperion hyperspectral satellite imagery with the three broadband sensor (i.e., ETM+, IKONOS, and ALI).

This study showed hyperspectral satellite data produced models that explained 36-83% more of the variability in rainforest biomass, and LULC classification with 45-52% higher overall accuracies.

Canopy moisture and green live biomass are

commonly assessed through expression of the liquid

water bands such as equivalent liquid water thickness

(EWT; Green et al., 1993), the Normalized Difference

(3)

Water Index (NDWI; Gao, 1996) and the Water Index (WI; Penuelas et al., 1993). Fuel condition and fuel type can be estimated using linear SMA approach including GV and NPV endmembers (Roberts and Dennision, 2003; Elmore et al., 2005). The linear SMA assumes that the spectrum measured by a sensor is a linear combination of the spectra of all components within the pixel (Adams et al., 1995).

SMA proceeds with the formation of the following system of equations (1) for each pixel in the image:

R

mix,b

= S(f

em

R

em,b

) + e

b

and Sf

em

(1)

= 1, 0≤f

em

≤1

Where R

mix,b

is reflectance of observed image spectrum at each band; f

em

is fraction of each endmember in observed mixed spectrum; R

em,b

is reflectance of each endmember at each band; e

b

is band residual.

3. Methods

1) Study Site and Data

The study site is located in southwest part of GyeongGi-Do, Korea. This area consists of forest, farmland and small village. Although many species of trees are present, only a few species dominate the landscape including pine and oak.

For our study, we used part of the Hyperion imagery acquired at approximately 02:00 UTC on April 3, 2002. Hyperion is a hyperspectral instrument on the Earth Observing 1 (EO-1) spacecraft that was launched on November 21, 2000. Hyperion imagery consists of 242 channels ranging from 356-2577nm, sampled approximately at a 10nm sampling interval.

It is part of EO-1 platform and follows Landsat Enhanced Thematic Mapper (ETM) in its orbits, providing nearly simultaneous coverage. Each image contains data for a 7.65km wide (cross-track) by

Figure 1. Index map of study area. Subset of Hyperion image of the study area is located in the city of Hwaseong.

(4)

185km long (along-track) region. In addition, reflectance spectra were measured for reference using a portable spectroradiometer (GER3700) with full real-time data acquisition from 350nm to 2500nm acquired on May 6, 2006. True-colour high resolution orthoimagery (1m) acquired in April, 2003 also used to produce training and validation datasets for developing and evaluating SMA models.

2) Image Analysis

(1) Detection and Correction of Abnormal Pixels Hyperion acquires data in pushbroom mode with two spectrometers, one in the visible and near infrared (VNIR) range and another in the short-wave infrared (SWIR) range. We used Hyperion data set called hyperion level 1R(USGS Hyperion product), which is radiometrically-corrected for all bad pixels.

However, after a visual examination of a Hyperion level 1R image, it was apparent that bad pixels still remained. In addition, there were dark vertical stripes in the image (Han et al., 2002). Abnormal pixels were corrected by modified 3×3 average filter by the following equation (2).

X = (2)

(2) Atmospheric correction

The Hyperion data was radiometrically corrected for reflectance using the FLAASH (Fast Line of sight Atmospheric Analysis of Hyperspectral Cubes) ver.

4.2 included in ENVI software. The surface

reflectance was determined by the following equation:

L = ( ) + ( ) + L

a

(3)

Where r is the pixel surface reflectance; r

e

is an average surface reflectance for the pixel; S is the spherical albedo of the atmosphere; L

a

is the radiance back scattered by the atmosphere; A and B are coefficients that depend on atmospheric and geometric conditions but not on the surface. The values of A, B, and L

a

are determined from MODTRAN4 calculations that use the viewing and solar angles and the mean surface elevation of the measurement, and assume a certain model atmosphere, aerosol type, and visible range.

(3) Fuel Moisture / Live Biomass

Fuel moisture and fuel biomass were assessed using two hyperspectral measures, the WI (Penuelas et al., 1993), and NDWI (Gao, 1996). The closest band center for Hyperion was used for the numerator and denominator for WI and NDWI.

WI = (4)

NDWI = (5)

(4) Fuel condition

Fuel condition was assessed by the proportion of live canopy components to dead canopy components.

Fuel condition was mapped using SMA that was used to map green vegetation (GV), non-photosynthetic vegetation (dead herbaceous plants, litter, and wood), shadow, and soil. SMA endmembers were selected from relatively pure pixels using reference data that were derived from field spectrometer (GER3700) and high resolution orthoimagery. They were also selected from the potential models based on whether they are physically reasonable (fraction are between 0% and 100%) and meet criteria based on the overall

(r

857_

r

1241

) (r

857

+ r

1241

)

r

895

r

972

Br

e

1

_

r

e

S Ar

1

_

r

e

S

(d1 + d2 + d3 + d4 + d5 + d6) 6

Figure 2. Example of modified 3×3 average filter for abnormal pixel, X.

d1d4 d2 X d5 d3 d6

X

Abnormal pixel

(5)

fit and residuals. In addition, in order to improve the quality of SMA, Hyperion image was masked by non-forest area layer that was classified by maximum likelihood classification. Although we chose carefully image endmembers, they still included some minor error. To correct the problems, we applied linear interpolation method. The results of SMA were validated by comparing the true-color high resolution orthoimagery (1m resolution). We randomly selected 13 pixels from the Hyperion image, and the orthoimagery was used to estimate the actual fraction within 3×3 window around each sampled Hyperion pixel (in fact, we used 117 pixels from Hyperion Image). Thus, for each sample (i.e., 3 ×3 window at Hyperion resolution), actual fraction was estimated from a corresponding 90×90 pixels subset from the 3-band, true-color orthoimagery. Each orthoimagery subset was classified, using maximum likelihood classification, into GV, NPV, shadow, and soil.

(5) Fuel type

To classify the fuel type, we applied two steps: 1) Characterization of live and dead fuel ratios using SMA method and 2) Organization and ordering of classes were determined by the fuel type. SMA was used to estimate six land cover types: GV, NPV, bare soil, shadow(including water), agricultural land, and

impervious(building, asphalt road, etc.). Spectra endmembers were extracted from relatively pure stands of specific land cover dominants. Fuels are the above ground organic biomass that contributes to a wildland fire and is usually classified by whether they are live or dead, woody or herbaceous, and size. The most commonly used fuel models were constructed for fire behaviour prediction with the 13 standard fire behaviour fuel models by Anderson (1982).

However, it is not always possible to recognize all these classes in their exact form. Thus, considering the Hyperion image and acquisition date, we reorganized and simplified Anderson’s model. The classes are as follows:

Type 1. No vegetation: this category consists of bare land area, water (i.e., river, lake) and pavement (i.e., settlements, streets). In this type, low-spreading fire are the most common.

Condition: bare soil > 60% or impervious

> 60% or water/shadow > 60%

Type 2. Land fuels: this category comprises few grasslands, low-lying shrubs and bare land areas.

Condition: NPV < 30% or agricultural land > 30%, except Type 1, 3, 4, 5.

Type 3. Forest areas with medium understory:

this category comprises forests with medium surface litter fuels.

Condition: 30% < NPV < 60%, except Type 1, 4, 5.

Type 4. Forest areas with dense understory: this category comprises forests with dense undergrowth (leaf litter compacted). This type favors severe and high density fires.

Condition: NPV > 60%, except Type 1, 5.

Type 5. Forest areas: this category comprise forest with dense live leafy part of the tree.

Condition: GV > 60%, except Type 1.

Figure 3. Reflectance curve of target materials measured by

the spectroradiometer (GER 3700).

(6)

In case of this study, we applied hierarchical approach method to classify fuel types in accordance with the above-mentioned standardization (Type1 → Type5 → Type4 → Type3 → Type2). Accuracy assessment of fuel type was analysed by comparing the 1-m true color orthoimagery. The error matrix is the most frequently used method for quantitatively analysing land use/land cover classification accuracy and was used in this paper (Jensen, 1996). The accuracies of the fuel type were checked with a stratified random sampling method using total 478 samples. Overall accuracy, producer’s accuracy, and user’s accuracy were calculated based on the error matrices, and K

hat

statistics.

4. Results and Discussions

1) Detection and Correction of Abnormal Pixels

In the case of Hyperion image, there are many possible causes for the abnormal pixels including detector failure, errors during data transfer, and improper data correction. Hyperion image collected 220 unique spectral bands with a complete spectrum

covering from 357 - 2577nm. However, the Level 1 Radiometric product has a total of 242 bands but only 198 bands are calibrated due to the detectors’ low responsivity. There are only 196 unique bands because of an overlap between the VNIR and SWIR focal planes (Beck, 2003). Therefore, we firstly removed not calibrated bands. Remote sensing data acquisition is limited to the non-blocked spectral regions, called “atmospheric windows”, especially at adjacent 1400nm and 1900nm spectrum (Jensen, 1996). We removed atypical bands including atmospheric absorption bands. Finally, there are only 150 bands of 242 bands through removing atypical bands and then we corrected the abnormal pixels using modified 3×3 average filter.

2) Fuel moisture / Live Biomass

WI showed a poor performance due to very low signal around 980nm of the liquid water band (Figure 5-a). NDWI performance was generally good (Figure 5-b). In this figure, NDWI was scaled from -0.26 to 0.39 (dark to bright). The general patterns of NDWI showed plant leaf water content that has a close correlation with canopy biomass and indirectly to the absorption features of protein, nitrogen, lignin,

Figure 4. Abnormal pixel correction before and after the band 10 of Hyperion image. (a) before; (b) after.

(a) (b)

(7)

cellulose and starch concentrations (Gong et al., 2003). For example, senesced area have low NDWI and dense vegetation has high NDWI.

3) Fuel condition

Hyperion results showed recognizable pattern of GV, NPV, shadow/water and soil endmembers (Figure 6). The NPV areas are considered the highest

fire danger because of an abundance of senescent plant materials. Areas with high GV fractions are considered to have lower danger because of the presence of large amounts of live leaf materials with its associated moisture. Figure 7 demonstrates how fuel condition changes depending on NDWI. As anticipated, the pattern of graph shows a near-linear increase in the GV fractions and a near-liner decrease in the NPV as the NDWI varies from dry to wet condition.

The accuracy of SMA model was estimated actual

Figure 6. False color composite showing fraction images for NPV (red), GV (green), and soil (blue).

Figure 7. The relationship between NPV and GV fractions depending on NDWI.

Figure 5. Image showing (a) WI and (b) NDWI for Hyperion image.

(a) (b)

(8)

fraction within 3×3 window surrounding each sample Hyperion pixel from high resolution orthoimagery (Figure 8).

SMA

GV

and SMA

NPV

were estimated a strong, linear relationship to actual fractional cover for the

validation Hyperion pixels (0.844 and 0.919 respectively). SMA

soil

and SMA

shadow

were comparatively poor because those fractions are relatively tiny proportion of each pixel. Besides, the shade fraction is caused by different solar zenith Figure 8. The estimation of actual fraction within 3×3 window surrounding each sample Hyperion pixel from high resolution

orthoimagery. (a) is the SMA result subset with NPV (red), GV (green), and Soil (blue); (b) is orthoimagery; (c) is classified image of the orthoimagery subset.

(a) (b)

GV NPV Soil Shadow (c)

Figure 9. Relationship between actual and predicted fraction cover. (a) GV fraction; (b) NPV fraction; (c) Soil fraction; (d) Shadow /

Water fraction.

(9)

angle between Hyperion data and orthoimagery that were acquired different date and time.

4) Fuel type

Characterization of live fuel, dead fuel, and exposed substrate ratios was mapped using SMA with GV, NPV, shadow, soil, agricultural land, and impervious endmembers (Figure 10). The NPV areas are considered the highest fire danger as explained in the previous section. Areas mapped as green (GV)

consist of a relatively high rate of live leaf materials.

Area mapped as blue (soil) are classified into the impervious material and soil. The fuel types shown in Figure 11 were reproduced by the models, according to the specific properties of Hyperion image, based on the results of SMA.

The results of the fuel type mapping are presented in Table 1 for the deterministic error matrix. The overall accuracy of the error matrix provided a relatively good result (74.1 percent). For example, Figure 10. False color composite showing fraction images for

NPV (red), GV (green), and Soil (blue)

Figure 11. Classification result showing based on the results of SMA (Figure 10).

Table 1. Error matrix for the fuel type map derived from Hyperion image.

Reference Data

CLASS Type1Type2 Type3 Type4 Type5 TOTALS User’s

Accuracy

Type182 1 0 0 0 83 98.8%

Type2 4 72 0 6 5 87 82.8%

Type3 2 24 511 4 8 99 51.5%

Type4 0 154 53 0 108 49.1%

Type5 0 0 3 2 96 101 95.1%

TOTALS88 98 108 75 109 478

Producer’s Accuracy 93.2% 73.5% 47.2% 70.7% 88.1%

Overall Accuracy 74.1%

K

hat

67.6%

Reference Data

User’s CLASS

Type1Type2 Type3 Type4 Type5 TOTALS Accuracy

Map

Data

(10)

“Type5” class including live green vegetation showed considerably high performance in both producer’s and user’s accuracy. However, “Type3” and “Type4”

class achieved a low user’s accuracy (51.5 percent and 49.1 percent, respectively). The failure of those classes was due to mixed classes, such as dead surface fuels including dead herbaceous plants, litter, and wood, which are spectrally quite similar to the surrounding environment. Furthermore, the spectral pattern of agricultural land and broadleaved tree has similar characteristics to NPV in the spring season.

5. Conclusions

Hyperspectral data such as Hyperion imagery provides a variety of wildfire fuel properties including indirect measures of live fuel moisture and green live biomass, improved separation of GV, NPV and substrate, and improved fuel type mapping.

In this paper, we analysed four fuel characteristics for understanding the behaviour of wildland fire using Hyperion hyperspectral image and evaluated the potential of Hyperion for fuel mapping. In order to improve the quality of results using Hyperion image, we firstly removed non-calibrated band and atypical bands, and then corrected abnormal pixels before the main process. Surface reflectance of Hyperion image was also corrected using the FLAASH ver.4.2 based on MODTRAN4 radiative transfer code. The measure of canopy moisture based on 980nm liquid water band (WI) was estimated very poor. However, measures based on the 1200nm band (NDWI) provided a relatively good result. Measures of fuel condition were mapped using SMA with four endmembers (GV, NPV, soil, and shadow) and the results of SMA were validated by comparing the true- color high resolution orthoimagery. SMA

GV

and SMA

NPV

were found to have a strong, linear

relationship to actual fractional cover (0.844 and 0.919 respectively). The ability of Hyperion to distinguish NPV is important because NPV is a valuable factor of fire danger assessment. However broadband remote sensing data under the limited conditions cannot be distinguished from the surrounding environment. Fuel type was mapped using SMA and reclassification of SMA results. The overall accuracy of fuel type map appeared 74.1%

and especially “Type5” class showed high performance (exceeded 93.2%). However, “Type3”

and “Type4” class achieved a low accuracy due to mixed classes and ambiguous environment in spring season.

Hyperion is the first hyperspectral sensor in space and gathers near-continuous data in 220 discrete narrow bands along the 356-2577nm spectral range at 30m spatial resolution and 16bits. Besides, the relatively large swath provides fairly good regional coverage throughout the world compared to airborne hyperspectral system and repeat frequency would allow better mapping of time-varying fuel properties.

Although Hyperion imagery includes a lot of sensor noise and poor performance in liquid water band, it offers the potential of fuel mapping using a large number of spectral bands.

References

Adams, J. B., D. E. Sabol, V. Kapos, R. F. Almeida, D. A. Roberts, M. O. Smith, and A. R.

Gillespie, 1995. Classification of multispectral images based on fractions of endmembers: Applications to land-use change in the Brazilian Amazon. Remote Sensing of Environment, 52: 137-154.

Anderson, H. E., 1982. Aids to determining fuel

models for estimating fire behavior. USDA

(11)

Forest Service, Intermountain Forest and Range Experiment Station, INT-122.

Beck, R., 2003. EO-1 User Guide Version 2.3.

Chafer, C., M. Noonan, and E. Macnaught, 2004. The post-fire measurement of fire severity and intensity in the Christmas 2001 Sydney wildfires. International Journal of Wildland Fire, 13: 227-240.

Chuvieco, E. and J. Salas, 1996. Mapping the spatial distribution of forest fire danger using GIS.

International Journal. of GIS, 10(3): 333-345.

Dennision, P. E., D. A. Robers, and J. C.

Regelbrugge, 2000. Characterizing chaparral fuels using combined hyperspectral and synthetic aperture radar data. Proc. 9

th

AVIRIS Earth Science Workshop, 6: 119-124.

Elmore, A. J. and G. P. Asner, 2005. Satellite monitoring of vegetation phenology and fire fuel conditions in Hawaiian drylands. Earth Interactions, 9(21): 1-21.

Gao, B. C., 1996. NDWI - A normalized difference water index for remote sensing of vegetation liquid water from space. Remote Sensing of Environment, 58: 257-266.

Gong, P., R. Pu, G. S. Biging, and M. R. Larrieu, 2003. Estimation of Forest Leaf Area Index Using Vegetation Indices Derived From Hyperion Hyperspectral Data. IEEE Transaction Geoscience and Remote Sensing, 41(6): 1355-1362.

Han, T., D. G. Goodenough, A. Dyk, and L. Love, 2002. Detection and correction of abnormal pixels in hyperion images. International Geoscience and Remote Sensing Symposium 2002, pp. 1327-1330.

Jensen, J. R., 1996. Introductory digital image processing: a remote sensing perspective.

Prentice Hall, pp. 247-252.

Kasischke, E. S., N. F. French, P. Harrell, N. L.

Christensen, S. L. Ustin, and D. Barry, 1993.

Monitoring of wildfires in boreal forest using large area AVHRR NDVI composite image.

Remote Sensing of Environment, 44: 61-72.

Keane R. E., R. Burgan, and J. Watendon, 2001.

Mapping wildland fuels for management across multiple scales: Integrating remote sensing, GIS, and biophysical modelling.

International Journal of Wildland Fire, 10:

301-309.

Penuelas, J., I. Filella, C. Biel, L. Serrano, and R.

Save, 1993. The reflectance at the 950-970nm region as an indicator of plant water status.

International Journal of Remote Sensing, 14:

1887-1905.

Roberts, D. A. and P. E. Dennision, 2003.

Hyperspectral technologies for wildfire fuel mapping. Proc. 4

th

International Workshop on RS and GIS Applications to Forest Fire Management, pp. 66-75.

Roberts, D. A., P. E. Dennison, M. E. Gardner, Y.

Hetzel, S. L. Ustin, and C. T. Lee, 2003.

Evaluation of the potential of hyperion for fire danger assessment by comparison to the airborne visible / infrared imagine spectrometer.

IEEE Transaction Geoscience and Remote Sensing, 41(6): 1297-1310.

Rolf, A., N. Goodwin, and R. Merton, 2005.

Assessing fuel loads using remote sensing.

University of New South Wales, Australia, pp. 5-9.

Smith, M. O., S. L. Ustin, J. B. Adams, and A. R.

Gillespie, 1990. Vegetation in deserts: I. A regional measure of abundance from multispectral images. Remote Sensing of Environment, 31: 1-26.

Thenkabail, P. S., E. A. Enclona, M. S. Ashton, C.

Legg, and M. J. De Dieu, 2004. Hyperion,

IKONOS, ALI, and ETM+ sensors in the

(12)

study of African rainforests. Remote Sensing of Environment, 90: 23-43.

Tompkins, S., J. F. Mustard, C. M. Pieters, and D. W.

Forsyth, 1997. Optimization of endmembers for spectral mixture analysis. Remote Sensing of Environment, 59: 472-489.

Tueller, P. T., 1987. Remote sensing science applications in arid environments. Remote Sensing of Environment, 23: 143-154.

Wang, L., W. P. Sousa, P. Gong, and G. S. Biging, 2004. Comparison of IKONOS and QuickBird images for mapping mangrove species on the Caribbean coast of Panama.

Remote Sensing of Environment, 91: 432-440.

Xiao, J. and A. Moody, 2005. A comparison of methods for estimating fractional green vegetation cover within a desert-to-upland transition zone in central New Mexico, USA.

Remote Sensing of Environment, 98: 237-250.

수치

Figure 1.  Index map of study area. Subset of Hyperion image of the study area is located in the city of Hwaseong.
Figure 2.  Example of modified 3×3 average filter for abnormal pixel, X. d1d4d2Xd5d3d6X Abnormal pixel
Figure 3.  Reflectance curve of target materials measured by the spectroradiometer (GER 3700).
Figure 4.  Abnormal pixel correction before and after the band 10 of Hyperion image. (a) before; (b) after.
+4

참조

관련 문서

Keywords: Hyperspectral image, SAM(Spectral Angle Mapping), decision tree, land cover classification, spectral library.. 원격탐사에 의해 취득된 영상자료의

Land cover characterization of temperate East Asia using multi-temporal VEGETATION sensor data, Remote Sens.. A comparison of regional trends in 1979-1997

The objective of this paper is to improve road extraction based on Spectral Angle Mapper (SAM) classification by using SPOT-5 imagery.. SAM directly compares the target spectrum

At NOAA/NESDIS, daily snow and sea ice map, Interactive Multi-sensor Snow and Ice Mapping System (IMS), is estimated by combining surface observation data, optical sensor data

Application of Frequency Ratio and Logistic Regression Model for Landslide Susceptibility Mapping using GIS at Baguio, Philippines.. The aim of this study was to evaluate

The objective of this study was to estimate leaf area index (LAI) as a function of image-derived vegetation indices, and to compare measured and estimated LAI to the results

Contents Contents Investigation of native and foreign references Introduction of Redlake MS 4000 multi-spectral sensor Development of the data storage system Evaluation of

This study was carried out to investigate the possibility of biotop mapping using high resolution satellite remote sensing data together with field data and eventually,