A reconnaissance on the use of the speleothems in Korean limestone caves to retrospective study on the regional climate change for the recent and geologic past
ABSTRACT: More than 1,000 limestone caves are extensively developed in Gangwon-do and Chungcheongbuk-do, Korea. A vari- ety of numerous speleothems are actively growing in these caves today. A potential to use speleothems as regional paleoclimate proxy was explored by analyzing soda straw, stalactite and stalag- mite. These proxy recorders that have grown during the past several decades were investigated using the presence of excess 210Pb. Most specimens collected from six limestone caves were found to have an excess 210Pb, indicating that they are less than about 100 yrs old.
This excess 210Pb was employed to estimate the growth rate for a tubular “soda straw” that yielded a longitudinal growth rate of 1.7 mm/yr past 60 years. Coeval decrease in δ13C values of the soda straw, spanning the time period of about 1930−1995 AD, may reflect the carbon isotope ratio of atmospheric CO2 for the same period. Studies on fine scale variations in the isotopic composition of recent speleothems along with age control using 210Pb excess method from the speleothems in Korean limestone caves promise a great potential for the reconstruction of climate and environmental changes during the past hundred years or so.
Key words: limestone cave, soda straw, stalactite, stalagmite, proxy, excess 210Pb, atmospheric CO2
1. INTRODUCTION
Speleothems have been widely used as a proxy to retrieve continental paleoenvironmental information (e.g., Zhao et al., 2003) along with varved lake sediments (Ojala and Saarinen, 2002), tree-rings (Eronen et al., 2002), peat land (Charman et al., 2001) and ice cores (Severinghaus and Brook, 1999). These continental records have provided more detailed regional paleoclimatic information than marine records from stable isotope data of pelagic sediments or shallow marine corals (Moore and Krishnaswami, 1972; Crowley et al., 2001) which have been used as proxies for global pale- oceanographic information. The unique advantage of spe- leothems is that it is ubiquitous and provides proxy information on the local climate and environmental changes.
Soda straws are one kind of dripstones pointing vertically downwards from the cave ceiling. They are usually straight, thin and fragile, and always have a diameter of approxi- mately 5 mm (Fig. 1). They are always hollow, and com- posed of calcite crystals. When water responsible for the growth of calcite stays at the tip, slow degassing of dis- solved CO2 takes place, thus lowering the carbonate solu- bility eventually leading to the crystalline calcite deposition (Woo, 1999). As the internal hole may be blocked by the growth of calcite within the hole or by the blockage by detritus or as the supply rate of water from the ceiling increases, the calcite crystals begin to grow on the side of soda straw and become a typical stalactite (called icicle- shaped stalactite) that grows downwards. It is common to observe the growth of stalagmite on the floor where the water drops from stalactite hits. If the water is flowing along the inclined wall or the water is provided from the vertical cracks, the draperies can form. A drapery (curtain) can be called as a bacon sheet if the internal banded struc- ture is developed.
The objective of this paper is to evaluate the potential of obtaining regional paleoclimatic information by establish- ing the chronology using excess 210Pb data and stable car- bon and oxygen isotope values of the speleothems in Korean limestone caves.
2. MATERIAL AND METHODS
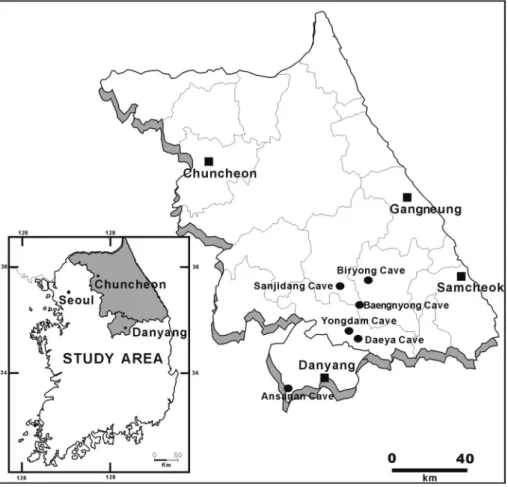
The speleothem samples were collected from Baeng- nyong and Sanjidang Caves (Pyeongchang-gun), Daeya and Yongdam Caves (Yeongwol-gun) and Biryong Cave (Jeong- seon-gun) in Gangwon-do, and Ansanan Cave (Danyang- gun) in Chungcheongbuk-do (Fig. 2). All of the caves listed above maintained relatively constant temperature (14−16 °C) and humidity (>80%) throughout the year (Woo, unpub- lished data). The soda straw was obtained from Daeya Cave, and the icicle type stalactite samples were collected Kyung Sik Woo*
Gi Hoon Hong Don Won Choi Kyung Nam Jo Mark Baskaran Hyun Mi Lee
}
Cave Research Institute of Korea, Kangwon National University, Chuncheon, Gangwon-do 200-701, Korea Korea Ocean Research and Development Institute, Ansan P.O.Box 29, Gyeonggi-do 425-600, Korea Cave Research Institute of Korea, Kangwon National University, Chuncheon, Gangwon-do 200-701, Korea Department of Geology, Wayne State University, Detroit MI 48202, USA
Korea Ocean Research and Development Institute, Ansan P.O.Box 29, Gyeonggi-do 425-600, Korea
*Corresponding author: [email protected]
from Sanjidang and Yongdam Caves. The stalagmite sam- ples were obtained from Baengnyong and Daeya Caves, and one bacon sheet from Yongdam Cave.
To determine excess 210Pb and stable carbon isotope data,
carbonate powders were microdrilled at every 5 cm from the tip with 1.8 cm interval for the soda straw. Other sta- lactites and stalagmites, and a bacon sheet sample were taken from the surface of the tip normally 1 mm down from the surface.
For 210Pb and 226Ra measurements of the stalactites, sta- lagmites and bacon sheet, a known amount of the powdered sample was placed in the counting vial and sealed. The sealed samples were left for over 1 month for the daughter products of 226Ra to reach secular equilibrium. For 210Pb and
226Ra, 46.5 keV and 351.9 keV (214Pb) gamma-ray lines were utilized to assay the concentrations of 226Ra and 210Pb. Each sample was counted on HPGe detector for a known amount of time. The counting efficiency curves were obtained using Isotope Products Laboratories multinuclide solution and IAEA gamma-ray reference materials (RGU-1, RGTh-1, and RGK-1) and dpm/cpm ratios for each radionuclide were calculated using IAEA 306 marine coastal sediment (Baltic Sea) reference material. Since the density of samples and reference is very similar, the self-absorption correction was not made (Hasan et al., 2002).
The soda straw specimens from Daeya Cave (DY-1, DY-2, DY-3, and DY-4) collected in 1996 were handled at Texas A&M University, Galveston. They were cut into segments and weighed. A known amount of 209Po spike was added to the powdered carbonate as a yield monitor and the sample
Fig. 1. Photograph of a soda straw.
Fig. 2. Location map of the limestone caves in this study.
was subsequently dissolved in 6 M HCl. The solution was centrifuged and supernatant used for Po plating onto silver planchets (Baskaran and Illife, 1993). In most samples, no residue remained after acid treatment, indicating that the soda straw is composed of pure carbonates. The planchets were assayed for their activity using a solid state surface barrier detector coupled to S 100 Canberra multichannel analyzer. The parent-supported 210Pb concentrations were determined by gamma counting the sample powder on a high purity Ge-well detector. Parent-supported 210Pb (226Ra) concentration was found to be <0.5 dpm/g and hence par- ent-supported 210Pb was not subtracted from the measured
210Pb concentrations for soda straw. All errors reported here are 1-sigma propagated error arising from calibration of the detector, background correction and counting statistics.
Stable isotopic and elemental analyses were carried out at the Korea Basic Science Institute, using the VG Isotech Prism mass spectrometer. Analytical errors for stable iso- tope analyses are ±0.1 ‰. All the stable isotope data reported here are relative to the PDB standard.
3. THEORETICAL BACKGROUND
Calcite speleothems are formed when groundwater which is supersaturated with CaCO3 enters a cave. Slow outgas- sing of dissolved CO2 lowers carbonate solubility in the water drop and leads to crystalline calcite precipitation. If isotopic equilibrium is maintained between HCO3−and aqueous CO2, then the calcite precipitated will be in isoto- pic equilibrium with the water and variations in 18O/16O composition of the calcite will depend on oxygen isotopic composition of the water and temperature of the cave atmo- sphere (thus, climatic condition). These speleothems may preserve a record of long-term fluctuations in the isotopic
(oxygen and carbon) composition of the recharge waters.
Recharge water that is derived from local precipitation con- tains a climate signal consisting of information on the mean annual surface temperature of the sampling site and the amount of precipitation.
210Pb (half life=22.1 yr) is produced from its gaseous pre- cursor, 222Rn (half-life=3.8 25 d) at a constant rate. Ground- water has measurable concentrations of 222Rn which is derived from the recoil of Rn atoms into the aqueous phase during its production from the U-series decay chain. Most of this 222Rn in the cave air presumably degassed from water running through or dripping into the cave. As Rn con- taining water in caves drips from stalactites to stalagmites, the relatively longer lived daughter of 222Rn, 210Pb, is produced according to the equation [210Pb]=[222Rn]×(1-exp(-λPb∆t) where λPb is the decay constant of 210Pb, and ∆t is the time for which the water drop is in contact with the calcium car- bonate. If drip water from the ceiling of caves has high con- centrations of 222Rn, recently-growing speleothems likewise should contain a large amount of excess 210Pb. Then the
210Pb should accumulate within the growing crystal lattice of stalactites as well as stalagmites. Thus, 210Pb concentra- tions in a speleothems should theoretically offer a mecha- nism of dating relatively young (≤100 yr old) cave deposits.
With this view, the presence of excess 210Pb over 226Ra was regarded as a recently (<100 yr) growing speleothems in this study.
The disequilibrium between 210Pb and 226Ra has been pre- viously used to date various marine carbonates (such as cor- als) from both coastal as well as deep waters. Moore and Krishnaswami (1972) first introduced the 210Pb-based radi- ometric method to determine the growth rates of corals.
Baskaran et al. (2004) also applied 210Pb/226Ra disequilibria on the archived bivalves to demonstrate its usage for age
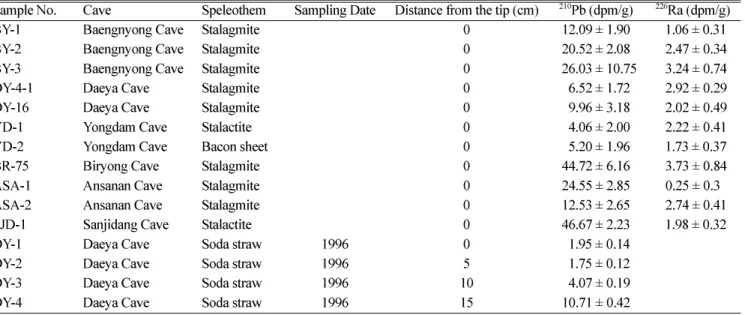
Table 1.210Pb and 226Ra activity concentrations for the surface of the speleothem. Distance from the tip denotes the distance from the terminal growth surface to the sampling point. Total length of the soda straw is about 16 cm.
Sample No. Cave Speleothem Sampling Date Distance from the tip (cm) 210Pb (dpm/g) 226Ra (dpm/g)
BY-1 Baengnyong Cave Stalagmite 0 12.09 ± 1.90 11.06 ± 0.31
BY-2 Baengnyong Cave Stalagmite 0 20.52 ± 2.08 12.47 ± 0.34
BY-3 Baengnyong Cave Stalagmite 0 126.03 ± 10.75 13.24 ± 0.74
DY-4-1 Daeya Cave Stalagmite 0 16.52 ± 1.72 12.92 ± 0.29
DY-16 Daeya Cave Stalagmite 0 19.96 ± 3.18 12.02 ± 0.49
YD-1 Yongdam Cave Stalactite 0 14.06 ± 2.00 12.22 ± 0.41
YD-2 Yongdam Cave Bacon sheet 0 15.20 ± 1.96 11.73 ± 0.37
BR-75 Biryong Cave Stalagmite 0 44.72 ± 6.16 13.73 ± 0.84
ASA-1 Ansanan Cave Stalagmite 0 24.55 ± 2.85 0.25 ± 0.3
ASA-2 Ansanan Cave Stalagmite 0 12.53 ± 2.65 12.74 ± 0.41
SJD-1 Sanjidang Cave Stalactite 0 46.67 ± 2.23 11.98 ± 0.32
DY-1 Daeya Cave Soda straw 1996 0 11.95 ± 0.14
DY-2 Daeya Cave Soda straw 1996 5 11.75 ± 0.12
DY-3 Daeya Cave Soda straw 1996 10 14.07 ± 0.19
DY-4 Daeya Cave Soda straw 1996 15 10.71 ± 0.42
(time-elapsed since the death of the bivalves). This method is based on 210Pb production from its parent 226Ra (210Pb/
226Ra method). In this technique, the initial 210Pb concen- tration must be insignificant compared to 226Ra concentra- tion and its value be precisely known.
4. RESULTS AND DISCUSSION
210Pb and 226Ra activity concentrations for speleothems collected are listed in Table 1. In all the samples, there is excess 210Pb clearly indicating these samples show signs of recent growth, in less than 100 yr time scale. Excess 210Pb concentrations were measured in sequential layers to deter- mine the age and longitudinal growth rate of the soda straw collected in 1996 from the Daeya Cave. Excess 210Pb con- centrations are plotted against the median longitudinal dis- tance from the bottom tip in each of the four segments of a soda straw (Fig. 3). From the excess 210Pb concentrations, the growth rate of the soda straw between 1937 and 1995 can be estimated to be about 1.7 mm/yr (Table 2, Fig. 3).
Since the soda straw specimen from the Daeya Cave pro- vide a time series 210Pb activity, the corresponding carbon
and oxygen isotope compositions were also analyzed for carbon and oxygen isotopes. Plotting the δ13C and δ18O val- ues as a function of time, the δ13C values increased from 1920 (?) to 1937 a little bit (−8.08 to –7.80 ‰), and then decreased to a value of about −10.35 ‰ around 1990s (Fig. 4;
Table 2). This decreasing trend parallels the δ13C in a global atmospheric CO2 deduced from a variety of studies such as the measurement of air trapped in polar ice (Severinghaus and Brook, 1999) and direct atmospheric measurements (summarized in Baskaran and Krishnamurthy, 1993). The
δ13C values are depleted relative to the global average as much as ca. 2 ‰. This depletion could result from different type of vegetation (C3 plants in Korea), which could lower the δ13C of soil CO2. However the temporary enrichment of
δ13C values (~0.3 ‰) during 1937 probably resulted from local deforestation during Japanese colonial period. Fores- tation since 1960s have increased the organic content in overlying soil and the δ13C decrease in the soda straw caught up the global decreasing trend. It is well known that this decline in δ13C values is related to the increase in con- centration of atmospheric CO2 released by the consumption of fossil fuel (Baskaran and Krishnamurthy, 1993), mainly because lighter carbon isotopes were added into the atmo- sphere. It is interesting to compare that the overall δ13C decrease between 1920 and 1995 in this study is ~0.030 ‰/yr, which almost coincides with the rate published by Baskaran and Krishnamurthy (1993).
δ18O values also continue to decrease from −6.65 ‰
Fig. 3. 210Pb contents of the soda straw from the Daeya cave. The concentration of 210Pb exhibits an exponential decrease with dis- tance from the tip to the 10 cm away from the lowermost part of the soda straw (which is the most recently precipitated part). This yields a longitudinal growth rate of 1.7 mm/yr. Since all the data points except 15 cm sample fall very close to the curve fit indi- cating incorporation of excess 210Pb has been constant with time, it can be concluded that growth rate has been uniform during the last 60 years. Error bars in the y-axis are not drawn due to the small nature (4−7%).
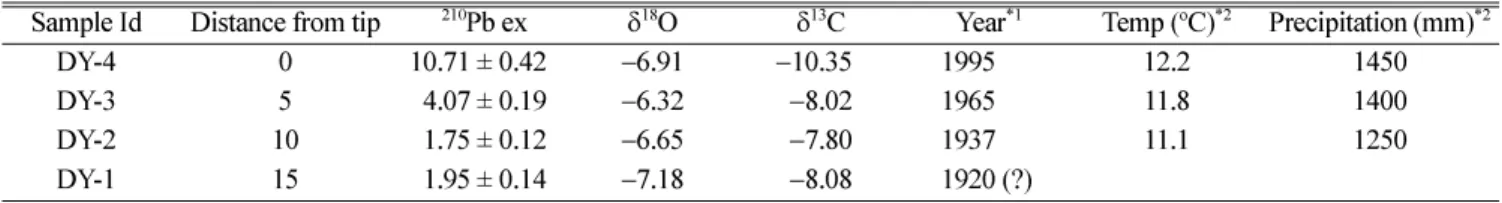
Table 2. Excess 210Pb, carbon and oxygen isotopic compositions of the Soda straw collected in 1996 from the Daeya Cave. Distance from the tip denotes the distance from the terminal growth surface to the sampling point. *1 is excess 210Pb-derived age and *2 are taken from the Korean Meteorological Agency (htt://www.kma.go.kr). The age of DY-1 can be extrapolated to be 1905, however it is assumed to be 1920 since δ13C of atmospheric CO2 was nearly constant prior to 1920 (Marino and McElroy, 1991).
Sample Id Distance from tip 210Pb ex δ18O δ13C Year*1 Temp (oC)*2 Precipitation (mm)*2
DY-4 0 10.71 ± 0.421 −6.91 −10.350 1995 12.2 1450
DY-3 5 4.07 ± 0.19 −6.32 −8.02 1965 11.8 1400
DY-2 10 1.75 ± 0.12 −6.65 −7.80 1937 11.1 1250
DY-1 15 1.95 ± 0.14 −7.18 −8.08 1920 (?)
Fig. 4. Stable isotopic values of δ13C and δ18O of the soda straw as a function of time (210Pb-derived calendar year BP).
(1937) to −6.91 ‰ (1995). As previously mentioned, δ18O compositions of calcite could depend upon oxygen compo- sition of cave water from which calcite precipitated or the temperature-dependent fractionation factor of oxygen iso- tope. The Daeya Cave has been developed at the foot of the mountain and is now located at 190 m in elevation. It can be well accepted that the location of the cave has not changed past a few tens of years, thus it is likely that the oxygen isotopic composition of meteoric water has been uniform during the past 60 years. The amount of decrease in the oxygen isotopic composition is about 0.26 ‰, which is equivalent to ca 1 °C temperature increase (Friedman and O’Neil, 1977). It is interesting to note that atmospheric tem- perature has been increased by 1 °C from 1937 to 1995 (Table 2). Despite the small difference of the oxygen iso- topic values during this period, it may be possible to ascribe this difference to the temperature increase in atmosphere. It is not well known whether the temperature change in cave atmosphere could be affected by temperature change in the atmosphere. We thought the cave temperature (in well buff- ered caves, with limited exchange of air with the surround- ing) represents the mean annual surface temperature at that site. However, the coincidence of the amount of tempera- ture decrease and depletion of oxygen isotope value may offer a possible explanation.
This study is primarily a feasibility study. If rapidly grow- ing speleothems can be selected, it will enable to obtain high-resolution radiometric ages for our future study. In the present, of the specimens analyzed, BY-2, BY-3, BR-75 and SJD-1 appear to be most promising.
5. CONCLUSIONS
Several speleothems growing in some limestone caves in Korea were analyzed for excess 210Pb and stable isotopes of carbon and oxygen to evaluate the potential of speleothems as a regional paleoclimatic proxy. Most specimens collected from four limestone caves were found to have an excess
210Pb, indicating that signs of recent growth (less than 100 yr) and thus can be used as proxy recorders to retrieve pale- otemperature and paleoenvironmental changes. One soda straw specimen shows the decrease from 1930s to 1990s in
δ13C, and this may imply the percentage of plant cover above the cave and/or the increase in concentration of atmospheric CO2 released by the consumption of fossil fuel.
Further research using this technique will aid in understand- ing the paleoclimatic variation in the past hundred years.
ACKNOWLEDGMENTS: Authors are grateful to the members of Cave Investigation Club in the Kangwon National University. This
research was supported by Korea Research Foundation (KRF-2004- 015-C00596) and Cave Research Institute of Korea. We would like to thank Prof. In Sung Paik, Prof. Gong Soo Chung, and one anonymous reviewer for improving this manuscript.
REFERENCES
Baskaran, M., Hong, G.H., Kim,S.H., Chung, C.S. and Wardle, W., 2004, Dating bivalves using 210Pb-226Ra disequilibrium method and temporal variations of 90Sr and elemental abundances of Sr, Mg, and Ba in the bivalve shells from southern and eastern coasts of USA. Geochimica et Cosmochimica Acta (submitted).
Baskaran, M. and Iliffe, T.M., 1993, Age determination of recent cave deposit using excess 210Pb-A new technique. Geophysical Research Letter, 20, 603−606.
Baskaran, M. and Krishnamurthy, R.V., 1993, Speleothems as proxy for the carbon isotope composition of atmospheric CO2. Geo- physical Research Letters, 20, 2905−2908.
Charman, D.J., Caseldine, C., Baker, A., Gearey, B.R. and Hatton, J., 2001, Paleohydrological records from peat profiles and spele- othems in Sutherland, northwest Scotland. Quaternary Research, 55, 223−234.
Crowley, T.J., Quinn, T.M. and Hyde, W.T., 1999, Validation of coral temperature calibrations. Paleoceanography, 14, 605−615.
Eronen, M., Zetterberg, P., Briffa, K., Lindholm, M., Merilanine, J.
and Timonen, M., 2002, The supra-long Scots pine tree-ring record for northern Finnish Lapland-Part 1: chronology construc- tion and initial references. The Holocene, 12, 673−680.
Friedman, I. and O’Neil, J.R., 1977, Compilation of stable isotope fractionation factors of geochemical interest. In: M. Fleischer, ed., Data of Geochemistry, U. S. Geological Survey Professional Paper 440 p.
Hasan, M., Bodizs, D. and Czifrus, S., 2002, A simplified technique to determine the self-absorption for sediment samples. Applied Radiation and Isotopes, 57, 915−918.
Marino, B.D. and McElroy, M.B., 1991, Isotopic composition of atmospheric CO2 inferred from carbon in C4 plant cellulose.
Nature, 349, 127−131.
Moore, G.W. and Krishnaswami, S., 1972, Coral growth rates using
226Ra and 210Pb. Earth and Planetary Science Letters, 15, 187−190.
Severinghaus, J.P. and Brook, E.J., 1999, Abrupt climate change at the end of the last glacial period inferred from trapped air in polar ice. Science, 286, 930−934.
Ojala, A.E.K. and Saarinen, T., 2002, Paleosecular variation of Earth’s magnetic field during the last 10,000 yrs based on the annually laminated sediment of the Lake Nautajarvi, central Fin- land. The Holocene, 12, 391−400.
Woo, K.S., 1999, Scientific investigation of Okgye, Dongdae and Namdae Caves in Kangneung City. p. 269.
Zhao, J.X., Wang, Y.J., Collerson, K.D. and Gagan, M.K., 2003, Spe- leothem U-series dating of semi-synchronous climate oscillations during the last deglaciation. Earth and Planetary Science Letters, 216, 155−161.
Manuscript received May 3, 2005 Manuscript accepted July 25, 2005