Copyright © 2016 The Korean Society for Bone and Mineral Research
This is an Open Access article distributed under the terms of the Creative Commons Attribution Non-Commercial Li- cense (http://creativecommons.org/licenses/by-nc/4.0/) which permits unrestricted non-commercial use, distribu- tion, and reproduction in any medium, provided the original work is properly cited.
pISSN 2287-6375 eISSN 2287-7029
Prolonged Practice of Swimming Is Negatively Related to Bone Mineral Density Gains in
Adolescents
Marcelo R. Ribeiro-dos-Santos1, Kyle R. Lynch1,2, Ricardo R. Agostinete1,3, Santiago Maillane-Vanegas1,3, Bruna Turi-Lynch1,2, Igor H. Ito1,2, Rafael Luiz-de-Marco1, Mario A. Rodrigues-Junior1,2, Rômulo A. Fernandes1,2,3
1Department of Physical Education, Laboratory of InVestigation in Exercise (LIVE), São Paulo State University (UNESP), Presidente Prudente;
2Post-Graduation Program in Kinesiology, Institute of Biosciences, São Paulo State University (UNESP), Rio Claro;
3 Department of Physical Therapy, Post-Graduation Program in Physical Therapy, São Paulo State University (UNESP), Presidente Prudente, Brazil
Background: The practice of swimming in “hypogravity” conditions has potential to de- crease bone formation because it decreases the time engaged in weight-bearing activi- ties usually observed in the daily activities of adolescents. Therefore, adolescents com- peting in national levels would be more exposed to these deleterious effects, because they are engaged in long routines of training during most part of the year. To analyze the effect of swimming on bone mineral density (BMD) gain among adolescents engag- ed in national level competitions during a 9-month period. Methods: Fifty-five adoles- cents; the control group contained 29 adolescents and the swimming group was com- posed of 26 athletes. During the cohort study, BMD, body fat (BF) and fat free mass (FFM) were assessed using a dual-energy x-ray absorptiometry scanner. Body weight was mea- sured with an electronic scale, and height was assessed using a stadiometer. Results:
During the follow-up, swimmers presented higher gains in FFM (Control 2.35 kg vs. Swim- ming 5.14 kg; large effect size [eta-squared (ES-r)=0.168]) and BMD-Spine (Swimming 0.087 g/cm2 vs. Control 0.049 g/cm2; large effect size [ES-r=0.167]) compared to control group. Male swimmers gained more FFM (Male 10.63% vs. Female 3.39%) and BMD- Spine (Male 8.47% vs. Female 4.32%) than females. Longer participation in swimming negatively affected gains in upper limbs among males (r=-0.438 [-0.693 to -0.085]), and in spine among females (r=-0.651 [-0.908 to -0.036]). Conclusions: Over a 9-month fol- low-up, BMD and FFM gains were more evident in male swimmers, while longer engage- ment in swimming negatively affected BMD gains, independently of sex.
Key Words: Adolescent, Exercise, Sports, Stress mechanical
INTRODUCTION
Osteoporosis is a chronic disease with high prevalence worldwide,[1] which is responsible for great economic burden for individual and society as a whole.[2]
The disease is characterized by deficiency of bone mass, bone strength and altera- tions in bone microstructure, which can lead to a higher risk of stress fractures.[3]
Although we recognize the importance of bringing attention to the treatment of osteoporosis and its consequences among adults and elderlies, it is equally essen- Corresponding author
Ricardo R. Agostinete
Department of Physical Education, Laboratory of Investigation in Exercise (LIVE), São Paulo State University (UNESP), Roberto Simonsen Street 305, Presidente Prudente, Zip Code 19060-900, São Paulo, Brazil
Tel: +55-18-3229-5712 Fax: +55-18-3221-4391
E-mail: [email protected] Received: June 17, 2016
Revised: August 8, 2016 Accepted: August 8, 2016
No potential conflict of interest relevant to this article was reported.
This work was supported by the São Paulo Research Foundation (FAPESP). (Process: 2013/06963-5 and 2015/13543-8)
Original Article
tial to focus on disease prevention during youth.[4]
Adolescence is a crucial juncture for bone mass acquisi- tion,[5] and studies have shown a relationship between low bone mineral density (BMD) in adolescence and the occurrence of fracture [6] and osteoporosis in adulthood.
[7,8] Along with biological factors, nutrition and having an active lifestyle [9] are influencing factors linked to peak bone mass gain reached in adolescence. Among adoles- cents, sports participation is a typical indicator of physical activity.[10] The osteogenic effect attributed to sports is mainly produced by muscle’s mechanical load and strain on bones, affecting bone strength and geometry in sites specifically led by the form of activity.[11] However, not all sports have the same effects on bone; a minimum dura- tion and intensity are required for this osteogenic stimulus to be produced.[12]
Studies have shown that high impact sports have great- er osteogenic effect than non-impact sports, such as swim- ming or cycling, in children, young adults [13] or older adults.
[14] Regarding swimming, the sport is widely performed around the world and its practice is recommended for all age groups.[15] However, one systematic review analyzed the effect of swimming on bone mass, and was not able to conclude if swimming negatively affects or is neutral to BMD accrual.[16] In fact, swimming in “hypogravity” condi- tions has potential to decrease the bone formation because it decreases the time engaged in weight-bearing activities usually observed in the daily activities of adolescents.[17, 18] Therefore, adolescents engaged in organized sports who compete at the national levels would be more exposed to these deleterious effects, because they are engaged in long routines of training during most part of the year.
The objective of this longitudinal study was to analyze the effect of swimming on BMD gain among Brazilian ado- lescents engaged in national level competitions. We have hypothesized that BMD gains in swimmers are similar to those gains observed in the control group, as well as the time exposed to swimming practice is determinant on BMD gains independently of sex and biological maturation.
METHODS
1. SampleThis is a longitudinal study conducted from October 2013 to August 2014 and it was previously approved by the ethi-
cal board of the university. In the present study, the ado- lescents had to fulfill all inclusion criteria to be included in the follow-up group. As inclusion criteria we had: (i) age between 11 and 17 years old; (ii) prior authorization signed by coaches and parents; (iii) a minimum of six months of previous engagement for swimming group or absence of participation in any organized sport during the last six mon- ths (control); (iv) no use of medication that could affect bone metabolism; (v) a signed consent form.
The minimum number of adolescents per group (n=8) was previously estimated through an equation based in the parameters provided by the independent Student t- test. The parameter adopted were: mean difference be- tween swimming and control groups (0.08 g/cm2), stan- dard deviation for control group (0.06 g/cm2), standard de- viation for swimming group (0.05 g/cm2), power of 80%
and Z=1.96 [19]. Therefore, the minimum sample size of 32 adolescents was established (n=16 swimmers [8 boys and 8 girls] and n=16 controls [8 boys and 8 girls]).
The present follow-up study is part of a greater cohort study, which includes other sports. The realization of the study was divulgated to the Department of Sports (respon- sible by all public sport clubs), Department of Education (responsible by all public and private schools) and private sports clubs (located at metropolitan region and other cit- ies around). Coaches (sport clubs) and principals (school units) were contacted after authorization of these adminis- trative structures. Swimmers were contacted in sports clubs regularly registered in competitions at national level, while control group were contacted in three school units. At the end of the cohort period, the overall sample was compos- ed of 55 adolescents (29 boys and 26 girls); the control group contained 29 adolescents (13 boys and 16 girls) and the swimming group was composed of 26 athletes (16 boys and 10 girls) participating in competitions at national level.
2. Data related to swimming and vitamin D score
Coaches reported training routines of athletes (mean=
1,051.9 min per week [95% confidence interval (CI) 968.4- 1,135.3]; minimum 675 min per week and maximum 1,140 min week) and a minimum previous practice of six months was requested to consider the swimmer eligible to the co- hort study (63.2 months [95% CI 46.9-79.5]; minimum 9 months maximum 155 months). The group of swimmers
was engaged in a minimum of five days per week of train- ing with a minimum of 130 min per session. Coaches also reported resistance training routines (n=14 swimmers [53.8%]; n=01 control group [3.4%]), which have been considered potential confounder in multivariate models.
A nutritionist created a questionnaire with foods rich in vitamin D commonly observed in Brazilian diet. The ado- lescents reported the frequency of consumption of vita- min D rich foods (Likert scale) during the week prior to evaluation (baseline [Swimmers vs. Controls with P-val- ue=0.522] and end of follow-up [Swimmers vs. Controls with P-value=0.827]) and the sum of the generated score was considered proxy of vitamin D intake during the co- hort period.
3. Bone mineral variables and body composition
In both moments of the cohort study, BMD (in g/cm2), body fat (BF; in percentage) and fat free mass (FFM; in kilo- grams) were assessed using a dual energy X-ray absorpti- ometry (DXA) scanner (Lunar DPX-NT; General Electric Heal- thcare, Little Chalfont, Buckinghamshire, UK) with GE Med- ical System Lunar software (version 4.7). A trained resear- cher tested the scanner quality prior to each day of mea- surement, following the manufacturer’s recommendations.
The precision of the device for measurements of BMD in terms of coefficient of variation was 0.66% (n=30 subjects assessed in two opportunities). The participants wore light clothing, without shoes and remained in the supine posi- tion on the machine for approximately 15 min. BMD was measured at: (i) upper limbs, (ii) lower limbs, (iii) spine and (iv) whole body.
4. Biological maturation
Body weight was measured using an electronic scale (Filizzola PL 150, Filizzola Ltda., Brazil), and height was as- sessed using a wall-mounted stadiometer (Sanny; Ameri- can Medical do Brasil LTDA, São Bernardo do Campo, SP, Brazil). The leg length and sitting-height were measured using standardized techniques. These measurements were used to calculate the maturity offset, which denotes the time (years) from/to age peak of height velocity (PHV), an important maturational event.[19] Swimmers and control group were similar according to PHV in both baseline (P- value=0.077) and follow-up (P-value=0.141).
5. Statistical analysis
Descriptive statistics were presented as mean and stan- dard error of the mean. Repeated measures analysis of variance (ANOVA) analyzed the effect of swimming and sex on body composition variables (adjusted by chrono- logical age [baseline], vitamin D score [baseline], PHV [base- line and mean difference between baseline and follow- up], engagement in resistance training [baseline] and pre- vious practice of swimming in months [baseline]). Mea- surements of the effect size were provided by Eta-Squared (ES-r; small effect size 0.010, medium effect size 0.060 and large effect size 0.140). Partial correlation analyzed the re- lationship between time of previous practice and BMD modifications among adolescents of both sexes, adjusted by confounders. All statistical procedures were conducted using BioEstat software, version 5.2 (Bioestat, Tefé, Brazil) and statistical significance set at 0.05.
RESULTS
Overall sample was composed of 55 adolescents (29 boys and 26 girls). At baseline, boys and girls were similar in age (boys 12.7±2.1 years, girls 13.1±2.1 years; P=0.526), age PHV (boys -2.17±1.6 years, girls: -1.77±1.48 years; P=
0.363), BMD (boys 1.045±0.097 g/cm2, girls 1.042±0.107 g/cm2; P=0.903) and bone mineral content (BMC) (boys 2165.1±571.1 g, girls 2055.7±538.9 g; P=0.470).
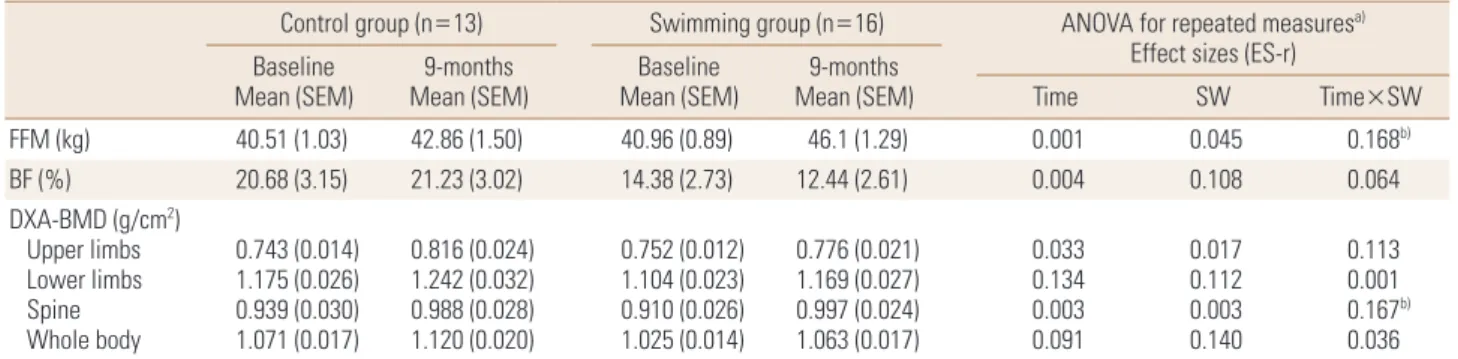
Among boys, FFM values were similar between control and swimming groups at baseline, while during the follow- up swimmers presented higher gains (Control 2.35 kg vs.
Swimming 5.14 kg; large effect size [ES-r=0.168]) Body mass and height were similar between swimmers and con- trols, while swimmers were slightly older than control group at baseline (P=0.043). Similarly, gains in BMD-Spine were higher among swimmers compared to control adolescents (Control 0.049 g/cm2 vs. Swimming 0.087 g/cm2; large ef- fect size [ES-r=0.167]) (Table 1). Girls, however, presented no differences when comparing the control and swimming groups. Body mass and height were similar between swim- mers and controls, and different than observed among boys, chronological age was similar between swimmers and con- trols at baseline (P=0.344) (Table 2).
Taking into account the engagement in swimming, boys gained more FFM than girls (10.63% vs. 3.39%, respective- ly). In the multivariate model that compared swimmers
boys and girls, there were no significant covariate, but even non-significant, the baseline values of PHV explained 15.1%
of the variance observed in gains of FFM. Similarly, among control adolescents, boys gained more BMD in spine than girls (8.47% vs. 4.32%, respectively) (Table 3).
The relationship between previous time engaged in swim- ming and modifications in BMD identified that longer par- ticipation negatively affected gains in upper limbs among boys (r=-0.438 [-0.693 to -0.085]), and in spine among girls (r=-0.651 [-0.908 to -0.036]) (Fig. 1).
Table 1. Effect of swimming on body composition variables among male adolescents (n=29)
Control group (n=13) Swimming group (n=16) ANOVA for repeated measuresa) Effect sizes (ES-r) Baseline
Mean (SEM) 9-months
Mean (SEM) Baseline
Mean (SEM) 9-months
Mean (SEM) Time SW Time×SW
FFM (kg) 40.51 (1.03) 42.86 (1.50) 40.96 (0.89) 46.1 (1.29) 0.001 0.045 0.168b)
BF (%) 20.68 (3.15) 21.23 (3.02) 14.38 (2.73) 12.44 (2.61) 0.004 0.108 0.064
DXA-BMD (g/cm2) Upper limbs Lower limbs Spine Whole body
0.743 (0.014) 1.175 (0.026) 0.939 (0.030) 1.071 (0.017)
0.816 (0.024) 1.242 (0.032) 0.988 (0.028) 1.120 (0.020)
0.752 (0.012) 1.104 (0.023) 0.910 (0.026) 1.025 (0.014)
0.776 (0.021) 1.169 (0.027) 0.997 (0.024) 1.063 (0.017)
0.033 0.134 0.003 0.091
0.017 0.112 0.003 0.140
0.113 0.001 0.167b) 0.036
a)Model adjusted by chronological age (baseline), vitamin D score (baseline), peak height velocity (baseline and mean difference between baseline and follow-up), engagement in resistance training (baseline) and previous practice of the swimming in months (baseline). b)ANOVA with P<0.05.
ANOVA, analysis of variance; SEM, standard error mean; BMD, bone mineral density; FFM, fat free mass; BF, body fatness; DXA, dual energy X-ray ab- sorptiometry; SW, swimming; ES-r, eta-squared.
Table 2. Effect of swimming on body composition variables among female adolescents (n=26)
Control group (n=16) Swimming group (n=10) ANOVA for repeated measuresa) Effect sizes (ES-r) Baseline
Mean (SEM) 9-months
Mean (SEM) Baseline
Mean (SEM) 9-months
Mean (SEM) Time SW Time×SW
FFM (kg) 31.05 (1.31) 32.83 (1.47) 35.18 (1.81) 36.86 (2.04) 0.009 0.110 0.001
BF (%) 32.61 (3.03) 31.87 (2.88) 19.93 (4.21) 21.19 (4.01) 0.004 0.183 0.049
DXA-BMD (g/cm2) Upper limbs Lower limbs Spine Whole body
0.726 (0.021) 1.106 (0.035) 0.987 (0.037) 1.048 (0.028)
0.774 (0.028) 1.132 (0.033) 1.050 (0.046) 1.074 (0.028)
0.710 (0.028) 1.061 (0.048) 0.962 (0.051) 1.033 (0.038)
0.752 (0.038) 1.105 (0.045) 1.044 (0.064) 1.077 (0.039)
0.030 0.012 0.001 0.014
0.010 0.017 0.002 0.001
0.002 0.068 0.018 0.099
a)Model adjusted by chronological age (baseline), vitamin D score (baseline), peak height velocity (baseline and mean difference between baseline and follow-up), engagement in resistance training (baseline) and previous practice of the swimming in months (baseline).
ANOVA, analysis of variance; SEM, standard error mean; BMD, bone mineral density; FFM, fat free mass; BF, body fatness; DXA, dual energy X-ray ab- sorptiometry; SW, swimming; ES-r, eta-squared.
Table 3. Body composition changes (%) in adolescents according to swimming and sex (n=55) Control group (n=29)
ES-ra)
Swimming group (n=26)
ES-ra) Girls (n=16)
Mean (95% CI) Boys (n=13)
Mean (95% CI) Girls (n=10)
Mean (95% CI) Boys (n=16) Mean (95% CI)
FFM (kg) 6.44 (2.51 to 10.38) 11.17 (6.71 to 15.64) 0.095 3.39 (0.17 to 6.61) 10.63 (8.17 to 13.09) 0.406b) BF (%) -0.53 (-10.27 to 9.19) 0.83 (-10.22 to 11.98) 0.001 6.29 (-8.48 to 21.06) -8.18 (-19.46 to 3.09) 0.115 DXA-BMD (g/cm2)
Upper limbs Lower limbs Spine Whole body
7.62 (4.03 to 11.21) 3.25 (1.71 to 4.79) 4.32 (1.65 to 7.01) 3.09 (1.93 to 4.25)
6.77 (2.69 to 10.84) 5.64 (3.98 to 7.39) 8.47 (6.11 to 10.82) 3.65 (2.34 to 4.97)
0.004 0.150 0.185b) 0.017
5.48 (2.34 to 8.62) 3.02 (0.60 to 5.44) 7.33 (3.48 to 11.17) 3.77 (2.26 to 5.28)
4.96 (2.56 to 7.36) 5.96 (4.11 to 7.81) 9.13 (6.20 to 12.06) 4.16 (3.01 to 5.32)
0.004 0.167 0.029 0.009
a)Model adjusted by chronological age (baseline), vitamin D score (baseline and follow-up), peak height velocity (baseline and mean difference between baseline and follow-up), engagement in resistance training (baseline) and previous practice of the swimming in months (baseline). b)ANOVA with P<0.05.
CI, confidence interval; BMD, bone mineral density; FFM, fat free mass; BF, body fatness; DXA, dual energy X-ray absorptiometry; ES-r, eta-squared.
DISCUSSION
This longitudinal study analyzed the effect of swimming on bone density gains among Brazilian adolescents and found that boys gained more whole body FFM and BMD in the spine than girls, despite participating in swimming. Ad- ditionally, we identified that longer participation in swim- ming negatively affected BMD gains in both sexes.
Since early age, sex seems to affect the effect of physical exercise on bone. In adolescence, there is a large increase in bone mass due to growth spurt and higher mineraliza- tion rate,[20-22] which is higher in boys and determines the stores observed in adult life.[23] The different gains observed between boys and girls are similar to other stud- ies [17,18] and it can be explained at least in part by hor- monal characteristics that affect the metabolic processes during this maturation period.[24]
Moreover, gains in FFM among male swimmers could be also used to explain these sex differences, because lean tis- sue mass is an independent predictor of regional and total BMD.[12,25-27] The relationship between BMD, total body weight and lean mass is supported by previous studies.
[25,27] Therefore, bone could be considered a calcified tis- sue sensitive to loading and muscular contractions [25]
and thus more sensitive in male adolescents due to the higher FFM gain.
Maturational aspects affect the differences in FFM gains between boys and girls. Among swimmers, baseline values
of PHV explained 15% of the variance observed among boys and girls for FFM changes, while the same phenome- non was not observed in the control group, in which base- line values of PHV explained only 0.4% of the variance in FFM changes. Our findings identify that the effects of bio- logical maturational on FFM gains can be boosted by sport participation, but additional studies are necessary to bet- ter understand the relationship between sports and matu- ration.[28]
Despite the beneficial effect of swimming on FFM, we identified that longer time engaged in swimming nega- tively affected BMD gains in upper limbs among boys and in spine among girls, consistent with the results found by Czeczelewski and colleagues.[29] This result could be ex- plained due to the fact that swimming reduces the effect of gravitational forces on bone structure,[20,30] which is considered essential for shaping bone density.[31,32] More- over, swimmers usually spend less time in weight-bearing daily activities.[17,18]
Another hypothesis to explain this finding is based on the fact that exercise performed at high intensity drives up levels of pro-inflammatory markers such as C-reactive pro- tein and interleukin-6, reducing the action of the growth hormone (GH) / insulin-like growth factor (IGF-1) axis, thus resulting in a catabolic response in the bone tissue.[33] The exhaustive exercise routine, which athletes are expose to, can increase significantly inflammatory markers in blood- stream [33] leading to catabolic effects, mainly when main- Fig. 1. Partial correlation between time of previous practice and bone mineral density modifications among adolescents of both sexes (n=55).
*Partial correlation adjusted by chronological age (baseline), vitamin D score (baseline and follow-up), peak height velocity (baseline), fat free mass (baseline), engagement in resistance training (baseline) and height. CI, confidence interval.
Gains (g/cm2) in body mineral density after 9-months of follow-up
Female adolescents
(n=26) Whole body
Spine Lower limbs Upper limbs Whole body Spine Lower limbs Upper limbs Male adolescents
(n=29)
Partial correlation (r [95% CI])*
-1.0 -0.5 0 0.5 Previous practice of swimming (year)
tained by long periods.
The negative relationship between time of practice and bone gains is a relevant concern, because its effects could be harmful later in life. For instance, in post-menopausal former athletes, BMD and BMC do not differ between swim- mers and runners, while the same variables are significant- ly higher in athletes when compared to controls.[34] The increased muscle mass and strength in athletes reflects significant physical training they used to undergo, which positively affects bone health later in life, preventing the decline in muscle and bone mass, reducing the likelihood of falling, and delaying morbidity and mortality.[14] On the other hand, even with significant improvements of FFM in swimmers, swimmer's bone structure was not ben- efited, denoting that the osteogenic effect linked to mus- cle contraction seems more effective when performed in environments with normal gravity.
As limitations we recognize the lack of information re- garding genetic predisposition, environmental factors, hor- monal status and nutritional intake. While exercise plays a fundamental role on bone health and it was analyzed in the current investigation, studies have shown that bone catabolism and reduced bone formation may occur if en- ergy intake is insufficient.[35] Moreover, insufficient calci- um intake as well as inadequate calcium-to-phosphate and protein-to-calcium ratios could have played an impor- tant role on decreased BMD among swimmers.[29] Finally, sex hormones and balance between pro and anti-inflam- matory markers are important in the maintenance of bone health among athletes performing high volumes of endur- ance training.[36,37]
In summary, over a 9-month follow-up, BMD and FFM gains were more evident in male swimmers, while longer engagement in swimming during childhood and adoles- cence seems negatively related to BMD gains, indepen- dently of sex.
REFERENCES
1. Winsloe C, Earl S, Dennison EM, et al. Early life factors in the pathogenesis of osteoporosis. Curr Osteoporos Rep 2009;7:140-4.
2. Rachner TD, Khosla S, Hofbauer LC. Osteoporosis: now and the future. Lancet 2011;377:1276-87.
3. Kanis JA, Melton LJ 3rd, Christiansen C, et al. The diagnosis
of osteoporosis. J Bone Miner Res 1994;9:1137-41.
4. Gunter KB, Almstedt HC, Janz KF. Physical activity in child- hood may be the key to optimizing lifespan skeletal health.
Exerc Sport Sci Rev 2012;40:13-21.
5. Bailey DA, Faulkner RA, McKay HA. Growth, physical activ- ity, and bone mineral acquisition. Exerc Sport Sci Rev 1996;
24:233-66.
6. Milgrom C, Simkin A, Eldad A, et al. Using bone’s adapta- tion ability to lower the incidence of stress fractures. Am J Sports Med 2000;28:245-51.
7. Nordström A, Karlsson C, Nyquist F, et al. Bone loss and fracture risk after reduced physical activity. J Bone Miner Res 2005;20:202-7.
8. Saggese G, Baroncelli GI, Bertelloni S. Osteoporosis in chil- dren and adolescents: diagnosis, risk factors, and preven- tion. J Pediatr Endocrinol Metab 2001;14:833-59.
9. Gómez-Cabello A, Vicente-Rodríguez G, Albers U, et al.
Harmonization process and reliability assessment of an- thropometric measurements in the elderly EXERNET multi- centre study. PLoS One 2012;7:e41752.
10. Strong WB, Malina RM, Blimkie CJ, et al. Evidence based physical activity for school-age youth. J Pediatr 2005;146:
732-7.
11. Frost HM, Schönau E. The “muscle-bone unit” in children and adolescents: a 2000 overview. J Pediatr Endocrinol Metab 2000;13:571-90.
12. Vicente-Rodríguez G. How does exercise affect bone de- velopment during growth? Sports Med 2006;36:561-9.
13. Karlsson MK, Nordqvist A, Karlsson C. Physical activity in- creases bone mass during growth. Food Nutr Res 2008;52.
14. Guadalupe-Grau A, Fuentes T, Guerra B, et al. Exercise and bone mass in adults. Sports Med 2009;39:439-68.
15. Kostka T, Furgal W, Gawronski W, et al. Recommendations of the Polish Society of Sports Medicine on age criteria while qualifying children and youth for participation in various sports. Br J Sports Med 2012;46:159-62.
16. Gómez-Bruton A, Gónzalez-Agüero A, Gómez-Cabello A, et al. Is bone tissue really affected by swimming? A sys- tematic review. PLoS One 2013;8:e70119.
17. Gómez-Bruton A, González-Agüero A, Gómez-Cabello A, et al. Swimming and bone: is low bone mass due to hypo- gravity alone or does other physical activity influence it?
Osteoporos Int 2016;27:1785-93.
18. Gómez-Bruton A, González-Agüero A, Gómez-Cabello A, et al. The effects of swimming training on bone tissue in
adolescence. Scand J Med Sci Sports 2015;25:e589-602.
19. Mirwald RL, Baxter-Jones AD, Bailey DA, et al. An assess- ment of maturity from anthropometric measurements.
Med Sci Sports Exerc 2002;34:689-94.
20. Bellew JW, Gehrig L. A comparison of bone mineral density in adolescent female swimmers, soccer players, and weight lifters. Pediatr Phys Ther 2006;18:19-22.
21. Sanchis-Moysi J, Dorado C, Olmedillas H, et al. Bone mass in prepubertal tennis players. Int J Sports Med 2010;31:416- 20.
22. Vicente-Rodriguez G, Dorado C, Perez-Gomez J, et al. En- hanced bone mass and physical fitness in young female handball players. Bone 2004;35:1208-15.
23. Davies JH, Evans BA, Gregory JW. Bone mass acquisition in healthy children. Arch Dis Child 2005;90:373-8.
24. Loomba-Albrecht LA, Styne DM. Effect of puberty on body composition. Curr Opin Endocrinol Diabetes Obes 2009;
16:10-5.
25. Andreoli A, Monteleone M, Van Loan M, et al. Effects of different sports on bone density and muscle mass in high- ly trained athletes. Med Sci Sports Exerc 2001;33:507-11.
26. Taaffe DR, Snow-Harter C, Connolly DA, et al. Differential effects of swimming versus weight-bearing activity on bone mineral status of eumenorrheic athletes. J Bone Min- er Res 1995;10:586-93.
27. Taaffe DR, Marcus R. Regional and total body bone miner- al density in elite collegiate male swimmers. J Sports Med Phys Fitness 1999;39:154-9.
28. Ferry B, Lespessailles E, Rochcongar P, et al. Bone health during late adolescence: effects of an 8-month training program on bone geometry in female athletes. Joint Bone
Spine 2013;80:57-63.
29. Czeczelewski J, Długołęcka B, Czeczelewska E, et al. Intakes of selected nutrients, bone mineralisation and density of adolescent female swimmers over a three-year period. Biol Sport 2013;30:17-20.
30. Taaffe DR, Robinson TL, Snow CM, et al. High-impact exer- cise promotes bone gain in well-trained female athletes. J Bone Miner Res 1997;12:255-60.
31. Fehling PC, Alekel L, Clasey J, et al. A comparison of bone mineral densities among female athletes in impact load- ing and active loading sports. Bone 1995;17:205-10.
32. Risser WL, Lee EJ, LeBlanc A, et al. Bone density in eumen- orrheic female college athletes. Med Sci Sports Exerc 1990;
22:570-4.
33. Nemet D, Oh Y, Kim HS, et al. Effect of intense exercise on inflammatory cytokines and growth mediators in adoles- cent boys. Pediatrics 2002;110:681-9.
34. Andreoli A, Celi M, Volpe SL, et al. Long-term effect of ex- ercise on bone mineral density and body composition in post-menopausal ex-elite athletes: a retrospective study.
Eur J Clin Nutr 2012;66:69-74.
35. Hind K, Truscott JG, Evans JA. Low lumbar spine bone min- eral density in both male and female endurance runners.
Bone 2006;39:880-5.
36. Ackerman KE, Misra M. Bone health and the female ath- lete triad in adolescent athletes. Phys Sportsmed 2011;39:
131-41.
37. Ackerman KE, Skrinar GS, Medvedova E, et al. Estradiol levels predict bone mineral density in male collegiate ath- letes: a pilot study. Clin Endocrinol (Oxf) 2012;76:339-45.