114
HPLC-MS/MS를 이용한 트리클로로에틸렌 대사산물의 다중 분석법 확립
안영아*·고영림**·이승호*·신미연*·전중대**·김성균*,†
*서울대학교 보건대학원 환경보건학과, **을지대학교 보건환경안전학과
Multiple Determinations of Trichloroethylene Metabolites in a Concurrent Biological Media using High Performance Liquid Chromatography
Coupled with Tandem Mass Spectrometry
Youngah Ahn*, Younglim Kho**, Seungho Lee*, Mi-yeon Shin*, Jung Dae Jeon**, and Sungkyoon Kim*†
*Department of Environmental Health, Graduate School of Public Health, Seoul National University
**Department of Health, Environment and Safety, Eulji University
ABSTRACT
Objectives: We aimed to develop a measurement method of five metabolites of trichloroethylene(TCE) in a concurrent biological sample, e.g., trichloroacetic acid(TCA), dichloroacetic acid(DCA), S-(1,2-dichlorovinyl) glutathione(DCVG), S-(1,2-dichlorovinyl)-L-cysteine(DCVC), and N-Acetyl-S-(1,2-dichlorovinyl)-L-cysteine (NAcDCVC) and to validate the method before application to pharmacokinetic study.
Methods: TCE metabolites were simultaneously analyzed using high performance liquid chromatography coupled with electrospray ionization mass spectrometry(HPLC-ESI-MS/MS) with as little as 50 µL of serum and urine. DCA, TCA and NAcDCVC were extracted with diethyl ether, while DCVC and DCVG were extracted by solid phase extraction. This method was validated according to the guidelines for bioanalytical method validation of the Korean National Institute of Toxicological Research. Then, we determined the five metabolites in five strains of mice at 24 hr after exposure to 1 g TCE/kg body weight.
Results: The limits of detection for the five metabolites in biological samples ranged from 0.001 to 0.076 nmol/mL, which is comparable to or better than those previously reported. Most calibration curves showed good linearity (R
2=0.99), and between-batch variation was less than 20% expressing acceptable robustness and reproducibility.
Using this method, we found TCA and DCA were detected in all test mice at 24 hr after the oral administration while NAcDCVC and DCVC were detected in some strains, which showed strain-dependent metabolism of TCE.
Conclusions: The present method could provide robust and accurate measurements of major key metabolites of TCE in biological media, which allowed concurrent analysis of TCE metabolism for limited amounts of bio- specimens.
Keywords: Biomarkers, Exposure, HPLC-ESI-MS/MS, Metabolites, Trichloroethylene
†
Corresponding author: Department of Environmental Health, Graduate School of Public Health, Seoul National University, Seoul, 151-742, Korea, Tel:+82-2-880-2732, Fax: +82-2-745-9104, E-mail: [email protected]
Received: 3 February 2014, Revised: 31 March 2014, Accepted: 14 April 2014
I. 서 론
트리클로로에틸렌(TCE)은 유용한 산업물질로 광 범위한 용도로 작업장에서 사용되고 있지만,1) 세계 적으로 지하수의 가장 흔한 오염물질로 발견되며 우 리나라도 일반인구집단에게 TCE 노출이 일어날 가 능성이 높다.2) TCE의 장기적 노출과 신장암(renal cell carcinoma)3)과 lymphoma4) 발생에 대한 역학연 구와 더불어 국제암연구소(IARC)가 TCE를 인체발 암가능 물질로 확정한 점은 TCE의 인체 건강위해 성에 대한 주의를 새롭게하는 계기가 되었다.5)
TCE 대사와 독성에 관한 많은 연구 결과가 발표 되었지만 인체 유해성 및 발암성과 관련된 독성 기 전과 감수성 결정인자는 구체적으로 밝혀지지 않았 다.6)다만 TCE의 대사산물의 반응활성이 높아 독성 이 이와 관련된 실험연구나 단위 물질별 연구가 있 어왔다.6)이는 TCE의 대사산물이 독성을 유발함에 도 불구하고 생체시료에서 대사산물들을 측정하는
기술적인 어려움으로 인해 대사과정과 기관독성 기 전을 온전히 이해하지 못했기 때문이다. TCE의 대 사는 크게 두 가지 경로로 이루어진다. 하나는 cytochrome p450(CYP45)에 의한 산화적 대사이고 다른 하나는 glutathione-S-transferases(GSTs)에 의한 중합체 형성이다. 여러 대사산물 중 산화물은 chloral hydrate(CH)와 trichloroacetic acid(TCA), dichloroacetic acid(DCA) 등이 주로 연구되었고, 글루타치온(GSH) 중합체로는 S-(1,2-dichlorovinyl) glutathione(DCVG)와 S-(1,2-dichlorovinyl)-L-cysteine(DCVC) 등이 대표적 이다(Fig. 1). 또한GSH 중합체의 대사산물로 해독작 용에 관여하는N-Acetyl-S-(1,2-dichlorovinyl)-L- cysteine(NAcDCVC)는 상대적으로 안정적이고 배설 이 용이하여 TCE 독성연구에 중요한 물질이다.7-10)
본 연구에서는 소량의 생체시료에서 TCE 대사산 물 중 TCA, DCA, DCVG, DCVC, NAcDCVC를 소량의 시료 하나에서 다중 측정하는 방법을 개발하 고 분석법 타당성을 평가 하였다. 현재까지 생체시
Fig. 1. Metabolism of trichloroethylene
23).
료 내 4가지 TCE 대사산물 분석법을 발표한 논문 은 있었으나, HPLC-MS/MS를 이용하여 다섯 가지 TCE 대사산물에 대한 동시 측정방법을 수립하고 이 를 이용하여 NAcDCVC를 in vivo 샘플에서 측정한 사례는 우리가 알기에 본고가 최초이다.11)
II. 재료 및 방법 1. 표준물질 및 시약
전처리와 분석에 사용한 모든 시약은 HPLC급과 anhydrous certified ACS grade로서, 물과 ethyl ether, methanol, acetic acid, ammonium hydroxide(25%), 황산(96%), 2-(2-methoxyethoxy)ethanol(2-MEE, 99%), Acetonitrile(ACN, 99+%), TCA(99+%), DCA(99+%) 은 Fisher scientific(Pittsburgh, PA)에서 구입하였다.
Ammonium formate salt(99.9%), [13C2]DCA, [13C]TCA 는 Sigma Aldrich(St. Louis, MO)에서 구입하였다. 분 석에 사용된 GSH-중합체(conjugates)의 표준물질과 방사산동위원소로 표지된 내부표준물질 중 DCVG, DCVC, [13C4,15N]DCVG, [13C5,15N]DCVC, [13C4,15N]
NAcDCVC는 문헌에 소개된 방법을 이용하여12) University of North Carolina at Chapel Hill의 Avram Gold 박사([email protected])가 합성한 것을 제공 받아 사용하였으며, NAcDCVC은 Toronto Research Chemicals(Ontario, Canada)에서 구매하여 사용하였다 . Zoletil 50(Virbac, France)과 Rompoun(Bayer, Germany)은 마우스 마취액을 만들기 위해 구매하였다.
2. 분석기기와 소모품
HPLC-ESI-MS/MS는 Agilent 1100 series(Santa Clara, CA, USA)와 Shiseido Nanospace SI-2 (Shiseido, Japan) 그리고 AB SCIX의 API 4000 (Redwood city, CA)을 사용하였다. Luna Amino HPLC column(150×2.0 mm, 3 μm)과 Strata X-AW solid-phase extraction(SPE) Cartridge는 Phenomenex (Torrance, CA, USA)에서, Microcon centrifugal filter YM-30(30 kDa)은 Millipore(Billerica, MA, USA), YMC C18 column(150×2.0 mm, 3 μm)은 Waters사(Milford, MA, USA) 제품을 사용하였다.
3. 전처리 및 추출방법
전처리 및 추출방법은 Kim 등의 방법을 일부 수
정하여 사용하였는데 HAA와 NAcDCVC는 액액-추 출법을 GSH-conj은 고상추출법을 사용하였다.13)전 반적인 과정은 다음과 같다. 생체시료(소변) 50 μL 와 내부표준물질 5 μL([13C2]DCA 10 pmol/μL, [13C]TCA 125 pmol/L, [13C4,15N]NAcDCVC 2 pmol/L, [13C4,15N]DCVG 5 pmol/L, [13C5,15N] DCVC 20 pmol/L in methanol)를 YM-30 튜브에 넣고 잘 교반 시킨 후 3%(v/v) 황산(H2SO4)를 넣어서 이온화시킨다. 이 온화시킨 혼합물은 YM-30 필터를 이용하여 원심분 리여과하고(25oC, 14,000 g, 30 min), 여과된 시료는 4 mL 유리병에 옮긴 후 ethyl ether 2.5 mL를 넣는 다. 잘 교반시킨 후 ether 층이 분리가 되면 상층액 은 다른 4 mL 유리병에 옮겨 담아 질소가스를 이용 하여 5 μL의 추출물만 남긴 후, 산화적 대사산물 및 NAcDCVC분석에 이용할 이동상 혼합액(68.6% ACN, 29.4% 40 mM ammonium formate, pH 9.1, 2% 2- MEE) 100μL로 재조성하여 분석한다.
다음으로 ether층을 분리하고 남은 아래층 시료는 고상추출(Solid phase extraction, SPE) 카트리지 (Strata X-AW, 30mg, 96-well plate, Phenomenex)를 이용하여 로딩시킨 후, 염기성 메탄올(pH 10.8, NH4OH로써 pH조정)로 GSH 중합체 형성 대사산물 을 추출한다(~300 μL). 이어서 진공농축기(EYELA, Japan)을 이용하여 건조시킨 GSH 중합체 형성 대사 산물 분석을 위한 이동상(0.1% Acetic acid를 포함 한 80:20 물/메탄올) 20 μL로 재조성한다.
4. HPLC-ESI-MS/MS 조건 4.1. HPLC 조건
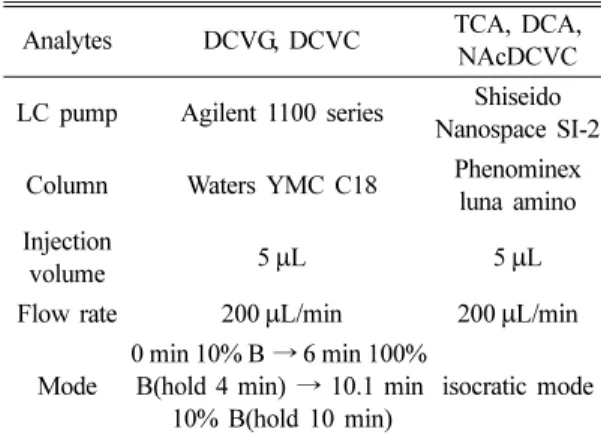
TCE의 대사경로에 따라 haloacetic acid(HAA)인 산화적 대사산물(TCA, DCA)과 mercapturic acid (NAcDCVC), GSH-중합체 대사산물(GSH-conjugate) 의 LC 및 MS조건을 다르게 조정하였다. HAA와 mercapturic acid는 등용매용리법(isocratic mode)으 로 amino column을 사용하여 3가지 물질을 한번에 검출하였다. 또한 GSH-중합체들은 C-18 column을 이용하여 구배용매조성법(gradient mode)으로 검출 하였다. LC조건은 Table 1과 같다.
4.2. 질량분석기 조건
대사산물의 표준물질과 내부표준물질을 분석하기 위해서 Harvard사의 Syringe pump 22(Holliston,
MA, USA)를 10 μL/min으로 유량을 설정한 후, Hamilton사의 1 mL Luer lock syringe(Reno, NV,
USA) 연결을 통해 분석물질을 질량분석기에 infusion 함으로써 최적화된 조건을 설정하였다. HAA과 mercapturic acid에 해당하는 물질은 electrospray ionization(ESI) negative mode에서 ion source energy는 -3000 V로, 중합체 형성 대사물질들은 ESI positive mode로 ion source energy가 5500 V에서 MRM(multiple reaction monitoring) mode로 검출하 였다. 각 대사산물의 정성 및 정량을 위한 이온 값 에 대한 기기조건은 Table 2에 정리하였다.
5. 분석방법의 타당성
TCE 대사산물 동시분석법의 타당도 분석은 식품의 약품안전처의 “생체시료분석법 밸리데이션 해설서”14) 에 의거하여 시행되였다. TCE 대사산물의 농도산출 을 위한 검량선의 직선성은 선형회귀식의 결정계수 (R2)를 확인하여 직선성을 검토하고, 검출한계(lower limit of detection, LLOD)와 검량한계(lower limit of quantitation, LLOQ)는 검량선의 회귀직선 기울기 및
Table 1. Liquid chromatography condition for TCE
metabolites analysis
Analytes DCVG, DCVC TCA, DCA,
NAcDCVC LC pump Agilent 1100 series Shiseido
Nanospace SI-2 Column Waters YMC C18 Phenominex
luna amino Injection
volume 5 µL 5 µL
Flow rate 200 µL/min 200 µL/min
Mode
0 min 10% B → 6 min 100%
B(hold 4 min) → 10.1 min 10% B(hold 10 min)
isocratic mode Note. DCVG: S-(1,2-dichlorovinyl)glutathione, DCVC: S- (1,2-dichlorovinyl)-L-cysteine, TCA: Trichloroacetic acid, DCA: Dichloroacetic acid, NAcDCVC: N-Acetyl- S-(1,2- dichlorovinyl)-L-cysteine
Table 2. MS/MS parameter of TCE metabolites
Compounds Q1 Mass(amu) Q3 Mass(amu) Dwell time(msec) DP CE CXP
TCA 160.9 116.7 80 -25 -10 -5
116.2 -25 -6 -31
[
13C]TCA 161.7 116.8 80 -25 -10 -7
128.9 -25 -10 -7
DCA 127 82.8 80 -30 -16 -5
70.9 -30 -8 -1
[
13C
1]DCA 127.9 84 80 -25 -14 -5
92.8 -25 -22 -9
NAcDCVC 256 126.9 80 -30 -10 -1
119.9 -30 -8 -7
[
13C
4,
15
N]NAcDCVC 261.9 126.8 80 -30 -10 -7
124.8 -30 -8 -1
DCVC 215.9 198.9 90 46 17 16
126.9 46 29 10
[
13C
5,
15N]DCVC 222 128.8 90 41 29 10
138.9 41 23 10
DCVG 402.1 273.1 90 61 21 8
170 61 31 16
[
13C
4,
15N]DCVG 407.1 278.1 90 81 25 8
172 °° 81 31 8
Note. Q1: Parent mass, Q3: Daughter mass, DP: Declustering potential, CE: Collision energy, CXP: Collision cell exit potential
y 절편의 표준편차를 이용하여 산출하였다.15) 분석 대상 시료와 동일한 생체 공시료를 사용하기 위해 정상적인 사람의 소변시료를 pooling하여 사용하였 다. 분석의 정확도 및 정밀도는 예상되는 농도범위 의 저농도, 중도도, 고농도를 정하여 일중(within day, n=6) 및 일간(between day, n=6) 샘플을 측정한 값 을 이용하여 산출하였다. 정확도(accuracy)는 검량선 에 의해 계산된 농도의 평균값을 참값의 농도로 나 눈 비를 백분율(%)로 나타내었으며, 정밀도(precision) 는 동일시료의 반복측정을 통하여 얻은 표준편차를 농도로 나눈 변이계수(CV, %)로 구하였다.
6. 생체시료 적용
타당성평가를 마친 분석법은 마우스 소변 중 TCE
대사산물 측정에 적용하였다. 동물실험은 서울대학 교 동물윤리심의위원회IACUC)의 승인을 받은 후 수 행하였다. 실험에 사용된 마우스는 DBA/2, BALB/c, 129S1/SvImJ, C57BL/6J, B6C3F1으로 총 5종(strain) 을 선정하였고, 7-9주령의 수컷으로 중앙실험동물과
㈜오리엔트바이오에서 구매하였다. 각 종마다 반복 실험 개체수는 각각 4-5마리로 총 22마리의 마우스 를 대상으로 하였다. vehicle(corn oil)에 TCE를 혼 합하여 TCE 1000 mg/kg/day 만큼 oral gavage로 경 구 투여하였으며 10 mL/kg 으로 4주(5회/주) 동안 반 복 투여시킨 후, 최종 투여 시점으로부터 24시간 후 마취제를 복강 주사하여 생체시료를 수거하였다. 마 우스용 마취제는 zoletil 50(Tiletamine : Zolazepam = 1 : 1) 0.6 mL, Rompoun(Xylazine) 0.4 mL, Saline
Fig. 2. HPLC-MS/MS chromatograms for standard mixture of five TCE metabolites and the corresponding retention times.
Note: * indicates an internal standard. TCA
*: [
13C
1]TCA, DCA
*: [
13C
1]DCA, NAcDCVC
*: [
13C
4,
15N]NAcDCVC,
DCVG
*:[
13C
4,
15N]DCVG, DCVC*: [
13C
5,
15N]DCVC
9 mL를 혼합한 후, 0.01 mL/10 g body weight 용량 만큼 주사하였다. 마우스의 소변시료는 개복한 즉시 1 mL 주사기로 방광에서 채취하여 cryo-tube에 옮겨 담고, 분석 전까지 −70oC도 이하에서 보관하였다.
III. 결 과 1. MS product ion transitions
각각의 분석물질의 표준시약을 희석하여 MS detector 에 직접 주입하여 MS/MS product ion 스펙트럼을 확인하였다. DCA, TCA, NAcDCVC는 negative ion mode로, DCVG와 DCVC는 positive mode로 분석 하였다(Table 2). Fig. 2는 TCA, DCA, NAcDCVC, DCVG, DCVC 각각의 peak를 보여주는 크로마토그 램이며, 사람의 소변시료 50 μL 당 표준물질과 내부 표준물질을 5 μL씩 넣어서 분석한 결과이다.
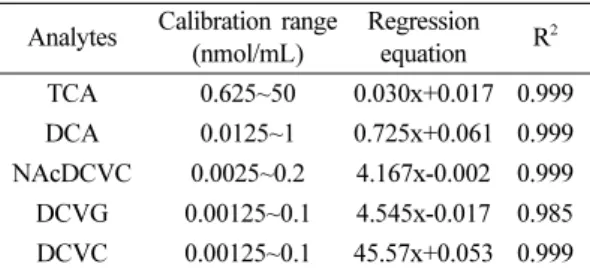
2. 직선성과 검출한계
TCE 대사산물의 정량을 위한 검량선은 공시료와 내부표준물질만 포함된 시료, 그리고 분석물질의 농 도범위를 포함한 6개 농도의 표준물질을 포함한 시 료를 통해 얻었고 이 검정곡선으로부터 직선성 (linearity)을 검토한 결과, 물질별 검출한계 및 검정
곡선의 범위를 얻을 수 있었다(Table 3). 각 대사산 물의 결정계수(R2) 값은 약 0.99이었다. 생체 시료 50 μl에 표준물질 5 μl를 넣어서 검출한계(lower limit of detection, LLOD)와 정량한계(lower limit of quantitation, LLOQ)를 도출하였다: TCA - 0.457 (1.371) nmol/mL, DCA - 0.039(0.117) nmol/mL, NAcDCVC - 0.006(0.018) nmol/mL, DCVG - 0.0004(0.0012) nmol/mL, DCVC - 0.0029(0.0087) nmol/mL [( )안은 LLOQ]. 이상의 결과는 다른 분 석방법과 견주어 손색없는 검출한계를 보여주고 있
Table 3. Calibration curves for TCE metabolites from
samples of six concentrations Analytes Calibration range
(nmol/mL)
Regression equation R
2TCA 0.625~50 0.030x+0.017 0.999 DCA 0.0125~1 0.725x+0.061 0.999 NAcDCVC 0.0025~0.2 4.167x-0.002 0.999 DCVG 0.00125~0.1 4.545x-0.017 0.985 DCVC 0.00125~0.1 45.57x+0.053 0.999 Note. DCVG: S-(1,2-dichlorovinyl)glutathione, DCVC: S- (1,2-dichlorovinyl)-L-cysteine, TCA: Trichloroacetic acid, DCA: Dichloroacetic acid, NAcDCVC: N-Acetyl- S-(1,2- dichlorovinyl)-L-cysteine, R
2: Coefficient of determination, LOD: Limit of detection
Table 4. Comparison of sensitivity of different assay method to present method
Analytes LOD(nmol/mL) Species Matrix Detection technique Reference TCA,
DCA, NAcDCVC, DCVG,
DCVC
0.4573 0.0391 0.0059 0.0004 0.0029
Human Urine HPLC-MS/MS Present
method
TCA, DCA
0.416
0.279 Human Plasma SPME-GC-ECD Mudiam et al.(2013)
24)TCA, DCA, DCVG, DCVC
0.4 0.01 0.001 0.001
Mouse Serum HPLC-MS/MS Kim et al.(2009)
13)TCA, DCA, DCVG, DCVC
0.05 0.05 50 0.5
Rat Blood GC-ECD (for TCA, DCA),
LC-UV (for DCVC, DCVG) Lash et al.(2006)
25)DCA 0.72 Rat Blood HPLC-MS/MS Delinsky et al.(2005)
26)TCA DCA
0.006
*0.0004
*Human Plasma
Urine GC-MS Jia et al.(2003)
27)Note. *: Method detection limits(MDL) reported
Table 5. Intraday precision and accuracy for 5 metabolites at 3 concentrations Analytes Concentrations(nmol/mL)
Precision
(CV, %) Accuracy(%)
(n = 6) Nominal Measured
(mean ± sd)
TCA Low 5 5.056 ± 0.137 2.70 101.12
Medium 25 26.355 ± 2.619 9.94 105.42
High 50 49.318 ± 1.429 2.90 98.63
DCA Low 0.1 0.102 ± 0.016 15.93 101.76
Medium 0.5 0.525 ± 0.030 5.64 105.08
High 1 0.988 ± 0.030 3.06 98.75
NAcDCVC Low 0.02 0.019 ± 0.002 9.06 92.83
Medium 0.1 0.106 ± 0.009 8.42 105.81
High 0.2 0.197 ± 0.002 1.08 98.65
DCVG Low 0.025 0.022 ± 0.003 13.69 86.31
Medium 0.05 0.041 ± 0.006 14.41 81.24
High 0.1 0.105 ± 0.007 6.37 105.30
DCVC Low 0.025 0.025 ± 0.003 11.07 100.65
Medium 0.05 0.048 ± 0.004 8.32 96.30
High 0.1 0.101 ± 0.004 3.96 101.05
Note. DCVG: S-(1,2-dichlorovinyl)glutathione, DCVC: S-(1,2-dichlorovinyl)-L-cysteine, TCA: Trichloroacetic acid, DCA:
Dichloroacetic acid, NAcDCVC: N-Acetyl- S-(1,2-dichlorovinyl)-L-cysteine
Table 6. Interday precision and accuracy for 5 metabolites at 3 concentrations Analytes Concentrations(nmol/mL)
Precision
(CV, %) Accuracy(%)
(n = 6) Nominal Measured
(mean ± sd)
TCA low 5 4.986 ± 0.193 3.8 99.7
medium 25 23.219 ± 3.747 16.1 92.9
high 50 51.181 ± 9.157 17.9 102.36
DCA low 0.1 0.090 ± 0.016 17.8 90.1
medium 0.5 0.487 ± 0.062 12.8 97.4
high 1 0.907 ± 0.128 14.1 90.7
NAcDCVC low 0.02 0.018 ± 0.002 8.3 91.9
medium 0.1 0.110 ± 0.010 8.8 110.2
high 0.2 0.195 ± 0.011 5.6 97.6
DCVG low 0.025 0.022 ± 0.004 18.0 89.2
medium 0.05 0.048 ± 0.009 19.1 96.1
high 0.1 0.1025 ± 0.009 9.3 102.1
DCVC low 0.025 0.025 ± 0.002 8.6 99.6
medium 0.05 0.049 ± 0.007 13.4 98.9
high 0.1 0.100 ± 0.004 4.2 100.4
Note. DCVG: S-(1,2-dichlorovinyl)glutathione, DCVC: S-(1,2-dichlorovinyl)-L-cysteine, TCA: Trichloroacetic acid, DCA:
Dichloroacetic acid, NAcDCVC: N-Acetyl- S-(1,2-dichlorovinyl)-L-cysteine
다(Table 4). Kim(2009)13)과 비교하면 HAA의 민감 도(sensitivity)도가 개선되었다고 할 수 없다. 하지만 실샘플에서 측정된 최소값이 LLOQ을 상회하고 있 고(Table 7), 동물 PK연구결과를 보면16) 충분히 적 용가능한 검출한계를 가지고 있다. 또한, Tables 5, 6에서 보듯 분석의 재현성(reproducibility)과 완건성 (robustness)이 크게 개선되었음을 확인할 수 있었다.
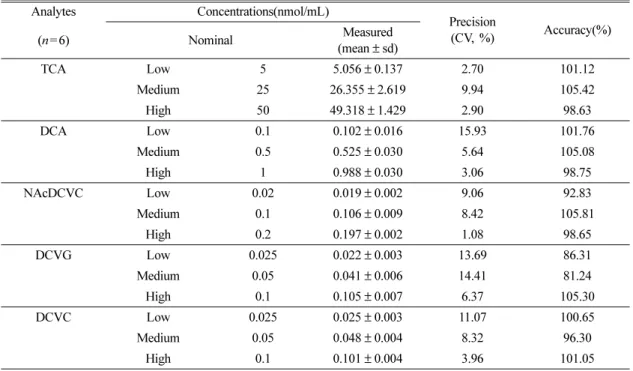
3. 정확도, 정밀도
5가지 대사산물의 분석법 검증을 위하여 일내 및 일간, 3단계의 농도로 정확성을 평가하였다. 일중 (Intra-day) 정확도는 82~106%의 범위 안에 해당하 였고(Table 5), 일간(Inter-day) 정확도는 78~113%의 범위를 나타내었다(Table 6). 정확도와 함께 세가지 농도 수준에서 일내 및 일간에 따른 변동계수(%, CV)를 계산하여 정밀성을 평가하였다. 일내 변이계 수는 2.5~15.9%였고(Table 5), 일간 변이계수는 3.9~19.1%의 범위 안에 해당하는 값을 나타냈다 (Table 6). 식품의약품안전처의 “생체시료분석법 밸 리데이션 해설서”에 따르면 정확도의 값은 최저 정 량한계에서는 ±20%, 정량한계를 제외한 농도에서는
±15%이내이어야 한다고 명시되어 있다. 따라서 본 분석방법은 생체 시료 중 TCE 대사산물을 분석하 는데 있어 적합하다고 할 수 있다.
4. 생체시료 적용
TCE대사산물 동시분석법의 타당성 평가를 마친 후, TCE에 노출된 마우스의 생체시료 중 소변을 이 용하여 분석하였다. Fig. 3에서는 4주 동안 TCE에 노출된 마우스 중 BALB/c의 요중 DCA와 TCA의 크로마토그램과 DBA/2의 NAcDCVC, DCVG, DCVC의 크로마토그램을 나타내었다. 왼쪽 크로마 토그램은 소변에서 검출된 TCE 대사산물에 해당하
는 peak이며, 오른쪽은 내부표준물질의 peak이다.
DCVG를 제외한 4가지 대사산물이 검출되었으며, 각 물질의 농도범위는 Table 7과 같다. 각 대사산물의 최 소농도와 최대농도는 DCA 0.104~0.546 nmol/mL, TCA 2.855~491.806 nmol/mL, NAcDCVC <LOD~
0.983 nmol/mL, DCVC <LOD~0.014 nmol/mL로 나 타났으며, DCVG는 검출되지 않았다.
IV. 고 찰
TCE의 독성기전에 대한 연구가 더딘 것은 생체 내 에서 TCE의 독성을 유발하는 대사체를 정밀하게 정량 하는 방법의 마땅치 않았던 점도 이유가 될 것이다. 과 거 DCA의 정량법은 실제 생체시료 내 DCA의 양을 정량한 것이 아니라, 전처리과정에서 TCA에서 유래한 부산물을 측정하던 오류가 있었다.17)이런 부정확한 측 정결과가 TCE의 physiologically-based pharmacokinetic 모델의 validation에 사용되었고18)최근에 이르러서 이 런 오류가 수정되었다.19) TCA와 DCA, 그리고 DCVC, DCVG등을 하나의 샘플에서 동시 측정할 수 있는 기 법은 2009년 개발된 방법이 유일했는데13), 본고는 이 방법을 크게 변환시키지 않으면서 NAcDCVC를 추가 적으로 정량하는 방법을 제시하고자 하였다. NAcDCVC 는 DCVC가 N-acetylation된 대사물질이다. DCVC 자 체도 bioactive한 물질이지만 DCVC는 신장에서 β-lyase 에 의해 보다 유해한 chlorothioketene로 변환되거나 FMO-3에 의해 DCVC sulfoxide가 될 수 있다.6) 모두 cytotoxic하여 물질로 신독성의 이유가 되는 물질인데, N-acetyltrasferase(NAT)에 의해 mercapturic acid (NAcDCVC)로 변환되면 친수성이 높은 안정한 물질 이기에 체내로 신속히 배설될 수 있다. 따라서 체내에 서 NAcDCVC와 DCVC의 농도 수준을 비교하는 것
Table 7. Level of TCE metabolites in spot urine of mouse exposed at 1 g TCE/kg body weight for 4 weeks(nmol/mL)
N Detection rate(%) Min 25th 50th 75th Max
DCA 22 100.0 0.104 0.123 0.135 0.164 0.546
TCA 22 100.0 2.855 3.650 5.838 215.653 491.807
NAcDCVC 22 36.4 < LOD
*< LOD
*< LOD
*0.013 0.983
DCVG 22 0.0 ND ND ND ND ND
DCVC 22 13.6 < LOD
**< LOD
**< LOD
**< LOD
**0.014
Note.
*, Chromatogram detected below the limit of detection, 0.004 nmol/mL in mouse urine;
**, Chromatogram detected below
the limit of detection, 0.002nmol/mL in mouse urine; ND, no chromatogram detected.
은 GSH-중합체 형성의 metabolic flux를 살핌에 있어 독성학적으로 중요한 의미를 가지고 있다고 할 수 있다.
NAcDCVC는 화학구조식상으로 카르복실산기를 가지고 있고 pKa값이 -0.93과 3.22로서 생리학적 용 액에서 대부분 음전하를 띄고 있어 TCA와 DCA와 화학적으로 유사한 특성을 공유하고있다. 본 연구에
서는 이점에 주안점을 두고 산 처리를 통한 protonation 에 이어 diethyl ether로 추출하여 정량 하였는데 HAA와 동시 정량이 가능하면서 높은 민감도와 특 이도를 성공적으로 유지할 수 있었다. 다른 GSH-중 합체의 경우 pKa값은 2.21와 9.29(DCVG), 그리고 2.01와 7.94(DCVC)로 생리적인 pH에서 zwitter ion
Fig. 3. Chromatograms of analytes in spot urine of mouse after TCE exposure at 1 g/kg body weight for 4 weeks. X-axis
(Time), Y-axis(Intensity, cps); Left - analytes, right - internal standard(Right); (a) DCA and (b) TCA in BALB/c
mice, (c) NAcDCVC, (d) DCVC and (e) DCVG in DBA/2 mice. DCVC and DCVG were not detected in the
present sample.
을 형성한다. 따라서 NH4OH를 이용한 염기성 전처 리로 NAcDCVC를 다른 GSH-중합체와 동시 분리- 정량을 할 수 없었다. DCVC와 DCVG는 이전과 동 일하게 고상추출 후 positive ion 모드로 분석했는데, inter-와 intra-day variation이 모두 4.2~19.1%의 변 이를 보인 것은 이전과 유사한 수준이며 이는 batch effect나 date effect라기 보다 random residual로서 측정오차로 보인다.
본고의 측정법을 이용하여 GSH-중합체분석을 할 때 반드시 HAA를 먼저 수행할 필요는 없다. 마우 스 혈액이나 소변처럼 시료량이 매우 제한적인 경우 액액추출과 SPE를 병합해 사용하지만, 인체 시료처 럼 비교적 시료량이 충분한 경우 GSH-중합체만 따 로 측정하려면 HAA 추출과정없이 바로 SPE를 수 행하더라도 감도변화가 없음을 확인하였다(data not- shown). 또한 결과로써 보이지 않았지만 이온화를 향상시키기 위한 첨가제(additive)의 종류와 함량도 달리하여 실험하였지만 현재의 방법보다 특별히 개 선된 점을 찾지 못하였다. 다만, GSH-중합체의 경 우 고농도 stock solution을 -80oC에서 보관하더라도 액상에서 6개월 이상 안정적이지 못함을 확인하였다.
표준물질의 고농도 용액을 희석하여 만든 크로마토 그램을 보면 피크의 모양이 깨지거나 피크면적(AUC) 이 작아짐을 관찰하였다.
개량된 본 측정법의 또 다른 특징은 측정의 안정 성과 완건성(robustness)이라고 할 수 있다. 이전과 다른 분석 장비체계에서도 감도를 잃지 않고 배치간 변이는 크게 줄일 수 있었다. 이전 측정법13)은 trifluoroacetic acid(TFA)와 difluoroacetic acid(DFA) 를 HAA의 내부표준물질로 이용하여 측정하였고 검 출 감도를 높이기 위해 2-MEE를 이동상에 섞어 주 입하여 사용하였다. 2-MEE는 HAA의 이온화를 효 과적으로 향상시켜 질량분석기의 검출감도를 증가시 키는데, 질량분석기 유입직전 이동상과 분석물질이 이온화될 때 표면장력이 작은 2-MEE로 인해 수분 함유가 작은 용매입자가 형성되고 주변 물입자가 증 발된 후까지 용매입자가 분석물질을 머금을 수 있기 에 수분에 의한 간섭을 극소화시키는 특성이 있다.20) 2-MEE 사용으로 감도를 비약적으로 향상시킬 수 있 었지만 양날의 검처럼 단점도 감수해야 했다. 미세 한 2-MEE의 함량 변화에도 분석물질과 내부표준물 질이 서로 다른 이온화 결과를 초래하기에 이동상
용액을 담은 bottle을 LC시스템에서 교체할 때마다 검량선을 다시 그려야하는 불편함이 있었고 정량의 재현성과 완건성(robustness)에 장애가 되었다. 또한 DFA와 TFA가 analyte의 방사선동위원소가 아니기에 retention time(RT)을 구분하기 위해 과량 투여해야 했 는데, TFA는 mass spectrometry에서 ion suppression 을 유발할 수 있고,21) 2-MEE도 크로마토그램의baseline 을 높이지만 TFA 또한 ACN과 물로 이뤄진 이동상 에서 추가적으로 baseline을 높이는 효과가 있었다. 본 연구에서는 이를 13C으로 표지된 방사성동위원소를 내부표준물질로 사용하여 이런 문제점을 최소화하였 다. 결과적으로 뱃치간(between batch)의 변이를 17.8~14.1%(DCA)와 3.8~17.9%(TCA)로 이전의 20%
를 상회하던 값을13)크게 줄일 수 있었다(Table 6).
새롭게 개량된 측정법의 적용성을 살피기 위해 살 아있는 마우스에 TCE를 경구투여한 뒤 생체시료를 확보하여 분석하였다. 여러 품종의 마우스를 사용하 였기에 이에 대한 고찰도 흥미 있겠지만, 이를 위해 서는 약동력학적인 실험연구를 수행해야 한다. 다시 말해 투여직후 모든 시간 별 time profile을 조사하 고 매시간 TCE투여군의 반복 개체 마우스에 대한 측정과 PK 분석을 해야한다. 이는 TCE 측정법 개 선이라는 본고의 범위를 넘는 것이기에 본고에서는 마우스 소변에서도 실제 검출가능지 살피는데 초점 을 맞추었다. 정량분석한 크로마토그램 일부를 Fig.
3에 나타내었는데 이전 방법13)과 비교하여 특히 HAA 의 baseline이 현격히 안정되고 분석물질 전후에서 관찰되는 confounding peak가 제거되었음을 확인할 수 있다. Table 7에는 본 연구에서 사용된 마우스에 4주간 1000 mg/kg으로 경구투여후 소변에서 TCE의 여러 대사체의 농도분포를 나타내주고 있다.
본 연구에서 투여직후 대사체를 선택하기 보다 최 종 반복투여 후 24시간을 선택한 것은 본 연구의 개 선된 측정법이 보다 낮은 농도범위의 생체농도와 여 러 물질에 효과적으로 적용가능한지 살피기 위함이 었다. 우리는 사전 연구에서 TCE가 투여 12시간내 에 대부분의 대사가 완료16)되는 것을 확인했고, 투 여 24시간 이후는 대부분의 대사체가 배출(disposition) 되거나 재순환(e.g. enterohepatic recirculation)22)또 는 축적이 일어 날 수 있다. 투여 2시간 후 TCE 대 사체 정량은 개량전 방법으로 이미 성공적인 검출을 하였기에 이번에는 24시간후 대사체 잔류량을 알아
보고자 하였고, 이것이 개량된 측정법 테스트에도 적 절하겠다는 판단을 하였다. 이에 우리는 예비실험을 (논문 준비중) 통해 서로 다른 kinetic 특성을 보이 는 마우스 종을 확보하고, 이들에게 TCE를 투여하 고 24시간 후 대사체의 농도 비교를 수행하였다.
예상대로 혈액에서는 거의 검출되지 않았지만(data not shown), 소변에서는 투여 24시간이 지난 시점에 도 HAA는 모든 개체에서 LOD이상 수준에서 검출 되었다. GSH-중합체의 경우는 24시간이 지나면 DCVG는 모든 개체에서 검출되지 않았지만 일부에 게 DCVC는 검출되었고(n=3), NAcDCVC는 비교 중 체내에 검출된 개체가 상대적으로 많았다(n=8).
검출된 농도도 NAcDCVC의 잔류량이 가장 많았 고, DCVC가 그 다음이었고, DCVG는 모두 검출한 계 이하였다. 겉보기에는 GSH-중합체의 대사가 DCVG→ DCVC → NAcDCVC 순서로 이루어지기 에 이를 따르는 것 같지만, DCVC의 농도는 BALC/c 에서만 0.005(<LOD~0.011; n=4) nmol/mL [중위수 (interquartile range] 검출되었고, NAcDCVC 는 주 로 DBA/2와 BALB/c에서 각각 0.468(0.407~0.560;
n = 5) nmol/mL, 0.006(< LOD ~ 0.011; n = 4)로 검출 되었다. B6C3F1에서도 LOD에 가깝게 검출된 개체 가 일부 있었지만 NAcDCVC는 종별로 체류 속도 가 크게 차이났다. 한편 TCA와 DCA의 경우 거의 모든 개체가 검출한계 이상이었지만 TCA의 경우 DBA/2와 BALB/c의 체류농도가 각각 474.8(472.2
~ 488.5) nmol/mL과 131.4(91.7~190.6) nmol/mL로 높았고, DCA의 경우 DBA/2만 0.264(0.224~0.481) nmol/mL로써 나머지 strain에 비해 유의하게 높았다.
[0.130(0.120~0.137) nmol/mL; n =18]. 종별 차이의 원인을 밝혀내거나 pharmacokinetics의 특성을 논하 는 것은 본고의 범위를 넘지만, 투여 24시간 후에도 대사체를 검출할 수 있었고, DBA/2와 BALB/c의 체 류시간이 상대적으로 길다는 점을 확인할 수 있었다.
V. 결 론
본 연구는 혈액 또는 소변 등 소량(50 μL)의 생체 시료에 존재하는 TCE 대사산물 다섯가지를 동시에 측정하는 법을 제시하고 있다. 본 연구에서는 표적 물질(target analyte)과 동일한 화학적 특성을 공유한,
13C 으로 표지된 내부표준물질을 사용함으로써 전처
리 과정에서 동일한 추출 효율을 거둘 수 있었고 mass spectrometer의 이온화과정에서 유사한 matrix effect를 받을 수 있었으며 between-batch 및 within- batch의 변이를 줄이고 보다 안정적인 측정을 수행 할 수 있게 되었다. 또한, TCE 독성평가에 중요한 NAcDCVC를 새로이 추가하여 보완하였다. Intra- day, Inter-day 정밀도는 분석물질마다 차이가 있으 나 모두 2.7~19.1%이며, 일내, 일간 정확도는 81.2~
105.4%으로 안정적인 분석법임을 확인하였다. 검출 한계는 타 측정법과 유사하거나 낮아 저농도 노출 개체나 pharmacokinetic 연구의 시료도 적용될 수 있 게 하였다. 실제로 TCE를 경구투여(1 g/kg)하고 24 시간 뒤 다섯 종 22마리의 마우스 소변에서 측정한 결과, TCA와 DCA는 모든 개체에서 검출할 수 있 었고, DCVG는 검출할 수 없었지만 DCVC와 NAcDCVC는 종마다 검출수준을 달랐다. 본 연구에 서 제시하는 분석법은 미량의 생체시료를 사용하여 TCE의 독성평가에 중요한 대사체를 안정적으로 동 시에 추출할 수 있었다. 이 방법을 활용하면 추후 다른 신체조직이나 장기의 TCE 대사체를 측정할 수 있기에, TCE에 대한 독성학 연구 및 위해성 평가에 큰 도움을 줄 수 있을 것으로 기대한다.
감사의 글
이 논문은 2009년도 정부(미래창조과학부)의 재원 으로 한국연구재단의 지원을 받아 수행된 이공분야 기초연구사업임(No. 2009-0076883, 2010-0006741).
References