∙ Received: September 13, 2012. Accepted: September 27, 2012.
∙ Corresponding author : Jung Jin Lim
Department of Nuclear Medicine, SNM-SNUH Boramae Medical Center 39 Boramae-gil, Dongjak-gu, Seoul, 156-707, Korea
Tel: +82-2-870-2596, Fax: +82-2-870-2587 E-mail: [email protected]
Original Article
PET/CT에서 재구성 프로그램의 성능 평가서울특별시 보라매병원 핵의학과
1, 건국대학교병원 핵의학과
2, 국립암센터 핵의학과
3,
서울대학교병원 핵의학과
4임정진1 ‧ 윤석환1 ‧ 김종필1 ‧ 남궁식2 ‧ 신성화2 ‧ 윤상혁3 ‧ 김영석3 ‧ 이형진4 ‧ 이홍재4 ‧ 김진의4 ‧ 우재룡1
Evaluation of Image Quality Based on Time of Flight in PET/CT
Jung Jin Lim1, Seok Hwan Yoon1, Jong Pil Kim1, Sik Nam Koong2, Seong Hwa Shin2,
Sang Hyeok Yoon3, Yeong Seok Kim3, Hyeong Jin Lee4, Hong Jae Lee4, Jin Eui Kim4, Jae Ryong Woo1
1
Department of Nuclear Medicine, SMG-Seoul National Univ. Hospital, Seoul, Korea
12
Department of Nuclear Medicine, Kon Kuk Univ. Hospital, Seoul, Korea
3
Department of Nuclear Medicine, National Cancer Center, Goyang, Korea
4
Department of Nuclear Medicine, Seoul National Univ. Hospital, Seoul, Korea
Purpose : PET/CT is widely used for early checking up of cancer and following up of pre and post operation.
Image reconstruction method is advanced with mechanical function. We want to evaluate image quality of each reconstruction program based on time of flight (TOF). Materials and Methods : After acquiring phantom images during 2 minutes with Gemini TF (Philips, USA), Biograph mCT (Siemens, USA) and Discovery 690 (GE, USA), we reconstructed image applied to Astonish TF (Philips, USA), ultraHD · PET (Siemens, USA), Sharp IR (GE, USA) and not applied. inside of Flangeless Esser PET phantom (Data Spectrum corp., USA) was filled with
18F-FDG 1.11 kBq/ml (30 μCi/ml) and 4 hot inserts (8. 12. 16. 25 mm) were filled with 8.88 kBq/ml (240 μCi/ml) the ratio of background activity and hot inserts activity was 1 : 8. Inside of triple line phantom (Data Spectrum corp., USA) was filled with
18F-FDG 37 MBq/ml (1 mCi). Three of lines were filled with 0.37 MBq (100 μCi). Contrast ratio and background variability were acquired from reconstruction image used Flangeless Esser PET phantom and resolution was acquired from reconstruction image used triple line phantom. Results : The contrast ratio of image which was not applied to Astonish TF was 8.69, 12.28, 19.31, 25.80% in phantom lid of which size was 8, 12, 16, 25 mm and it which was applied to Astonish TF was 6.24, 13.24, 19.55, 27.60%.
It which was not applied to ultraHD · PET was 4.94, 12.68, 22.09, 30.14%, it which was applied to ultraHD · PET was 4.76, 13.23, 23.72, 31.65%. It which was not applied to SharpIR was 13.18, 17.44, 28.76, 34.67%, it which was applied to SharpIR was 13.15, 18.32, 30.33, 35.73%. The background variability of image which was not applied to Astonish TF was 5.51, 5.42, 7.13, 6.28%. it which was applied to Astonish TF was 7.81, 7.94, 6.40 6.28%. It which was not applied to ultraHD · PET was 6.46, 6.63, 5.33, 5.21%, it which was applied to ultraHD
· PET was 6.08, 6.08, 4.45, 4.58%. It which was not applied to SharpIR was 5.93, 4.82, 4.45, 5.09%, it which was applied to SharpIR was 4.80, 3.92, 3.63, 4.50%. The resolution of phantom line of which location was upper, center, right, which was not applied to Astonish TF was 10.77, 11.54, 9.34 mm it which was applied to Astonish TF was 9.54, 8.90, 8.88 mm. It which was not applied to ultraHD · PET was 7.84, 6.95, 8.32 mm, it which was applied to ultraHD · PET was 7.51, 6.66, 8.27 mm. It which was not applied to SharpIR was 9.35, 8.69, 8.99, it which was applied to SharpIR was 9.88, 9.18, 9.00 mm. Conclusion : Image quality was advanced generally while reconstruction program which is based on time of flight was used. Futhermore difference of result compared each manufacture reconstruction program showed up, however this is caused by specification of instrument of each manufacture and difference of reconstruction algorithm. Therefore we need further examination to find out appropriate reconstruction condition while using reconstruction program used for advance of image quality. (Korean J Nucl Med Technol 2012;16(2):110-114)
Key Words : Time of Flight(TOF), Contrast ratio, Background variability, Resolution
서 론
PET(Positron Emission Tomography)는 세포의 조직, 기능
A B C
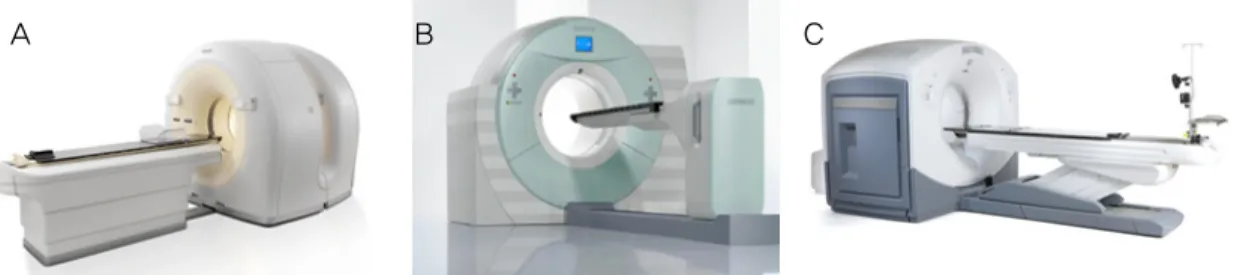
Fig. 1. There are PET/CT scanners. (A) Gemini TF 64, (B) Biograph mCT, (C) Discovery 690.
Fig. 2. This is Flangeless Esser PET phantom.
Fig. 3. This is NEMA Triple line Source Phantom.
적인 상태를 보여주고 암의 조기발견 및 재발여부를 판단하 는데 중요할 뿐만 아니라 CT와 같이 fusion함으로써 병소의 정확한 위치를 파악할 수 있어서, 수술 및 향후 치료 방향을 결정하는 중요한 검사이다. PET/CT의 보급과 더불어 영상 의 질을 향상시키기 위하여 장비의 하드웨어의 발전을 하고 있다. 최근에는 Time of Flight (TOF)를 기반으로 signal to noise와 resolution을 향상시키기 위한 여러 가지 재구성 프 로그램이 각 장비별로 개발되었다.
본 논문에서는 각 제조사 별로 TOF를 기반으로 성능을 향상시키기 위한 재구성 프로그램이 TOF만을 이용하여 재 구성 했을 때와 비교하여 어느 정도 차이가 나는지, 또 각각 제조사별로는 어느 정도 차이를 보이는지를 contrast ratio, background variability와 resolution을 측정하여 성능을 평가 하고자 한다.
재료 및 방법
1. 실험 장비
재구성 프로그램평가에 사용된 장비는 Gemini TF 64 (Philips, USA), Biograph mCT (Siemens, USA), Discovery 690 (GE, USA)를 이용하였다(Fig. 1).
Phantom은 Flangeless Esser PET phantom (Data Spectrum corp., USA)을 이용하여 contrast ratio와 background varia- bility를 구하였고, triple line phantom (Data Spectrum corp., USA)을 이용하여 resolution을 측정하였다(Fig. 2, 3).
2. Phantom 제작
Flangeless Esser PET phantom의 background에 6,440 ml 의 증류수를 채우고 ml 당 1.11 kBq (30 μCi/ml)의 18F-FDG를 균일하게 희석하였다. 8, 12, 16, 15 mm의 네 개의 원통(hot cylinder)에 ml 당 8.88 kBq (240 μCi/ml)의 18F-FDG를 균일하 게 희석하여 배후방사능과 열소 원통의 비율(backgroud/hot
ratio, B/H ratio)이 1:8이 되도록 만들었다. Triple line phan- tom의 background에 6,600 ml의 증류수와 37 MBq (1 mCi) 의 18F-FDG를 균일하게 희석하여 채우고 세 개의 line에 3.7 MBq (100 μCi)를 채웠다.
3. 영상획득 및 재구성
모든 실험을 동일한 조건으로 시행하기 위하여 phantom 에 방사능 주입 후 20분에 영상을 획득하였다. CT를 이용한 투과 찰영 후 wholebody mode로 2 min간 2 bed 로 PET 영 상을 획득하였다. 각 장비별로 모든 촬영 조건은 가능한 동 일하게 진행하였다. 재구성 프로그램은 Philips사에서 제공 하는 Astonish TF, Siemens사에서 제공하는 ultraHD•PET, GE사에서 제공하는 SharpIR의 재구성 프로그램을 이용하였 다. 또한 사용 전후를 비교하기 위하여 TOF만을 이용하여 재구성을 하고 각 제조사에서 제공하는 재구성 프로그램과 TOF를 함께 사용하여 재구성을 각각 시행하였다.
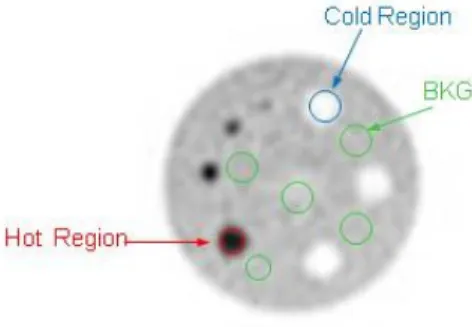
Fig. 4. The 25 ROIs were drawn in the background and 5 ROIs
were drawn for each hot sphere.percent contrast for each hot sphere j
standard deviation of the background ROI counts in j
percent background variability for sphere j
Fig. 5. These formulars were used for analysis of percent
contrast and percent background variability.Fig. 6. The diagram is measure of FWHM.
Table 1. Result of percent contrast ratio
8 mm 12 mm 16 mm 25 mm
Non - Astonish TF 8.69 12.28 19.31 25.80
Astonish TF 6.24 13.24 19.55 27.60
Non - ultraHD ․ PET 4.94 12.68 22.09 30.14
ultraHD ․ PET 4.79 13.23 23.72 31.65
Non - SharpIR 13.18 17.44 28.76 34.67
SharpIR 13.15 18.32 30.33 35.73
Fig. 7. Result of experiments were transformed graph.
4. 영상분석
Percent contrast와 percent background variability를 구하 기 위하여 재구성 된 영상에서 hot sphere와 background에 대한 ROI (Region of Interest)를 그려서 분석하였다.
Flangeless Esser PET phantom에 hot sphere 4개의 ROI를 그 리고 sphere의 동일한 크기를 ROI를 5개 slice에 총 25개의 ROI를 그려 아래의 공식을 사용하여 percent contrast와 per- cent background variability를 구하였다(Fig. 4, 5).
Resolution을 구하기 위하여 X, Y축의 프로파일을 이용하
여 FWHM을 구하였다.
결 과
1. Contrast ratio
Phantom lid 크기가 8, 12, 16, 25 mm에서의 contrast ratio 는 Astonish TF를 적용하지 않은 영상에서 8.69, 12.28, 19.31, 25.80%, 적용한 영상에서는 6.24, 13.24, 19.55, 27.60%, ultraHD ․ PET를 적용하지 않은 영상에서 4.94, 12.68, 22.09, 30.14%, 적용한 영상에서는 4.76, 13.23, 23.72, 31.65%, SharpIR를 적용하지 않은 영상에서 13.18, 17.44, 28.76, 34.67%, 적용한 영상에서는 13.15, 18.32, 30.33, 35.73%로 나 타났다(Table 1).
Background variability는 Astonish TF를 적용하지 않은 영 상에서 5.51, 5.42, 7.13, 6.28%, 적용한 영상에서는 7.81, 7.94, 6.40, 6.28%, ultraHD ․ PET를 적용하지 않은 영상에서 6.46, 6.63, 5.33, 5.21%, 적용한 영상에서는 6.08, 6.08, 4.45, 4.58%, SharpIR를 적용하지 않은 영상에서 5.93, 4.82, 4.45, 5.09%, 적 용한 영상에서는 4.80, 3.92, 3.63, 4.50%로 나타났다(Table 2).
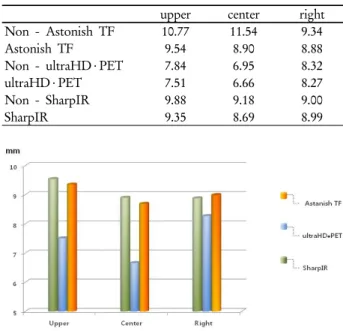
Resolution는 phantom line 위치가 upper, center, right에 서 Astonish TF를 적용하지 않은 영상에서 10.77, 11.54, 9.34 mm, 적용한 영상에서는 9.54, 8.90, 8.88 mm, ultraHD ․PET 를 적용하지 않은 영상에서 7.84, 6.95, 8.32 mm, 적용한 영상 에서는 7.51, 6.66, 8.27 mm, SharpIR를 적용하지 않은 영상
Table 2. Result of percent background variability
8 mm 12 mm 16 mm 25 mm
Non - Astonish TF 5.51 5.42 7.13 6.28
Astonish TF 7.81 7.94 6.40 6.28
Non - ultraHD ․ PET 6.46 6.63 5.33 5.21
ultraHD ․ PET 6.08 6.08 4.45 4.58
Non - SharpIR 5.93 4.82 4.45 5.09
SharpIR 4.80 3.92 3.63 4.50
Fig. 8. Result of experiments were transformed graph.
Table 3. Result of resolution
upper center right
Non - Astonish TF 10.77 11.54 9.34
Astonish TF 9.54 8.90 8.88
Non - ultraHD ․ PET 7.84 6.95 8.32
ultraHD ․ PET 7.51 6.66 8.27
Non - SharpIR 9.88 9.18 9.00
SharpIR 9.35 8.69 8.99
Fig. 9. Result of experiments were transformed graph.
에서 9.35, 8.69, 8.99 mm, 적용한 영상에서는 9.88, 9.18, 9.00 mm로 나타났다(Table 3).
결론 및 고찰
최근 PET/CT검사는 장비의 발전과 더불어 재구성 프로그 램의 개발로 인해 더 좋은 영상을 구현하고 있다. 특히 TOF 를 이용하여 좀 더 정확한 정보를 얻을 뿐만 아니라 SOR (segments of response) 기법으로 병소의 정확한 위치를 파악 할 수 있게 되었다. 본 연구에서 TOF기반으로 개발된 재구 성 프로그램을 TOF와 함께 사용하게 되면 TOF만을 사용했 을 때보다 전반적으로 영상의 질적 향상이 이루어짐을 알 수 있었다. 또한 제조사별 재구성 프로그램 비교에 대해서는 어 느 정도의 결과 값의 차이를 보였지만 이는 제조사별 장비의 특성과 재구성 알고리즘의 차이로 인한 결과라고 생각된다.
따라서 각 병원에서는 영상의 질을 향상시키기 위해 사용되 는 재구성 프로그램을 이용함에 있어서 프로그램에 맞는 적 절한 재구성 조건을 찾기 위한 추가적인 연구가 필요할 것으 로 사료된다.
요 약
암의 조기검진 및 수술 전후 추적검사에 유용하게 이용되 고 있는 PET/CT는 영상의 질을 향상시키기 위하여 기계적
인 성능 향상과 더불어 영상 재구성방법도 발전되어 왔다.
본 연구는 Time of Flight (TOF)를 기반으로 한 재구성 프로 그램들에 대하여 영상의 질을 평가하고자 한다. Gemini TF, Biograph mCT, Discovery 690을 이용하여 phantom 영상을 동일한 조건으로 2분 동안 영상을 획득 후 Astonish TF, ultraHD•PET, SharpIR을 적용한 것과 적용하지 않은 것에 대하여 영상을 재구성하였다. Flangeless Esser PET phantom 의 내부에는 18F-FDG 1.11 kBq/ml (30 μCi/ml)를 채우고 4 개의 열소 원통(8, 12, 16, 25 mm)에는 8.88 kBq/ml (240 μ Ci/ml)를 채워서 배후 방사능과 열소 원통 방사능의 비율이 1:8이 되도록 제작하였고 triple line phantom의 내부에는
18F-FDG 37 MBq (1 mCi)를 채우고 세 개의 line에는 0.37 MBq/ml (100 uCi)를 주입하여 제작하였다. Flangeless Esser PET phantom을 사용한 재구성 영상에서 contrast ratio와 background variability를 구하였고, triple line phantom을 사 용한 재구성 영상에서 resolution을 측정하였다. Phantom lid 크기가 8, 12, 16, 25 mm에서의 contrast ratio는 Astonish TF 를 적용하지 않은 영상에서 8.69, 12.28, 19.31, 25.80%, 적용 한 영상에서는 6.24, 13.24, 19.55, 27.60%, ultraHD•PET를 적용하지 않은 영상에서 4.94, 12.68, 22.09, 30.14%, 적용한 영상에서는 4.76, 13.23, 23.72, 31.65%, SharpIR를 적용하지 않은 영상에서 13.18, 17.44, 28.76, 34.67%, 적용한 영상에서 는 13.15, 18.32, 30.33, 35.73%로 나타났다. Background vari- ability는 Astonish TF를 적용하지 않은 영상에서 5.51, 5.42, 7.13, 6.28%, 적용한 영상에서는 7.81, 7.94, 6.40, 6.28%,
ultraHD•PET를 적용하지 않은 영상에서 6.46, 6.63, 5.33, 5.21%, 적용한 영상에서는 6.08, 6.08, 4.45, 4.58%, SharpIR 를 적용하지 않은 영상에서 5.93, 4.82, 4.45, 5.09%, 적용한 영상에서는 4.80, 3.92, 3.63, 4.50%로 나타났다. Phantom line 위치가 upper, center, right에서의 resolution은 Astonish TF 를 적용하지 않은 영상에서 10.77, 11.54, 9.34 mm, 적용한 영 상에서는 9.54, 8.90, 8.88 mm, ultraHD•PET를 적용하지 않 은 영상에서 7.84, 6.95, 8.32 mm, 적용한 영상에서는 7.51, 6.66, 8.27 mm, SharpIR를 적용하지 않은 영상에서 9.35, 8.69, 8.99 mm, 적용한 영상에서는 9.88, 9.18, 9.00 mm로 나타났 다. TOF를 기반으로 하여 영상의 질을 향상시키기 위한 재 구성 프로그램 사용 시 전반적으로 영상의 질적 향상이 이루 어짐을 알 수 있었다. 또한 제조사별 재구성 프로그램 비교 에 대해서는 어느 정도의 결과 값의 차이를 보였지만 이는 제조사별 장비의 특성과 재구성 알고리즘의 차이로 인한 결 과라고 생각된다. 따라서 각 병원에서는 영상의 질을 향상시
키기 위해 사용되는 재구성 프로그램을 이용함에 있어서 프 로그램에 맞는 적절한 재구성 조건을 찾기 위한 추가적인 연 구가 필요할 것으로 사료된다.
REFERENCES
1. Steve Ross, Charles Stearns, “SharpIR White Parer”
2. R. Manjeshwar, S. Ross, M. Iatrou, T. Deller, and C. Stearns,
“Fully 3D PET iterative reconstruction using distance-driven projectors and native scanner geometry,” IEEE Nuclear Science Symposium Conference Record, 2006:2804-2807.
3. Amy E. Perkins, “Astonish TF : Technical overview of Philips Time-of-Flight PET designand its clinical benefits”
4. Bernard F, Turcotte E, Scheuermann J, Saffer J, Karp J, and Divgi C. Respiratory synchronization to improve the detection of small pulmonary nodules on PET/CT. Journal of Nuclear Medicine. 2007, Abstract Book Supplement 48:123.
5. 고창순, 핵의학. 제3판. 고려의학; 2008;167-192.