https://doi.org/10.5624/isd.2019.49.2.139
Introduction
Cone-beam computed tomography(CBCT) has become an indispensable imaging technology in dental practice.
CBCT imaging provides a higher spatial resolution and a lower exposure dose than multi-detector computed to- mography(MDCT) imaging.1 Furthermore, CBCT images provide better image quality than conventional radiographs and complement their limitations. However, the radiation doses from CBCT examinations are generally higher than
those from conventional radiographs.2-4 Depending on the CBCT scanner and imaging settings selected, the effective dose of a CBCT examination can be from 4 to 78 times higher than that of a panoramic radiograph.5,6 Therefore, in order to protect patients from radiation, the optimization of CBCT is essential.7
Differences exist in the required radiation dose and im- age quality for various diagnostic tasks, such as periapical diagnosis, detection of sinus pathology, and implant plan- ning. Exposure parameters, such as tube voltage, tube cur- rent, exposure time, rotation arc, and field of view(FOV) size, affect the radiation dose and the image quality.1 Re- cent advances in CBCT technology have led to the proposal of several dose reduction strategies, such as decreasing the FOV size and tube current-exposure time product(mAs).4,8
Optimization of exposure parameters and relationship between subjective and technical image quality in cone-beam computed tomography
Ha-Na Park 1, Chang-Ki Min 1, Kyoung-A Kim 1, Kwang-Joon Koh 1,*
1Department of Oral and Maxillofacial Radiology, School of Dentistry, Chonbuk National University, Jeonju, Korea
AbstrAct
Purpose: This study was performed to investigate the effect of exposure parameters on image quality obtained using a cone-beam computed tomography(CBCT) scanner and the relationship between physical factors and clinical image quality depending on the diagnostic task.
Materials and Methods: CBCT images of a SedentexCT IQ phantom and a real skull phantom were obtained under different combinations of tube voltage and tube current(Alphard 3030 CBCT scanner, 78-90kVp and 2-8 mA). The images obtained using a SedentexCT IQ phantom were analyzed technically, and the physical factors of image noise, contrast resolution, spatial resolution, and metal artifacts were measured. The images obtained using a real skull phantom were evaluated for each diagnostic task by 6 oral and maxillofacial radiologists, and each setting was classified as acceptable or unacceptable based on those evaluations. A statistical analysis of the relationships of exposure parameters and physical factors with observer scores was conducted.
results: For periapical diagnosis and implant planning, the tube current of the acceptable images was significantly higher than that of the unacceptable images. Image noise, the contrast-to-noise ratio(CNR), the line pair chart on the Z axis, and modulation transfer function(MTF) values showed statistically significant differences between the acceptable and unacceptable image groups. The cut-off values obtained using receiver operating characteristic curves for CNR and MTF 10 were useful for determining acceptability.
conclusion: Tube current had a major influence on clinical image quality. CNR and MTF 10 were useful physical factors that showed significantly associations with clinical image quality.(Imaging Sci Dent 2019; 49: 139-51) Key wOrds: Optimization; Image Quality; Cone-Beam Computed Tomography
Copyright ⓒ 2019 by Korean Academy of Oral and Maxillofacial Radiology
This is an Open Access article distributed under the terms of the Creative Commons Attribution Non-Commercial License(http://creativecommons.org/licenses/by-nc/3.0) which permits unrestricted non-commercial use, distribution, and reproduction in any medium, provided the original work is properly cited.
Imaging Science in Dentistry·pISSN 2233-7822 eISSN 2233-7830 Received January 30, 2019; Revised April 10, 2019; Accepted April 16, 2019
*Correspondence to : Prof. Kwang-Joon Koh
Department of Oral and Maxillofacial Radiology, School of Dentistry, Chonbuk National University, 567 Baekje-daero, Deokjin-gu, Jeonju-si, Jeollabuk-do 54896, Korea Tel) 82-63-250-2023, E-mail) [email protected]
However, decreasing the radiation dose may entail degrad- ing the image quality. Therefore, it is important to perform examinations using doses that are as low as diagnostically acceptable(ALADA), without loss of adequate image qual- ity. Furthermore, CBCT machines used for dental imaging have a variety of radiation doses and image qualities, and findings concerning optimization are often limited to the studied type of scanners.9-12 For the optimization of these diverse machines, Al-Okshi et al.4 emphasized that a stan- dardized method to evaluate image quality is essential.
The clinical evaluation is usually used as the gold stan- dard for assessing image quality according to the diagnos- tic task. Many studies have used skulls or patient data to evaluate 1 or more aspects of CBCT image quality.9,13-15 Although these studies are clinically relevant, it is difficult to standardize the results of studies that use skulls or pa- tient data.13 For these reasons, a quality control phantom for CBCT was recently developed as part of the Sedent- exCT project.16 Additionally, some studies have used geo- metric phantoms.1,4,10 Although those methods are useful for device comparison and quality control, there is no direct way of translating these results to clinical image quality.
Therefore, it is essential to study the relationship between the clinical evaluation and physical factors for the develop- ment of a standardized method.7
The physical factors of contrast resolution, spatial resolu- tion, and image noise are related to the clinical image qual- ity in MDCT.7,17 Contrast resolution refers to the ability to detect very subtle changes in gray scale and distinguish them from the noise in the image.18 Spatial resolution re- fers to the capability of an imaging system to resolve fine details of the object being studied.19 Image noise is random variation of brightness that broadly interferes with the abil- ity to detect a signal in images. Additionally, metal artifacts can affect the image quality of CBCT. If metal is present in the FOV, CBCT imaging is inherently vulnerable to the beam hardening phenomenon. This artifact may degrade the clinical image quality and reduce the diagnostic accura- cy.20
The aim of this study was to investigate the effect of exposure parameters on image quality obtained using a CBCT scanner and the relationship between physical fac- tors and the clinical evaluation depending on the diagnos- tic task.
Materials and Methods
All CBCT images were obtained using an Alphard 3030 CBCT scanner(Asahi Roentgen Industrial Corporation,
Kyoto, Japan). The scanner has an amorphous silicon flat panel detector. A voxel size of 0.39mm×0.39mm×0.39 mm was used. An X-ray beam was rotated 360° around the phantom, and the exposure time was 17 seconds. A to- tal filtration of 2.8mm aluminum was used.
A FOV of 200mm×179mm was used to obtain the whole image of the SedentexCT IQ phantom(SedentexCT IQ, Leeds Test Objects Ltd., North Yorkshire, UK). To obtain images with different image qualities, 28 combina- tions of 4 different tube voltages and 7 different tube cur- rents were used for a SedentexCT IQ phantom and a real skull phantom(78, 80, 85, and 90kVp; and 2, 3, 4, 5, 6, 7, and 8mA). Images obtained using the CBCT machine were saved in the Digital Imaging and Communications in Medicine(DICOM) format.
Physical measurement of the image quality
To measure the physical image quality, CBCT images of a SedentexCT IQ phantom were obtained under 28 expo- sure combinations. This phantom is a head-sized cylindri- cal polymethyl methacrylate(PMMA) phantom(diameter:
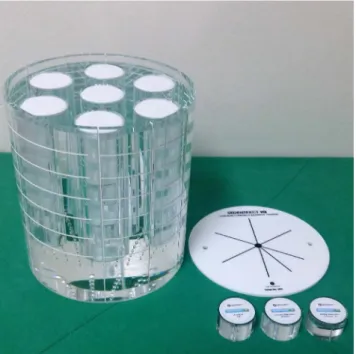
160mm; height: 162mm). The base part(height: 22mm) of the phantom is made of uniform PMMA. The upper part of the phantom contains 6 layers of 7 cylindrical inserts (diameter: 35mm; height: 140mm) positioned at the center and periphery arranged in a regular hexagon(Fig. 1). With the upper part and the base part, a total of 5 image quality parameters were tested. A list of the image quality parame-
Fig. 1. A head-sized cylindrical polymethyl methacrylate phantom.
ters that were measured using the phantom is presented in Table 1.
All images were scanned 3 times, and under each ex- posure condition, a total of 227 slices of the axial images were analyzed using Radia diagnostic software version 1.10 (Radiological Imaging Technology Inc., Colorado Springs, USA). All images were analyzed, and all measured values
were statistically processed.
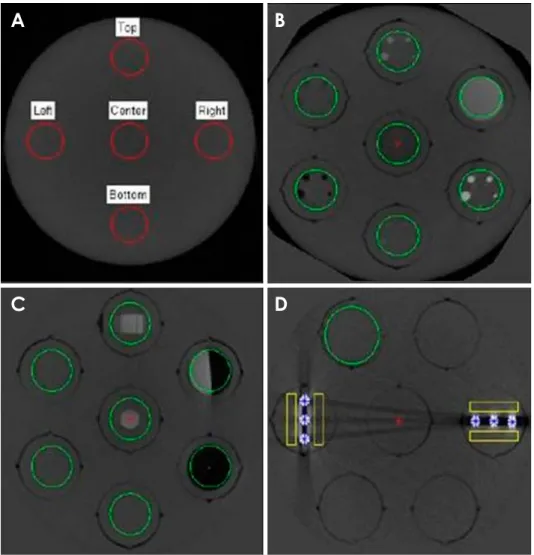
Image noise was measured on the obtained images by scanning the base part of the phantom. On the axial slice images, 5 circular regions of interest(ROIs) were placed at the center and periphery(top, left, right, and bottom) of the FOV(Fig. 2A). Image noise was also calculated us- ing the differences in the standard deviations between the
Table 1. List of the parameters used for image analysis and inserts
Parameters Insert design Position
Image noise Uniform PMMA The base part
Spatial resolution
-line pair chart Alternating aluminum/polymer chart(1.0, 1.7, 2.0, 2.5, 2.8, 4.0, and 5.0lp/mm)
Both XY and Z directions Row 1
Spatial resolution
-line spread function and MTF Sharp edge of the PMMA/PTFE interface Row 1
Contrast resolution 1.0-, 2.0-, 3.0-, 4.0-, and 5.0-mm diameter rods(LDPE, PTFE, Delrin) suspended
in PMMA Row 2
Metal artifact A line of three 5.0-mm-diameter Ti rods suspended in PMMA Row 4
PMMA: polymethyl methacrylate, MTF: modulation transfer function, PTFE: polytetrafluoroethylene, LDPE: low-density polyethylene, Ti: titanium
Fig. 2. Cone-beam computed tomo- graphic axial images obtained using a SedentexCT IQ phantom show the regions of interest calculated by the Radia software. A. Image noise section. B. Contrast resolution sec- tion. C. Spatial resolution section. D.
Artifact section.
A B
C D
ROIs.
In the phantom, the contrast resolution layer has 5 in- serts. Each insert contains rods measuring 1.0mm, 2.0mm, 3.0mm, 4.0mm, and 5.0mm in diameter made of alumi- num, polytetrafluoroethylene(PTFE), Delrin, low-density polyethylene(LDPE), and air. The aluminum insert sim- ulates dentin, the PTFE insert simulates dense bone, the LDPE insert simulates soft tissues, and the air simulates air cavities(Fig. 2B). The contrast-to-noise ratio(CNR) and the number of detected PTFE, Delrin and LDPE rods were calculated by the Radia diagnostic software.
To measure the line pair(LP) chart, alternating alumi- num/polymer chart inserts(1.0, 1.7, 2.0, 2.5, 2.8, 4.0, and 5.0 line pairs per mm) were used(Fig. 2C). Two inserts of the spatial resolution layer were used to analyze the XY- plane and the Z-axis. A line spread function(LSF) insert is located on the sharp edge of the PMMA/PTFE inter- face(Fig. 2C). Modulation transfer function(MTF)-50 and MTF 10 values were obtained from the LSF using the Radia diagnostic software.
To measure the extent of metal artifacts, 2 types of in- serts were used. One contained 3 titanium rods aligned parallel to the phantom radius and the other contained 3 rods aligned perpendicular to it. The average voxel values of each of the 4 boxes located in the vicinity of the rods in the images were calculated. Then, the difference between the average voxel value of each box and the average voxel value of the background level was calculated by the Radia diagnostic software(Fig. 2D).
Subjective evaluation of image quality
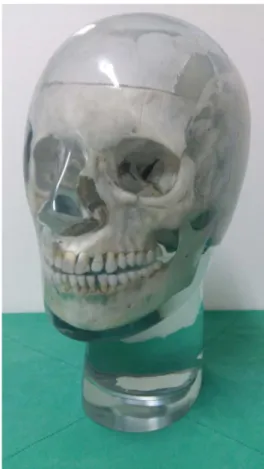
To evaluate the subjective image quality, CBCT imag- es of a real skull phantom with a soft-tissue replica(X-ray skull phantom, Erler Zimmer Co., Lauf, Germany) were obtained under the same combinations of tube voltage and current with a SedentexCT IQ phantom(Fig. 3). All im- ages were saved in DICOM format and underwent recon- struction into axial, coronal, and sagittal planes with a slice thickness of 1mm.
Six oral and maxillofacial radiologists observed all im- ages for the subjective evaluation, using 21-inch medi- cal display monitors(WIDE 3 mega CX30P, WIDE Co., Yongin, Korea) with a resolution of 2048×1536 pixels. All observers had a trial session before the evaluation, and the evaluation was carried out individually at random and in an irreversible order. The observers were not aware of the exposure conditions, but were allowed to adjust the bright- ness and the contrast settings. There were no limitations on the observation time.
Each observer first assessed the palatal root area of the right maxillary first molar and then evaluated the distal root area of the left mandibular second molar. In the maxil- lary tooth area, the assessment items were as follows: clear lamina dura and periodontal ligament space, clear inferior border of the maxillary sinus, clear buccal and palatal corti- cal plates, clear trabecular pattern, image quality sufficient for periapical diagnosis, and image quality sufficient for implant planning. In mandibular tooth area, the following items were evaluated: clear lamina dura and periodontal ligament space, clear border of the mandibular canal, clear border of the marginal bone crest, clear trabecular pattern, image quality sufficient for periapical diagnosis, and image quality sufficient for implant planning. The observers were instructed to assess each structure in the entire image, rath- er than to focus on a specific region. The purpose of the as- sessments related to the anatomical landmarks was to allow the observers to focus on structures related to the diagnos- tic tasks. In fact, the results were based on 2 diagnostic as- sessment points. For all assessments, the following 5-point rating scale was used: certainly agree(5), agree(4), neither agree nor disagree(3), disagree(2), certainly disagree(1).
The assessment was repeated 3 times with an interval of 2
Fig. 3. A real skull phantom with a soft-tissue replica.
weeks to calculate the intraobserver reliability. The interob- server reliability was also calculated.
The observers classified the image quality as acceptable or unacceptable, using the average observer score criteri- on(Fig. 4). Acceptable images were those with an average score of 3.5 or higher, which was the cut-off between the acceptable and unacceptable image quality groups.
Statistical analysis
The relationship between exposure parameters(tube volt- age, tube current), physical factors and observer scores was evaluated.
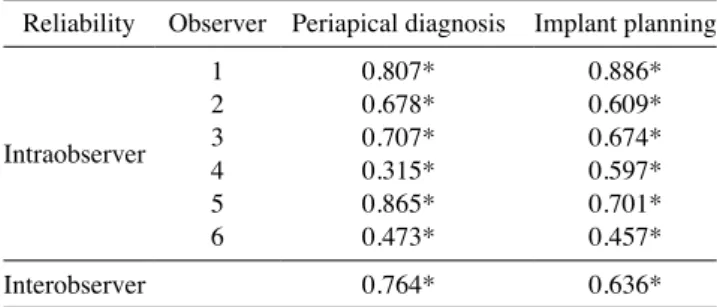
The intraobserver and interobserver reliability for the 6 observers was calculated using intraclass correlation coef- ficients(ICCs). The ICC values were interpreted accord- ing to Landis and Koch’s guidelines, as follows:21 ICC<
0.20=slight agreement, ICC 0.21-0.40=fair agreement, ICC 0.41-0.60=moderate agreement, ICC 0.61-0.80=sub- stantial agreement, and ICC 0.81-1.0=almost perfect agre- ement.
The Mann-Whitney U test was used to evaluate the dif- ferences in tube voltage and tube current between the ac- ceptable and unacceptable images. The independent t-test was used to evaluate the differences in the results of the image noise, CNR, rod visibility test, LP chart, MTF, and metal artifact tests between the acceptable and unaccept-
able image quality groups. For physical factors with signif- icant differences, a receiver operating characteristic(ROC) curve was used to determine the cut-off values.
All statistical analyses were performed using IBM SPSS Statistics version 25.0(IBM Corp., New York, NY, USA).
A statistical significance level of P<0.05 was used.
results
In the subjective evaluations, the intraobserver reliabil- ity was statistically significant in all cases. The interob- server reliability was statistically significant for both di- agnostic tasks(Table 2).
A B
Fig. 4. Cone-beam computed tomo-graphic images show examples of acceptable(A) and the unacceptable (B) image quality.
Table 2. Intraclass correlation coefficients for intraobserver and interobserver reliability
Reliability Observer Periapical diagnosis Implant planning
Intraobserver
1 0.807* 0.886*
2 0.678* 0.609*
3 0.707* 0.674*
4 0.315* 0.597*
5 0.865* 0.701*
6 0.473* 0.457*
Interobserver 0.764* 0.636*
*P<0.05
Subjective evaluation and the effects of tube voltage and tube current on image quality
The classification of images according to the subjec- tive evaluations is presented in Table 3. The differences in tube voltage and tube current between the acceptable and
unacceptable image quality groups are shown in Figure 5. In both the maxilla and the mandible, for periapical di- agnosis and implant planning, the tube current of the ac- ceptable images was significantly higher than that of the unacceptable images(P<0.05). In all cases, the area under
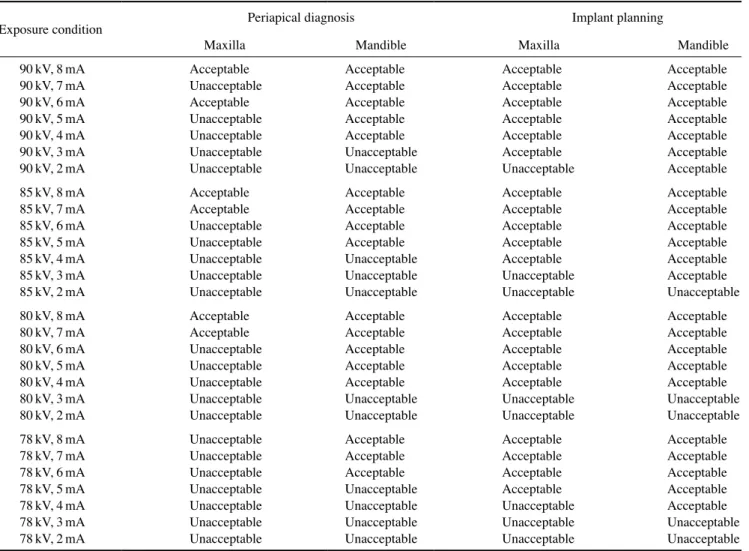
Table 3. Image classification according to the subjective evaluations
Exposure condition Periapical diagnosis Implant planning
Maxilla Mandible Maxilla Mandible
90kV, 8mA Acceptable Acceptable Acceptable Acceptable
90kV, 7mA Unacceptable Acceptable Acceptable Acceptable
90kV, 6mA Acceptable Acceptable Acceptable Acceptable
90kV, 5mA Unacceptable Acceptable Acceptable Acceptable
90kV, 4mA Unacceptable Acceptable Acceptable Acceptable
90kV, 3mA Unacceptable Unacceptable Acceptable Acceptable
90kV, 2mA Unacceptable Unacceptable Unacceptable Acceptable
85kV, 8mA Acceptable Acceptable Acceptable Acceptable
85kV, 7mA Acceptable Acceptable Acceptable Acceptable
85kV, 6mA Unacceptable Acceptable Acceptable Acceptable
85kV, 5mA Unacceptable Acceptable Acceptable Acceptable
85kV, 4mA Unacceptable Unacceptable Acceptable Acceptable
85kV, 3mA Unacceptable Unacceptable Unacceptable Acceptable
85kV, 2mA Unacceptable Unacceptable Unacceptable Unacceptable
80kV, 8mA Acceptable Acceptable Acceptable Acceptable
80kV, 7mA Acceptable Acceptable Acceptable Acceptable
80kV, 6mA Unacceptable Acceptable Acceptable Acceptable
80kV, 5mA Unacceptable Acceptable Acceptable Acceptable
80kV, 4mA Unacceptable Acceptable Acceptable Acceptable
80kV, 3mA Unacceptable Unacceptable Unacceptable Unacceptable
80kV, 2mA Unacceptable Unacceptable Unacceptable Unacceptable
78kV, 8mA Unacceptable Acceptable Acceptable Acceptable
78kV, 7mA Unacceptable Acceptable Acceptable Acceptable
78kV, 6mA Unacceptable Acceptable Acceptable Acceptable
78kV, 5mA Unacceptable Unacceptable Acceptable Acceptable
78kV, 4mA Unacceptable Unacceptable Unacceptable Acceptable
78kV, 3mA Unacceptable Unacceptable Unacceptable Unacceptable
78kV, 2mA Unacceptable Unacceptable Unacceptable Unacceptable
A B
Fig. 5. Differences between acceptable and unacceptable images in tube voltage(A) and current(B). A: acceptable group, Un: unacceptable group, PD: periapical diagnosis, IP: implant planning, Mx: maxilla, Mn: mandible.
the curve(AUC) was higher than 0.5 and the significance level was below 0.05, suggesting that the cut-off values were useful for distinguishing between acceptable and un- acceptable images(Table 4). However, the tube voltage of the acceptable images did not show statistically significant
differences from that of the unacceptable images(P>0.05).
This result implies that tube current has a major influence on periapical diagnosis and implant planning in the maxilla and the mandible.
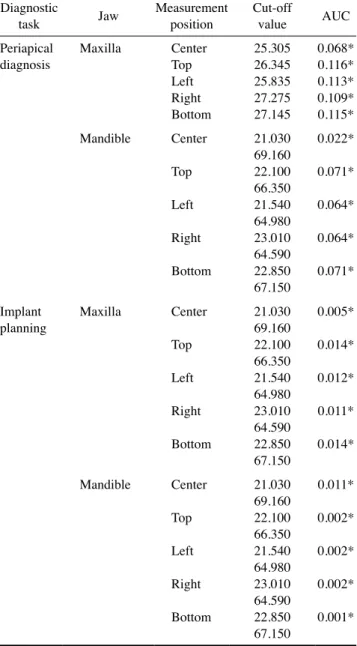
Relationships between physical factors and clinical image quality
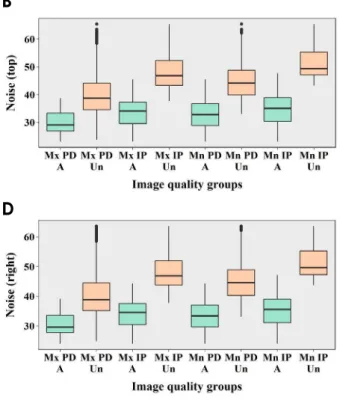
In the maxilla and the mandible, for periapical diagnosis and the implant planning, image noise showed statistically significant differences between the acceptable and unac- ceptable image quality groups(P<0.05)(Fig. 6). For all cases, significantly more image noise was present in the unacceptable images than in the acceptable images. How- ever, in all cases, the AUC was lower than 0.5, suggesting that the cut-off values were not useful(Table 5).
Table 4. Cut-off values and areas under the curve(AUCs) ob- tained by receiver operating characteristic(ROC) curve analyses for tube current
Diagnostic task Jaw Cut-off value AUC Periapical diagnosis Maxilla 6.500 0.924*
Mandible 4.500 0.971*
Implant planning Maxilla 3.500 0.975*
Mandible 3.500 0.952*
*P<0.05
A B
C D
E
Fig. 6. Differences between acceptable and unacceptable images in image noise values according to the measurement positions. A: Accept- able group, Un: unacceptable group, PD: periapical diagnosis, IP: implant planning, Mx: maxilla, Mn: mandible.
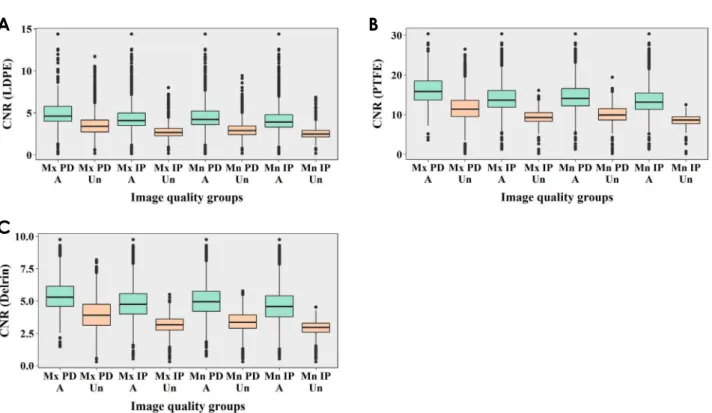
In the maxilla and the mandible, for periapical diagnosis and the implant planning, the CNR for LDPE, PTFE, and Delrin showed statistically significant differences between the acceptable and unacceptable image quality groups (P<0.05)(Fig. 7). In all cases, the CNR values of the ac- ceptable images were significantly higher than those of the unacceptable images. All the AUCs were higher than 0.5 and all of the significance levels were below 0.05, suggest- ing that the cut-off values were useful(Table 6).
The results of the rod visibility tests varied depending on the material of the rod. In some cases, the results showed statistically significant differences between the acceptable
and unacceptable image quality groups(Fig. 8).
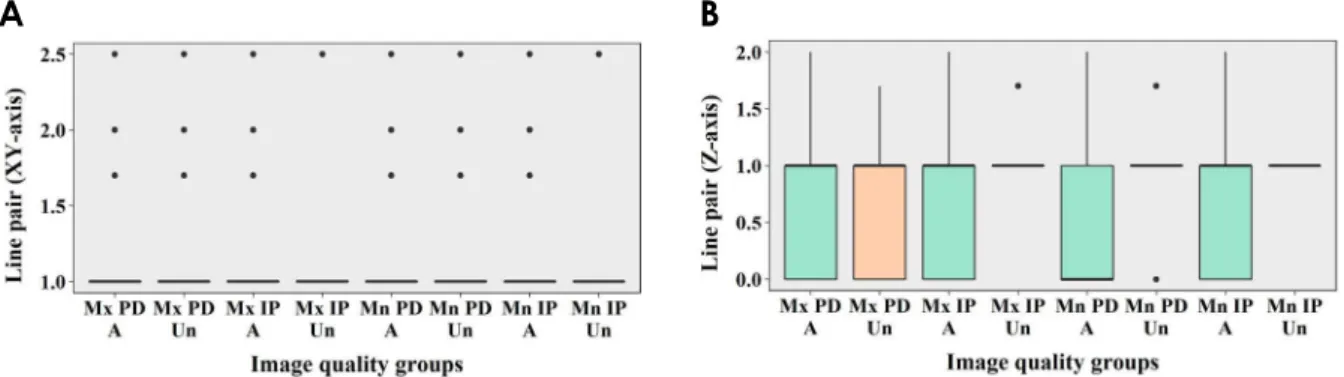
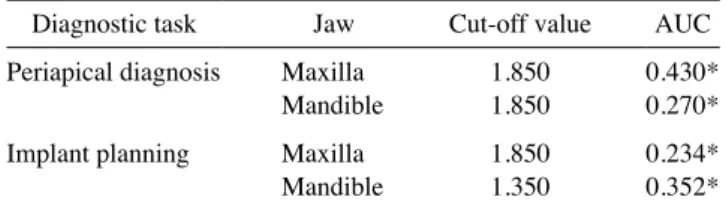
The results of the line pair chart analysis are shown in Figure 9. The results for the Z-axis showed statistically significant differences between the acceptable and unac- ceptable image quality groups(P<0.05). All the Z-axis re- sults in the acceptable images were significantly lower than those in the unacceptable images. In the ROC analysis, all the AUCs were lower than 0.5, suggesting that the cut-off values were not useful(Table 7).
In all cases, the MTF 50 and MTF 10 showed statisti- cally significant differences between the acceptable and unacceptable image quality groups(P<0.05)(Fig. 10). The values of the acceptable images were significantly higher than those of the unacceptable images. In the ROC curves of the MTF 10, all the AUCs were higher than 0.5 and all the significance levels were below 0.05, suggesting that the cut-off values were useful(Table 8).
The results of the metal artifact tests are shown in Fig- ure 11. In all cases, there were no statistically significant differences in the results of the metal artifact tests between the acceptable and unacceptable image quality groups(P>
0.05).
discussion
In this study, the effects of tube voltage and current on technical and clinical image quality was assessed. To eval- uate the effects of tube voltage and current on the techni- cal image quality, physical factors associated with image noise, contrast resolution, spatial resolution, and metal ar- tifacts were used. Contrast resolution was measured using the CNR and rod visibility tests, while spatial resolution was measured by means of a LP chart and the MTF using an LSF insert.
Image noise can be affected by factors such as the tube system(filtration, focal spot size, and FOV size), exposure parameters(tube voltage [kVp] and current [mA]), the ob- ject size, the efficiency of the detector, and reconstruction factors(filtering, voxel size).4,8 In this study, as the other factors were fixed, the noise values were only affected by differences in tube voltage and current. Generally, image noise decreases as tube voltage and current increase, be- cause the detector signal increases. Pauwels et al.22 insisted that low-dose protocols should consist of current reduction, rather than tube voltage reduction, because the increase in noise for a given dose reduction would be smaller. How- ever, Hidalgo Rivas et al.23 found that dose reductions to 50% less than the manufacturer’s recommendations could be achieved by reducing the X-ray tube voltage(80%), and
Table 5. Cut-off values and areas under the curve (AUCs) ob- tained by receiver operating characteristic(ROC) curve analyses for image noise tests
Diagnostic
task Jaw Measurement
position Cut-off
value AUC
Periapical
diagnosis Maxilla Center 25.305 0.068*
Top 26.345 0.116*
Left 25.835 0.113*
Right 27.275 0.109*
Bottom 27.145 0.115*
Mandible Center 21.030 0.022*
69.160
Top 22.100 0.071*
66.350
Left 21.540 0.064*
64.980
Right 23.010 0.064*
64.590
Bottom 22.850 0.071*
67.150 Implant
planning Maxilla Center 21.030 0.005*
69.160
Top 22.100 0.014*
66.350
Left 21.540 0.012*
64.980
Right 23.010 0.011*
64.590
Bottom 22.850 0.014*
67.150
Mandible Center 21.030 0.011*
69.160
Top 22.100 0.002*
66.350
Left 21.540 0.002*
64.980
Right 23.010 0.002*
64.590
Bottom 22.850 0.001*
67.150
*P<0.05
indeed for a range of combinations of tube voltage and cur- rent. The effect of tube voltage and current in CBCT has been investigated by several researchers, with most studies focusing on the effect of tube voltage and current reduc- tion on image quality. Diverse results have been reported, depending on the criteria used to evaluate image quality,
devices, exposure parameters, and the amount of dose re- duction. Most studies have found that a considerable dose reduction using exposure parameters below manufacturers’
default settings is possible with the image quality remain- ing adequate.24-31 The results of this study support those results, as changes in the tube current showed a significant effect on image quality. In contrast, the tube voltage did not exert a significant influence on image quality. Therefore, dose reduction should not be done entirely by changing the current. Instead, by reducing the tube voltage, the radiation dose can be reduced without degradation of image quality.
To evaluate the effect of tube voltage and current on the contrast resolution of the image, the CNR and rod visibility tests were used. In conventional radiography, as tube volt- age increases, both contrast and noise decrease. However, this dynamic of increased contrast at lower beam energies is not fully translatable to CBCT, because of the comple- mentary information encoded by projectional data from many angles.22,28 In addition, contrast resolution is affected by spatial resolution and noise.15 Therefore, it is difficult to define the relationship of the contrast resolution with tube voltage and current. Previous studies have measured the CNR to evaluate the technical image quality of CBCT images.1,7,8,12,22 Pauwels et al.8 found a clear hyperbolic
Table 6. Cut-off values and areas under the curve (AUCs) ob- tained by receiver operating characteristic(ROC) curve analyses for the contrast-to-noise ratio(CNR)
Diagnostic
task Jaw Rod type Cut-off
value AUC
Periapical
diagnosis Maxilla LDPE 3.945 0.785*
PTFE 13.395 0.834*
Delrin 4.675 0.776*
Mandible LDPE 3.475 0.854*
PTFE 11.880 0.870*
Delrin 4.155 0.846*
Implant
planning Maxilla LDPE 3.315 0.876*
PTFE 11.235 0.917*
Delrin 3.815 0.877*
Mandible LDPE 3.155 0.880*
PTFE 10.255 0.952*
Delrin 3.575 0.893*
LDPE: low-density polyethylene, PTFE: polytetrafluoroethylene, *P<0.05
A B
C
Fig. 7. Differences between acceptable and unacceptable images in the contrast-to-noise ratio(CNR) according to the rod type. LDPE:
low-density polyethylene, PTFE: polytetrafluoroethylene, A: acceptable group, Un: unacceptable group, PD: periapical diagnosis, IP: im- plant planning, Mx: maxilla, Mn: mandible.
relationship between CNR values and current. Choi et al.7 suggested investigating the relationship between CNR val- ues and the results of the rod visibility test, because the rod visibility test would be more convenient and time-saving than measuring the CNR. Publication 93 of the Interna- tional Commission on Radiologic Protection17 states that low-contrast resolution has a closer relationship to clin- ical image quality than high-contrast resolution because high-contrast resolution is not meaningfully influenced by an increase in the noise level. Bamba et al.1 reported that a contrast resolution phantom made of low-contrast ma-
terials such as LDPE, Delrin, and PTFE rods was useful for distinguishing between devices’ performance in con- trast resolution. They found that small-diameter rods made of low-contrast-resolution materials were not observed in some low-dose protocols. This study showed that the CNR values of the acceptable images were significantly higher than those of the unacceptable images for relatively low-contrast materials(LDPE, PTFE, Delrin). Nonetheless, the results of rod visibility tests obtained using Radia soft- ware varied according to the rod material.
Spatial resolution can be influenced by various factors,
A B
C
Fig. 8. Differences between acceptable and unacceptable images in the number of detected rods according to the rod type. LDPE: low-den- sity polyethylene, PTFE: polytetrafluoroethylene, A: acceptable group, Un: unacceptable group, PD: periapical diagnosis, IP: implant plan- ning, Mx: maxilla, Mn: mandible.
A B
Fig. 9. Differences between acceptable and unacceptable images in the results of line pair charts according to the axes. A: acceptable group, Un: unacceptable group, PD: periapical diagnosis, IP: implant planning, Mx: maxilla, Mn: mandible.
such as FOV size, tube current, noise, geometric accuracy, and voxel size.15 Brüllmann and Schulze19 reported that the line-pairs per millimeter(lp/mm) ranged between 0.61lp/
mm and 2.8lp/mm in CBCT scanners according to the 9 articles that they reviewed. Bamba et al.1 reported the max- imum line pairs distinguished using CBCT devices in their study was in the range of 1-3 lp/mm, depending on the ex- posure protocol. Furthermore, Pauwels et al.15 reported that the maximum line pairs varied according to the voxel size, FOV size and current. On that basis, they argued that the user should be able to select appropriate exposure protocols according to the various diagnostic requirements in dental practice. In this study, the results on the XY-plane ranged from 1lp/mm to 2.5lp/mm. The results on the Z-axis ranged from 0 lp/mm to 2 lp/mm. However, the results on the Z-axis of the acceptable images were significantly low- er than those of the unacceptable images, which may have been due to decreased contrast between aluminum and the polymer at high radiation doses.
Suomalainen et al.12 revealed that the MTF at 10% mod- ulation of their studied devices was a mean of 1.60(±0.83) cycles per millimeter. Brüllmann and Schulze19 reported that in the 6 reports they reviewed, the MTF 10 values were in range of 0.5-2.3 cycles per millimeter with a me- dian value of 2.1 cycles per millimeter. These data were acquired in experimental conditions using phantoms. The
MTF 10 values in this study were in the range of 1.9-30.5 cycles per millimeter, with a median value of 7.5 cycles per millimeter. The range of the values obtained through the Radia software was much higher than the ranges report- ed in previous studies.12,19 It is speculated that the Radia software might compute spatial resolutions from a single slice of image data without using an oversampling method, which probably led to the unreliable results.32 The short wire length of 16mm limited the number of slices to only about 50 images, and the edge was too distorted to obtain an oversampled edge profile.32 However, due to the effects of the Nyquist theorem and other image-degrading factors, the spatial resolution in clinical situations is considerably lower than predicted.19 Furthermore, patient movement exceeding the voxel size further reduces the available spa- tial resolution. Although the MTF value can be influenced by tube current, the FOV diameter and voxel size affect it more strongly.10 However, it should not be considered that an instrument equipped with a smaller voxel size always leads to a higher spatial resolution. In fact, voxel size is only a very crude predictor of the available spatial resolu- tion.16,19 The spatial resolution of CT is affected by several
A B
Fig. 10. Differences between acceptable and unacceptable images in the modulation transfer function(MTF) values. A: acceptable group, Un: unacceptable group, PD: periapical diagnosis, IP: implant planning, Mx: maxilla, Mn: mandible.
Table 7. Cut-off values and areas under the curve(AUCs) obtained by receiver operating characteristic(ROC) curve analyses for line pair charts on the Z-axis
Diagnostic task Jaw Cut-off value AUC
Periapical diagnosis Maxilla 1.850 0.430*
Mandible 1.850 0.270*
Implant planning Maxilla 1.850 0.234*
Mandible 1.350 0.352*
*P<0.05
Table 8. Cut-off values and areas under the curve(AUCs) obta- ined by receiver operating characteristic(ROC) curve analyses for the modulation transfer function(MTF)
Diagnostic
task Jaw MTF Cut-off
value AUC
Periapical
diagnosis Maxilla MTF 50 1.855 0.502
MTF 10 10.315 0.529*
Mandible MTF 50 1.925 0.598*
MTF 10 8.395 0.522*
Implant
planning Maxilla MTF 50 1.935 0.581*
MTF 10 8.395 0.521*
Mandible MTF 50 1.945 0.519
MTF 10 8.705 0.525*
*P<0.05
parameters, including the collimation of the detector, den- sity of the detector elements, helical pitch, reconstruction algorithm, and pixel size.33 This study proved that MTF 10 could be an important factor for subjective evaluations.
Metal artifacts were also measured in this study. Physical factors such as tube voltage, current, FOV size, and the re- constructed voxel size influence the quantities of metal arti- facts in CBCT, as do the type of detector and reconstruction algorithms. According to Freitas et al.,20 increasing the tube voltage was effective for decreasing CBCT artifacts. Pau- wels et al.34 reported there were no perceptible differences in the quantity of metal artifacts between high-current and low-current protocols for some CBCT devices. They also reported that artifact reduction by adjusting exposure pa- rameters was possible to a very limited extent and was not clinically feasible. Schulze et al.35 argued that meaningful artifact reduction should be based on improvements of the reconstruction algorithms, because artifact reduction by increasing the FOV size and current is limited by the con- comitant increase in the radiation dose. In all cases in this study, there were no statistically significant differences in the results of the metal artifact tests between the acceptable images and the unacceptable images. These results showed that the amount of metal artifacts was not significantly af- fected by exposure conditions.
This study demonstrated that clinical image quality can
be maintained in lower exposure conditions than the pa- rameters currently provided by the manufacturer. In addi- tion, since tube current has a major influence on clinical image quality, optimization should be performed by reduc- ing the tube voltage alone or the tube voltage and the tube current simultaneously within a certain range. The CNR and MTF 10 were also related to clinical image quality.
Therefore, when establishing standardized objective crite- ria for measuring CBCT image quality, the CNR and MTF 10 should be measured.
references
1. Bamba J, Araki K, Endo A, Okano T. Image quality assessment of three cone beam CT machines using the SEDENTEXCT CT phantom. Dentomaxillofac Radiol 2013; 42: 20120445.
2. Scarfe WC, Farman AG, Sukovic P. Clinical applications of cone-beam computed tomography in dental practice. J Can Dent Assoc 2006; 72: 75-80.
3. Ludlow JB, Davies-Ludlow LE, White SC. Patient risk relat- ed to common dental radiographic examinations: the impact of 2007 International Commission on Radiological Protection recommendations regarding dose calculation. J Am Dent As- soc 2008; 139: 1237-43.
4. Al-Okshi A, Theodorakou C, Lindh C. Dose optimization for assessment of periodontal structures in cone beam CT exam- inations. Dentomaxillofac Radiol 2017; 46: 20160311.
5. Cohnen M, Kemper J, Möbes O, Pawelzik J, Mödder U. Radi-
A B
C D
Fig. 11. Differences between acceptable and unacceptable images in the results of metal artifact tests according to the measurement posi- tions. A: acceptable group, Un: unacceptable group, PD: periapical diagnosis, IP: implant planning, Mx: maxilla, Mn: mandible.
ation dose in dental radiology. Eur Radiol 2002; 12: 634-7.
6. Ludlow JB, Davies-Ludlow LE, Brooks SL, Howerton WB.
Dosimetry of 3 CBCT devices for oral and maxillofacial ra- diology: CB Mercuray, NewTom 3G and i-CAT. Dentomaxil- lofac Radiol 2006; 35: 219-26.
7. Choi JW, Lee SS, Choi SC, Heo MS, Huh KH, Yi WJ, et al.
Relationship between physical factors and subjective image quality of cone-beam computed tomography images accord- ing to diagnostic task. Oral Surg Oral Med Oral Pathol Oral Radiol 2015; 119: 357-65.
8. Pauwels R, Seynaeve L, Henriques JC, de Oliveira-Santos C, Souza PC, Westphalen FH, et al. Optimization of dental CBCT exposures through mAs reduction. Dentomaxillofac Radiol 2015; 44: 20150108.
9. Liang X, Jacobs R, Hassan B, Li L, Pauwels R, Corpas L, et al. A comparative evaluation of cone beam computed tomog- raphy(CBCT) and multi-slice CT(MSCT) Part I. On subjec- tive image quality. Eur J Radiol 2010; 75: 265-9.
10. Ludlow JB, Walker C. Assessment of phantom dosimetry and image quality of i-CAT FLX cone-beam computed tomogra- phy. Am J Orthod Dentofacial Orthop 2013; 144: 802-17.
11. Loubele M, Jacobs R, Maes F, Denis K, White S, Coudyzer W, et al. Image quality vs radiation dose of four cone beam com- puted tomography scanners. Dentomaxillofac Radiol 2008;
37: 309-18.
12. Suomalainen A, Kiljunen T, Käser Y, Peltola J, Kortesniemi M.
Dosimetry and image quality of four dental cone beam com- puted tomography scanners compared with multislice comput- ed tomography scanners. Dentomaxillofac Radiol 2009; 38:
367-78.
13. Loubele M, Van Assche N, Carpentier K, Maes F, Jacobs R, van Steenberghe D, et al. Comparative localized linear accura- cy of small-field cone-beam CT and multislice CT for alveolar bone measurements. Oral Surg Oral Med Oral Pathol Oral Radiol Endod 2008; 105: 512-8.
14. Loubele M, Maes F, Schutyser F, Marchal G, Jacobs R, Suet- ens P. Assessment of bone segmentation quality of cone-beam CT versus multislice spiral CT: a pilot study. Oral Surg Oral Med Oral Pathol Oral Radiol Endod 2006; 102: 225-34.
15. Pauwels R, Beinsberger J, Stamatakis H, Tsiklakis K, Walker A, Bosmans H, et al. Comparison of spatial and contrast res- olution for cone-beam computed tomography scanners. Oral Surg Oral Med Oral Pathol Oral Radiol 2012; 114: 127-35.
16. Pauwels R, Stamatakis H, Manousaridis G, Walker A, Michiel- sen K, Bosmans H, et al. Development and applicability of a quality control phantom for dental cone-beam CT. J Appl Clin Med Phys 2011; 12: 3478.
17. International Commission on Radiological Protection. Manag- ing patient dose in digital radiology. A report of the Internation- al Commission on Radiological Protection. Ann ICRP 2004;
34: 1-73.
18. Bushberg JT, Seibert JA, Leidholdt EM Jr, Boone JM. The essential physics of medical imaging. 3rd ed. Philadelphia: Lip- pincott Williams & Wilkins; 2012. p. 60-99.
19. Brüllmann D, Schulze RK. Spatial resolution in CBCT ma- chines for dental/maxillofacial applications - what do we know today? Dentomaxillofac Radiol 2015; 44: 20140204.
20. Freitas DQ, Fontenele RC, Nascimento EHL, Vasconcelos TV,
Noujeim M. Influence of acquisition parameters on the magni- tude of cone beam computed tomography artifacts. Dentomax- illofac Radiol 2018; 47: 20180151.
21. Landis JR, Koch GG. The measurement of observer agree- ment for categorical data. Biometrics 1977; 33: 159-74.
22. Pauwels R, Silkosessak O, Jacobs R, Bogaerts R, Bosmans H, Panmekiate S. A pragmatic approach to determine the optimal kVp in cone beam CT: balancing contrast-to-noise ratio and radiation dose. Dentomaxillofac Radiol 2014; 43: 20140059.
23. Hidalgo Rivas JA, Horner K, Thiruvenkatachari B, Davies J, Theodorakou C. Development of a low-dose protocol for cone beam CT examinations of the anterior maxilla in children. Br J Radiol 2015; 88: 20150559.
24. Kwong JC, Palomo JM, Landers MA, Figueroa A, Hans MG.
Image quality produced by different cone-beam computed to- mography settings. Am J Orthod Dentofacial Orthop 2008; 133:
317-27.
25. Sur J, Seki K, Koizumi H, Nakajima K, Okano T. Effects of tube current on cone-beam computerized tomography image quality for presurgical implant planning in vitro. Oral Surg Oral Med Oral Pathol Oral Radiol Endod 2010; 110: e29-33.
26. Dawood A, Brown J, Sauret-Jackson V, Purkayastha S. Optimi- zation of cone beam CT exposure for pre-surgical evaluation of the implant site. Dentomaxillofac Radiol 2012; 41: 70-4.
27. Panmekiate S, Apinhasmit W, Petersson A. Effect of electric potential and current on mandibular linear measurements in cone beam CT. Dentomaxillofac Radiol 2012; 41: 578-82.
28. McGuigan MB, Duncan HF, Horner K. An analysis of effective dose optimization and its impact on image quality and diagnos- tic efficacy relating to dental cone beam computed tomography (CBCT). Swiss Dent J 2018; 128: 297-316.
29. Goulston R, Davies J, Horner K, Murphy F. Dose optimization by altering the operating potential and tube current exposure time product in dental cone beam CT: a systematic review.
Dentomaxillofac Radiol 2016; 45: 20150254.
30. de Oliveira MV, Wenzel A, Campos PS, Spin-Neto R. Quality assurance phantoms for cone beam computed tomography: a systematic literature review. Dentomaxillofac Radiol 2017; 46:
20160329.
31. Choi JW. Analysis of the priority of anatomic structures accord- ing to the diagnostic task in cone-beam computed tomographic images. Imaging Sci Dent 2016; 46: 245-9.
32. Watanabe H, Nomura Y, Kuribayashi A, Kurabayashi T. Spatial resolution measurements by Radia diagnostic software with SEDENTEXCT image quality phantom in cone beam CT for dental use. Dentomaxillofac Radiol 2018; 47: 20170307.
33. Watanabe H, Honda E, Tetsumura A, Kurabayashi T. A compar- ative study for spatial resolution and subjective image charac- teristics of a multi-slice CT and a cone-beam CT for dental use.
Eur J Radiol 2011; 77: 397-402.
34. Pauwels R, Stamatakis H, Bosmans H, Bogaerts R, Jacobs R, Horner K, et al. Quantification of metal artifacts on cone beam computed tomography images. Clin Oral Implants Res 2013;
24 Suppl A100: 94-9.
35. Schulze RK, Berndt D, d’Hoedt B. On cone-beam computed tomography artifacts induced by titanium implants. Clin Oral Implants Res 2010; 21: 100-7.