콘빔CT 촬영 시 mAs의 변화에 따른 피부선량과 영상 품질에 관한 평가
성균관대학교 의과대학 삼성서울병원 방사선종양학과
안종호ㆍ홍채선ㆍ김진만ㆍ장준영
목 적: 선형가속기에 부착된 온보드영상장치(On-Board Imager)를 이용한 콘빔CT (Cone Beam Computerized Tomography)는 환자의 셋업 오차 확인 및 보정, 장기 및 표적의 움직임 확인이 용이한 장점이 있는 영상유도방사선 치료 장비이다. 하지만 촬영 시 받게 되는 imaging dose는 2차 암 발생위험의 원인이 된다. 이에 본 저자는 촬영조건(mAs)을 변화시킨 4가지 촬영 mode로 피부선량과 영상 품질을 비교 평가하여 적정한 촬영 mode를 제시하고자 한다.
대상 및 방법: 인체 모형 팬톰(RANDO phantom)을 사용하여 열형광선량계(TLD-100, Harshaw)를 두부, 흉부, 복부로 나누어 각 부위별로 8개씩 위치시킨 후 4가지의 촬영 mode (A: 125 kvp 80 mA 25 ms, B: 125 kvp 40 mA, 25 ms, C: 125 kvp 80 mA 10 ms, D: 125 kvp 40 mA, 10 ms)로 피부선량(skin dose)을 각각 3회씩 측정한 후 그 평균값을 얻어 평가하였고 catphan 504 phantom을 이용하여 장비 제조사의 영상 품질 정도관리 protocol에 따라서 각 촬영 mode 별 영상품질(image quality)을 비교 분석하였다.
결 과: 피부선량을 측정한 결과 두부에서는 A mode: 8.96 cGy, B mode: 4.59 cGy, C mode: 3.46 cGy, D mode: 1.76 cGy였고, 흉부는 A mode: 9.42 cGy, B mode: 4.58 cGy, C mode: 3.65 cGy, D mode: 1.85 cGy가 복부에서는 A mode: 9.97 cGy, B mode:
5.12 cGy, C mode: 4.03 cGy, D mode: 2.21 cGy의 값으로 측정이 되었다. 이는 A mode를 기준으로 약 B mode는 50%, C mode 60%, D mode는 80%의 선량 감소를 나타내었다. 영상품질 평가 항목인 HU reproducibility, Low contrast resolution, Spatial resolution (high contrast resolution), HU uniformity를 분석한 결과 모든 촬영mode에서 장비제조사에서 제시하는 tolerance 이내의 값으로 평가되었다.
결 론: 콘빔CT에 있어서 좋은 영상품질을 유지하면서 imaging dose를 줄이는 것은 중요하다. 이에 본 실험결과를 바탕으로 하여 soft tissue가 관심영역일 경우는 A mode로 두부 촬영 시 bone이 관심영역일 경우 D mode가 일반적인 경우에는 B, C mode가 적용 가능하리라 생각된다. 또한 콘빔CT촬영으로 인해 증가되는 2차 암 발생위험은 낮은 mAs의 촬영조건을 선택함 으로써 줄일 수 있을 것이다.
핵심용어: 콘빔CT (cone beam computerized tomography), 영상품질, 피부선량, 2차암발생위험
이 논문은 2007년 10월 17일 접수하여 2007년 12월 3일 채택되었음.
책임저자:안종호, 삼성서울병원 방사선종양학과 Tel: 02)3410-2596, Fax: 02)3410-2619 E-mail: [email protected]
서 론
현재 방사선 치료의 진행은 평면 이미지들만을 사용하였 던 2차원 방사선 치료에서 시작하여 3차원 입체조형치료법, 세기변조 방사선 치료, 영상유도방사선치료에 이르기까지 계 속적인 발전을 거듭해오고 있다. 영상유도방사선치료(Image Guided Radiation Therapy)는 매 치료 시 마다 환자의 set-up 오차와 장기 및 표적의 움직임 등 여러 가지 시간적인 변화 에 따른 요인들을 실시간으로 고려하여 치료에 적용 가능함 으로써 치료의 정확도를 높일 수 있는 치료 방법으로 이는 방사선 치료에 있어서 환자의 positing과 localization 측면에
서 새로운 패러다임으로 떠오르고 있다. 이런 모든 변형되고 guided한 기술은 공통적으로 환자가 받는 선량과 연관이 있 고 여기서 선량의 관리(dose management)적인 측면은 ALARA (As low as reasonably achievable)에 의해 적용되었다.4) 이는, 단순히 imaging dose를 최소화 하는 것보다 영상품질과 실제 치료 선량과의 상호 작용을 고려하는 것이 중요하다 할 수 있다. 2007년 AAPM (American Association of Physicist in Medicine) Task Group-75의 보고에 따르면 콘빔 CT의 촬영 조건을 표준모드(Standard mode)-125 KV, 80 mA, 25 ms로 지정한 후 전립선 암(prostate cancer)환자를 치료 전 매일 1 회씩 총 35회 촬영 할 경우 약 1,5∼2 Gy정도의 선량을 받게 되며3) 조직가중치를 고려한 유효선량(effective dose)의 경우 는 약 800 mSv가 받게 된다. 이는 2차암 발생 위험(secon- dary cacer risk)을 3∼4% 높이며, 흉부(Chest)의 경우 25회에
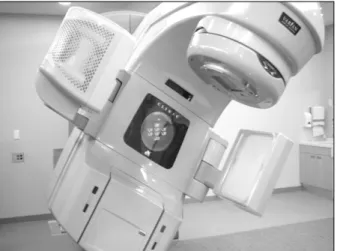
Fig. 1. Phatograph of the clinac ix with CBCT and OBI system.
Table 1. Exposure parameters
Mode Tube voltage mA ms
A 125 80 25 B 125 40 25 C 125 80 10 D 125 40 10
Standard mode (A), low dose mode (D)
Fig. 2-1. Photograph of a humannoid phantom (Rando, USA).
서 30회 동일한 촬영조건으로 시행할 경우 600∼700 mSv, 2 차암 발생위험이 3∼3.5%가 증가되고, 두경부(head & neck) 에 35회 촬영 시 수정체(lens)가 추가적으로 받게 되는 선량 은 2 Gy정도이다.5,6)
이러한 보고에서 알 수 있듯이 콘빔 CT 촬영 시 환자가 받 게 되는 imaging dose는 무시할 수 있는 수치가 아니며 이러 한 선량을 관리(dose management)하여 2차암발생위험(secon- dary cancer risk)을 줄여 주기 위해서는 가능한 lower mAs setting이 고려되어져야 할 것이다. 이러한 관점에서 콘빔CT 촬영을 할 경우 좋은 영상품질을 유지하면서 환자가 받게 되 는 선량을 최소한으로 줄여 줄 수 있는 촬영 조건을 찾아보 고 제시한 촬영 조건의 임상 적용 유용성을 평가하고자 한 다.
대상 및 방법 1. 사용된 장비
연구에 사용된 장비로 영상 유도 방사선치료에 이용되는 장비인 선형가속기(CLINAC iX, Varian, USA)를 사용하였다
(Fig. 1). 본 장비는 좌우대칭으로 KV 에너지를 발생시키는 KV source와 아모퍼스실리콘(a-Si)으로 구성된 KV detector 로 구성된 OBI (On-Board Imager)가 선형가속기에 부착되어 있다. KV source는 0.4 mm와 0.8 mm의 두 개의 초점을 가지 며 40에서 125 KVP까지의 관전압을 발생시키고 KV de- tector는 2,048×1,536 픽셀 해상력을 가지고 있다. 본 장비를 이용 콘빔 CT를 촬영하였고 촬영 시 피부선량을 줄여주고, X-ray scatter를 줄여주어 영상품질을 좋게 만드는 bow-tie filter를 이용하였으며, 피부선량과 영상품질을 비교 평가하 기 위하여 콘빔 CT 촬영조건 중 KVP를 125로 고정하고 mA 와 ms를 각각 4가지 경우의 수로 나누어 각각 A, B, C, D mode로 지정하였다(Table 1).
2. 피부선량(Skin dose) 측정 방법
피부선량은 인체모사팬톰(Anderson Rando Phantom, Al- derson Research Laboratories lnc., USA)에 열형광선량계 (4000, Harshaw, Solon Technologies lnc., USA)를 부착 하여 세가지 다른 scan site를 지정(두경부, 흉부, 복부)하여 측정 값을 얻었다(Fig. 2-1).
열형광선량계의 측정 point는 각 scan site별로 동일하게 지 정하였으며 scan 범위 내에서 앞쪽과 뒤쪽의 중심, Y1방향과 Y2방향으로 각각 5 cm 떨어진 곳과 RT와 LT는 중심에 위치 한 후 총 8개의 열형광선량계의 평균값을 얻어 피부선량을 측정하였다. 열형광선량계의 측정오차를 감안 통계상의 오차 를 줄이기 위해 각 scan site 별로 3회 반복하여 측정하여 평 균값을 얻어 결과치를 산출 하였다.
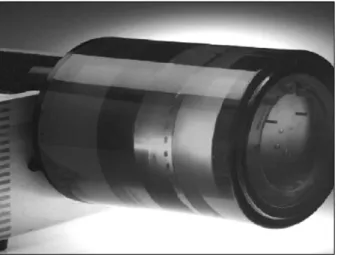
Fig. 2-2. Photograph of a Catphan 504 phantom. Fig. 3-2. Chest skin dose of each scan mode.
Fig. 3-1. Head & Neck skin dose of each scan mode. Fig. 3-3. Abdomen skin dose of each scan mode.
3. 영상품질(Image quality) test
장비 제조사에서 권고2)하고 있는 영상품질 정도관리 항목 (image quality QA list)의 4가지인 Hounsfield unit (HU) re- producibility, Low contrast resolution, Spatial (high contrast) resolution, Hounsfield unit (HU) uniformity를 Catphan 504 phantom을 이용(Fig. 2-2) 촬영 mode 별로 비교 평가 하였다.
결 과 1. 피부선량 측정결과
두경부와 흉부, 골반부에서 각 촬영 mode별로 피부선량을 측정한 결과 3가지 각기 다른 촬영 site 동일하게 A mode를 기준으로 B mode에서는 50%가 C mode에서는 60% D mode 에서는 80%로 피부선량이 감소하는 것으로 측정되었다(Fig.
3-1, 2, 3).
2. 영상품질(Image quality) test 결과
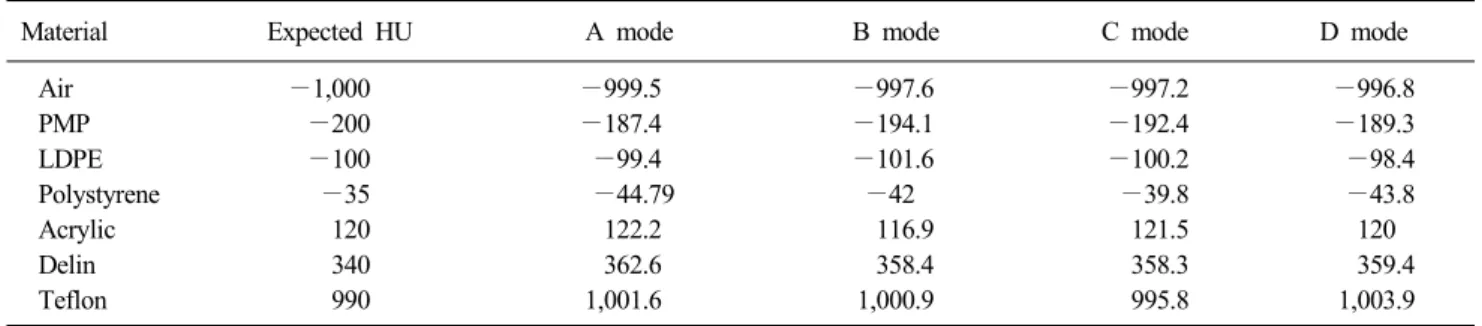
1) HU reproducibility4가지의 평가 항목 중 첫 번째인 HU reproducibility의 평 가는 선흡수 계수에 의해 좌우되는 각 조직의 CT number를 장치가 제대로 표현해 내는가를 평가하는 것으로 측정방법 은 Fig. 4에서 보는 것처럼 관심영역(ROI)을 정한 후 7가지 각기 다른 물질의 HU값을 측정하여 Expected HU값과 비교 평가하게 된다. 측정 결과 치는 Table 2-1, 2와 같으며 A, B, C, D 각 촬영 mode의 full fan과 half fan의 모든 측정 치가 제조사의 권고치인 ±40 HU 이내의 값으로 나타나 각기 다 른 촬영 mode에서 HU의 재현성은 적합 하다라는 결과를 얻 을 수가 있었다.
2) Low contrast와 Spatial (high contrast) resolution Low contrast와 Spatial (high contrast) resolution을 평가한 영상이다.
Fig. 4. The HU reproduciblity check.
Fig. 5. (A) The low contrast
resolution check. (B) The spatial (high contrast) resolution check.Table 2-1. HU linearity QA using full-fan CBCT scans (ROI: 0.7×0.7 cm)
Material Expected HU A mode B mode C mode D mode
Air −1,000 −999.5 −997.6 −997.2 −996.8
PMP −200 −187.4 −194.1 −192.4 −189.3
LDPE −100 −99.4 −101.6 −100.2 −98.4
Polystyrene −35 −44.79 −42 −39.8 −43.8
Acrylic 120 122.2 116.9 121.5 120
Delin 340 362.6 358.4 358.3 359.4
Teflon 990 1,001.6 1,000.9 995.8 1,003.9
The difference between the expected HU and measured HU should be <±40 HU
Table 2-2. HU linearity QA using half-fan CBCT scans (ROI: 0.7×0.7 cm)
Material Expected HU A mode B mode C mode D mode
Air −1,000 −996.6 −999.8 −999.9 −993.3
PMP −200 −181.2 −182.7 −187.9 −185.4
LDPE −100 −91.5 −88.1 −89.8 −98.4
Polystyrene −35 −29.8 −31.3 −27.1 −30.2
Acrylic 120 127.5 128.4 128.5 130.9
Delin 340 370.6 366.3 369.1 368.6
Teflon 990 1,017.5 1,011.9 1,017.8 1,012.2
The difference between the expected HU and measured HU should be <±40 HU
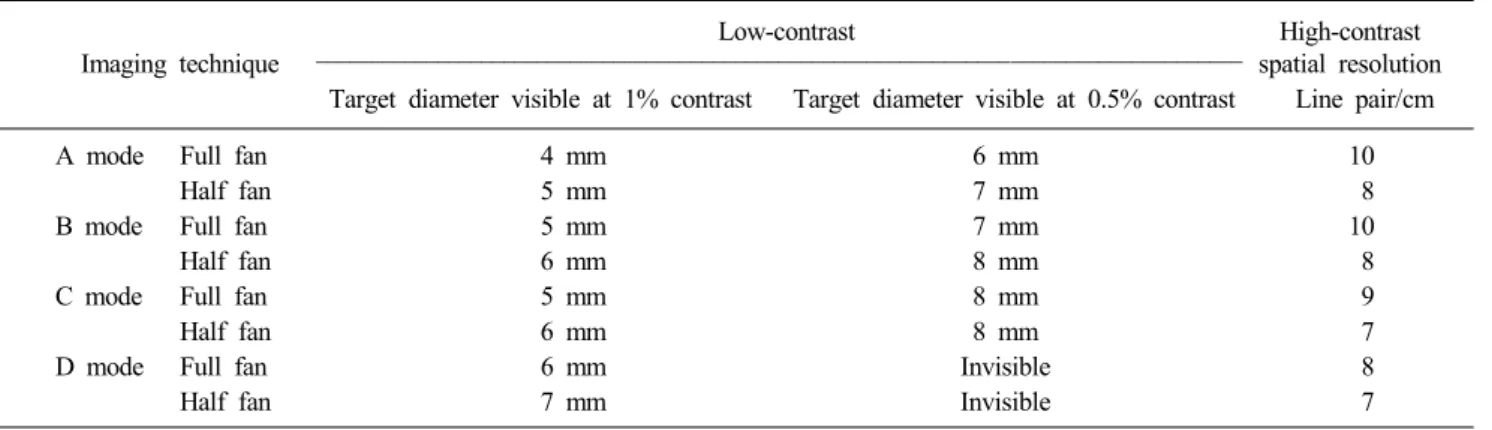
Fig. 5A는 Low contrast resolution을 평가한 것으로 선흡수 계수차이가 작은 물질(10 HU 이하)이 인접해 있을 때 장치 가 어느 정도까지 분리 식별 할 수 있는가를 평가하는 것으 로 장비제조사에서는 1% supra-slice group target을 7 mm까 지 식별 가능 할 것을 권고하고 있다. Fig. 5B는 Spatial (high contrast) resolution을 평가한 것으로 CT에서 균일한 배경에 서 미세한 크기의 선흡수계수 차이가 큰 물질(100 HU 이상) 이 인접해 있을 경우 장치가 어느 정도까지 분리 식별 할 수 있는가를 나타내는 능력을 의미하는 것으로 권고치는 6 LP/cm이다.2) 본 연구의 결과(Table 3)에서 Low contrast res- olution은 Full fan과 Half fan의 4가지 촬영 mode에서 제조
Table 3. Results of image quality tests
Low-contrast High-contrast
Imaging technique –––––––––––––––––––––––––––––––––––––––––––––––––––––––––––––––––––––––––––––––––––– spatial resolution Target diameter visible at 1% contrast Target diameter visible at 0.5% contrast Line pair/cm
A mode Full fan 4 mm 6 mm 10
Half fan 5 mm 7 mm 8
B mode Full fan 5 mm 7 mm 10
Half fan 6 mm 8 mm 8
C mode Full fan 5 mm 8 mm 9
Half fan 6 mm 8 mm 7
D mode Full fan 6 mm Invisible 8
Half fan 7 mm Invisible 7
Low contrast: 1% supra-slice group, the tolerance is disk 4 that is 7 mm diameter disk. High contrast: the tolerance is 6 Lp/cm
Table 4-2. Results of HU uniformity tests with half fan (ROI
with 10×10 pixels)ROI position A mode B mode C mode D mode
Center 110 109 112.2 112.6
Top 88.3 91.3 93.1 93.6 Right 93.7 92.3 99.1 94.9 Left 90.9 95.9 95.9 100.2 Bottom 91.2 95.3 95.7 96.4 Repeat the measurement for center, top, right, bottom and left ROIs. The tolerance is <±40 HU
Fig. 6. The HU uniformity check.
Table 4-1. Results of HU uniformity tests with full fan (ROI
with 20×20 pixels)ROI position A mode B mode C mode D mode Center 92.3 78.9 76.9 73.5
Top 80.6 79 77.9 76.4
Right 86.3 85.1 82.7 81.8
Left 81.6 81.8 82.7 78.8
Bottom 83.4 84.3 81.6 80.1 Repeat the measurement for center, top, right, bottom and left ROIs. The tolerance is <±40 HU.
사의 권고치인 1% Supra-slice group의 target에서 7 mm 이내 의 값으로 측정 되었으며, D mode를 제외한 다른 촬영 mode 에서는 0.5% Supra-slice group의 target도 식별 가능하였다.
Spatial (high contrast)resolution의 결과는 4가지 촬영 mode에 서 모든 측정치가 제조사의 권고치인 6 LP/cm 이상의 값으 로 측정되었다.
3) HU uniformity
영상의 여러 부위에서 어느 정도로 CT number가 균일한 가를 평가하는 HU uniformity를 측정하였다(Fig. 6). 측정방 법은 관심영역(ROI)을 일정한 픽셀 값으로 정한 후 center와 right, left, top, bottom으로 나누어 HU값을 측정한 후 비교 평가한다. 측정한 결과는 Table 4-1, 2와 같으며 결과 값에서 알 수 있듯 A, B, C, D 각 촬영 MODE의 측정 값이 제조사에 서 권고하는 ±40 HU 이내로 나타났다. 이는 full fan과 half fan의 HU uniformity 적합하다는 결과를 얻을 수가 있다.2)
고안 및 결론
콘빔CT 영상은 치료 전 환자의 Set-up오차와 장기 및 표적 의 움직임 확인을 기존의 정면과 측면이란 두 방향의 2차원 적 영상의 비교와 달리 하나의 체적으로 재구성된 3차원적 영상으로 비교함으로써 보다 정확한 방사선 치료 구현을 가
능하게 한다. 하지만 이미 여러 연구자들에 의해 보고 되어
있듯이1,4,6) 콘빔CT 촬영을 할 경우 환자가 받게 되는 Imag-
ing Dose가 문제가 된다. 이에 좋은 영상품질을 유지 하면서 콘빔CT 촬영 시 환자가 받게 되는 Imaging Dose를 낮추어주 어 2차암발생위험(Secondary Cancer Risk)을 줄여 주는 것은 매우 중요하다 할 것이다. 본 연구의 결과에 근거하여 움직 임이 많은 부위나 복잡한 모양의 표적용적과 작은 오차에도 급격한 선량변화를 나타내는 세기조절방사선 치료를 시행하 는 경우나 Soft Tissue가 관심영역인 경우 영상의 질이 가장 우수한 A mode의 촬영조건이 권고되며 A mode와 비슷한 영 상의 질을 유지하면서 피부선량을 50%에서 60%까지 줄여 줄 수 있는 B, C mode의 촬영 조건도 적용 가능하리라 사료 된다. 반면, 영상의 질은 다른 촬영 mode 보다 떨어지나 피 부선량을 가장 줄여 줄 수 있는 D mode의 촬영조건은 움직 임이 적은 두경부(Head & Neck)에서 뼈 합성(bone match- ing)만을 통해서도 충분히 set-up을 확인 할 수 있는 경우에 권고하는 바이다. 콘빔CT를 촬영 할 경우 근무자는 가능한 낮은 mAs의 촬영 mode의 사용을 고려해야 할 것이며 수회 에 걸쳐 콘빔CT를 촬영할 경우나 결정 장기의 적산선량을 고려해야하는 경우는 각 mode 중 상황에 따른 최적의 촬영 mode를 선택하여 콘빔CT 촬영을 하는 것이 유용할 것이다.
또한, 전체 치료 일정에 대한 콘빔CT의 적용 횟수는 Imaging Dose 측면에서 볼 때 중요한 사항 이라 할 수 있겠다. 이에 본 논문은 좋은 영상품질을 유지하면서 환자가 받는 선량은 줄일 수 있는 다양한 Mode를 제시함으로 전체 치료 일정에
서 다양한 콘빔 CT 적용의 조합을 가능하게 하였다. 나아가 앞으로 콘빔CT를 촬영 할 경우 호흡에 의해 움직임이 큰 간 이나 폐와 같은 부위는 호흡에 의한 Artifact로 인해 영상의 질이 떨어지는 것을 감안, Breathing Hold Technique으로 콘 빔CT를 촬영하거나 RPM (실시간위치추적 시스템)과 연동 일정한 호흡주기에만 콘빔CT를 촬영 할 수 있는 방법을 고 안하여 보다 나은 영상의 질을 제공하여 최상의 방사선 치료 구현을 실현해야 할 것이다.
참고문헌
1. Radiation dose from cone beam CT for IGRT; Kan et al., IJROBP, Vol. 70, No.1, pp. 272-279, 2008
2. A quality assurance program for the on-board imagerⓇ, Yoo et al.: QA for OBI and CBCT Med. Phys. 33 (11), November 2006
3. Wen N, Guan H, Hammoud R, et al.: Dose delivered from Varian’s CBCT to patients receiving IMRT for prostate cancer.
Phys Med Biol 2007;52:2267-2276
4. ICRP 60. Recommendations of the International Commission of Radiological Protection. Oxford, UK: Pergamon Press;1991 5. Groves AM, Owen KE, Courtney HM, et al.: 16-detector
multi-slice CT: dosimetry estimation by TLD measurement compared with Monte Carlo simulation. Br J Radiol 2004;
77:662-665
6. Martin J, Murphy, James B, et al.: The management of imaging dose during image-guided radiatherapy: report of the AAPM task group 75. Med Phys 2007;34
Abstract
Evaluation of Skin Dose and Image Quality on Cone Beam Computed Tomography
Jong Ho Ahn, Chae Seon Hong, Jin Man Kim, Jun Young Jang Department of Radiation Oncology, Sansung Medical Center,
Sungkyunkwan University School of Medicine, Seoul, Korea
Purpose:
Cone-beam CT using linear accelerator attached to on-board imager is a image guided therapy equipment. Because it is to check the patient's set-up error, correction, organ and target movement. but imaging dose should be cause of the secondary cancer when taking a image. The aim of this study is investigation of appropriate cone beam CT scan mode to compare and estimate the image quality and skin dose.Materials and Methods:
Measurement by Thermoluminescence dosimeter (TLD-100, Harshaw) with using the Rando phantom are placed on each eight sites in seperately H&N, thoracic, abdominal section. each 4 methods of scan modes of are measured the for skin dose in three time. Subsequently, obtained average value. Following image quality QA protocol of equipment manufacturers using the catphan 504 phantom, image quality of each scan mode is compared and analyzed.Results:
The results of the measured skin dose are described in here. The skin dose of Head & Neck are measured mode A: 8.96 cGy, mode B: 4.59 cGy, mode C: 3.46 cGy mode D: 1.76 cGy and thoracic mode A:9.42 cGy, mode B: 4.58 cGy, mode C: 3.65 cGy, mode D: 1.85 cGy, and abdominal mode A: 9.97 cGy, mode B: 5.12 cGy, mode C: 4.03 cGy, mode D: 2.21 cGy. Approximately, dose of mode B are reduced 50%, mode C are reduced 60%, mode D are reduced 80% a point of reference dose of mode A. the results of analyzed HU reproducibility, low contrast resolution, spatial resolution (high contrast resolution), HU uniformity in evaluation item of image quality are within the tolerance value by recommended equipment manufacturer in all scan mode.
Conclusion:
Maintaining the image quality as well as reducing the image dose are very important in cone beam CT.In the result of this study, we are considered when to take mode A when interested in soft tissue. And we are considered to take mode D when interested in bone scan and we are considered to take mode B, C when standard scan. Increasing secondary cancer risk due to cone beam CT scan should be reduced by low mAs technique.