Original Article PET/CT 장비와 영상 재구성 차이에 따른 EQ PET을 이용한 표준섭취계수의 평가
서울대학교병원 핵의학과
윤석환·김병진·문일상·이홍재
Evaluation of Standardized Uptake Value applying EQ PET across different PET/CT scanners and reconstruction
Seok Hwan Yoon, Byung Jin Kim, Il Sang Moon and Lee Hong Jae Department of Nuclear Medicine, Seoul National University Hospital, Seoul, Korea
Purpose
Standardized uptake value(SUV) has been widely used as a quantitative metric of uptake in PET/CT for diagnosis of malignant tumors and evaluation of tumor therapy response. However, the SUV depends on various factor including PET/CT scanner specifications and reconstruction parameter. The purpose of this study is to validate a EQ PET to evaluate SUV across different PET/CT systems.Materials and Methods
First, NEMA IEC body phantom data were used to calculate the EQ filter for OSEM3D with PSF and TOF reconstruction from three different PET/CT systems in order to obtain EARL compliant recovery coefficients of each spheres. The Biograph true point 40 PET/CT images were reconstructed with a OSEM3D+PSF reconstruction, images of the Biograph mCT 40 and Biograph mCT 64 PET/CT scanners were reconstructed with a OSEM3D+PSF, OSEM3D+TOF, OSEM3D+PSF+TOF. Post reconstructions, the proprietary EQ filter was applied to the reconstruction data.Recovery coefficient can be estimated by ratio of measured to true activity concentration for spheres of different volume and coefficient variability(CV) value of RC for each sphere was compared.
For clinical study, we compared SUVmax applying different reconstruction algorithms in FDG PET images of 61 patients with lung cancer using Biograph mCT 40 PET/CT scanner.
Results
For the phantom studied, the mean values of CV for OSEM3D, OSEM3D+PSF, OSEM3D+TOF and OSEM3D+PSF+TOF reconstructions were 0.05, 0.04, 0.04 and 0.03 respectively for RC.Application of the proprietary EQ filter, the mean values of CV for OSEM3D, OSEM3D+PSF, OSEM3D+TOF and OSEM3D+PSF+TOF reconstructions were 0.04, 0.03, 0.03 and 0.02 respectively for RC.
Clinical study, there were no statistical significance of the difference applying EQ PET on SUVmax of 61 patients FDG PET image. (p=1.000)
Conclusion
This study indicates that CV values of RC in phantom were decreased after applying EQ PET for different PET/CT system and The EQ PET reduced reconstruction dependent variation in SUVs for 61 lung cancer patients, Therefore, EQ PET will be expected to provide accurate quantification when the patient is scanned on different PET/CT system.Key Words
PET/CT, EQ PET, Recovery coefficient, SUVmax4)
·Received: April 14, 2018 Accepted: April 30, 2018
·Corresponding author : Seok Hwan Yoon
·Address for correspondence : Department of Nuclear Medicine, Seoul National University Hospital, 101 Daehangno, Jongno-gu, Seoul, 110-744, Korea
Tel: +82-2-2072-2532, Fax: +82-2-766-9083
E-mail: [email protected]
서 론
PET 영상에서 정량적 평가의 지표로 사용되어지는 표준 섭취 계수(SUV: Standardized Uptake Value)는 방사능 의 농도를 나타내는데 주입한 추적자가 체내에 고루 분포했 을 때의 농도로 나누어 그 상대적 섭취율을 정량적으로 평가 할 수 있으며, 방사능의 농도는 MBq/ml 또는 μCi/ml로 나 타낸다.
1)
SUV = 투여방사능 체중
조직방사능 조직중량
SUV는 종양의 병소와 병기의 진단, 그리고 치료 성적 평 가에 있어서 사용되고 있는 유용한 지표이기 때문에 SUV의 측정에 영향을 줄만한 요소들인 환자의 체격, 방사성동위원 소 투여 후 검사까지의 시간, 부분용적효과, 관심영역의 설정, 검사장비, 영상의 재구성 방법, 호흡에 따른 위치 변동 등에 따 라 변화 되므로 다양한 인자의 영향을 고려하여야만 한다.
본 논문에서는 SUV에 영향을 주는 인자 중에서 PET/CT 장비와 영상의 재구성 방법별 SUV의 변화를 SIEMENS사 의 EQ PET을 이용하여 비교 평가해 보고자 하였다.
실험재료 및 방법 1. 장비 및 대상
본원에서 사용하고 있는 Biograph true point 40 (Siemens Healthcare)(Fig.1), Biograph mCT 40 (Siemens Healthcare), (Fig.2), Biograph mCT 64 (Siemens Healthcare)(Fig.3) 3대의 PET/CT 장비를 이 용하였으며, EQ PET을 적용하기 위해 NEMA IEC Body phantom(Fig.4)과 Syngo.via (Siemens Healthcare) 판 독용 workstaion을 사용하였다.
Fig. 1. Biograph true point 40 PET/CT scanner was used.
Fig. 2. Biograph mCT 40 PET/CT scanner was used.
Fig. 3. Biograph mCT 64 PET/CT scanner was used.
Fig. 4. NEMA IEC body phantom was used.
2. 연구방법
1) EQ PET
EQ PET의 원리는 서로 다른 PET/CT 장비와 영상의 재 구성 방법에 따라 달라지는 SUV에 EQ Filter 값을 적용하여 SUV의 차이를 줄여주는 방법이다.
EANM Research Ltd(EARL)에서 권고하는 NEMA IEC Body phantom의 각 구에 대한 최대 방사능 농도의 회 복계수를 기준으로 서로 다른 PET/CT 장비와 영상의 재구 성을 이용하여 획득한 팬텀영상에서 측정한 방사능 농도에
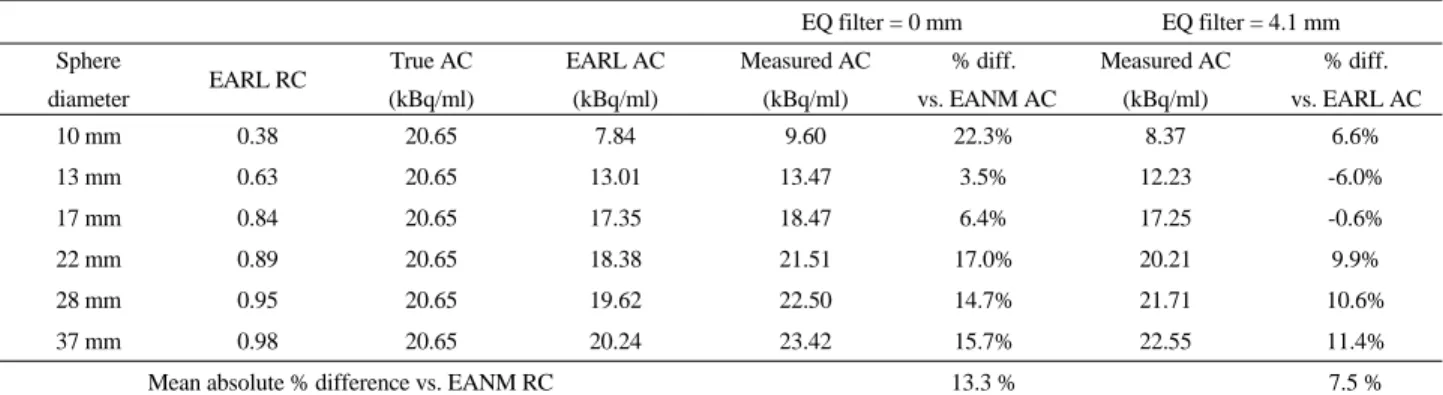
Table 2. Example of EQ filter value by applying OSEM3D reconstruction in Biograph true point 40 PET/CT scanner EQ filter = 0 mm EQ filter = 4.1 mm Sphere
diameter EARL RC True AC
(kBq/ml)
EARL AC (kBq/ml)
Measured AC (kBq/ml)
% diff.
vs. EANM AC
Measured AC (kBq/ml)
% diff.
vs. EARL AC
10 mm 0.38 20.65 7.84 9.60 22.3% 8.37 6.6%
13 mm 0.63 20.65 13.01 13.47 3.5% 12.23 -6.0%
17 mm 0.84 20.65 17.35 18.47 6.4% 17.25 -0.6%
22 mm 0.89 20.65 18.38 21.51 17.0% 20.21 9.9%
28 mm 0.95 20.65 19.62 22.50 14.7% 21.71 10.6%
37 mm 0.98 20.65 20.24 23.42 15.7% 22.55 11.4%
Mean absolute % difference vs. EANM RC 13.3 % 7.5 %
EQ filter 값을 적용하게 된다.(Table 1) EQ filter는 측정한 방사능 농도의 가우시안 분포의 filter로서 Full width half maximum (FWHM)의 크기로 나타내며 FWHM이 작을 수 로 방사능의 농도가 높게 측정되고 FWHM이 커질수록 방사 능의 농도가 작게 측정되어진다. 즉 FWHM의 크기를 조정 하여 EARL에서 기준으로 하는 방사능의 농도가 되도록 EQ filter 값을 산출하게 된다.(Fig.5)
2-4)
Table 1. Target recovery coefficient specifications for maximum voxel value of NEMA IEC body phantom in the EARL
Spherediameter (mm)
Sphere
volume (mL) Expected
RC Minimal
RC Maximal RC
10 0.52 0.38 0.31 0.49
13 1.15 0.63 0.59 0.85
17 2.57 0.84 0.73 1.01
22 5.57 0.89 0.83 1.09
28 11.49 0.95 0.91 1.13
37 26.52 0.98 0.95 1.16
Fig. 5. This image shows how to adjust FWHM for EQ filter value.
EQ filter 값을 산출하기 위해서는 첫 번째, 각 장비에 대 하여 cross calibration을 시행하였다. Dose calibrator에
서 측정한 방사능과 각각의 PET/CT 장비에서 측정되는 방 사능의 효율을 맞추기 위한 과정으로서 F-18 55.5 MBq을 Dose calibrator에서 측정 후 6 리터의 실린더 팬텀에 주입 하여 3대의 PET/CT 장비에서 팬텀 영상을 획득하였다.
획득한 팬텀영상에 ROI를 설정하여 측정한 계수 값과 실 제 방사능의 농도의 비를 계산 하여 3대의 PET/CT 장비 검 출 효율이 동일하도록 각각의 cross calibration factor 값 을 PET/CT 장비에 적용하였다.
두 번째는 EARL에서 기준으로 하는 NEMA IEC Body phantom의 방사능의 농도를 기준으로 설정하기 위해 F-18을 팬텀의 구에 20kBq/ml, 배후 방사능에 2kBq/ml 을 주입하여 구와 배후 방사능의 비율이 10:1이 되도록 팬텀 을 제작 후 3대의 PET/CT 장비에 임상용 FDG 프로토콜을 적용하여 NEMA IEC Body phantom 영상을 획득하였다.
세 번째는 SIEMENS사의 판독용 프로그램인 syngo.via 를 이용하여 NEMA IEC Body phantom 영상에서 6개 구에 VOI를 설정하여 6개 구의 방사능 농도를 측정하여 EQ filter 값을 산출하였다.(Table 2)(Fig.6)
5)
Fig. 6. Radioactivity concentration was measured on maximum
voxel values of each spheres.
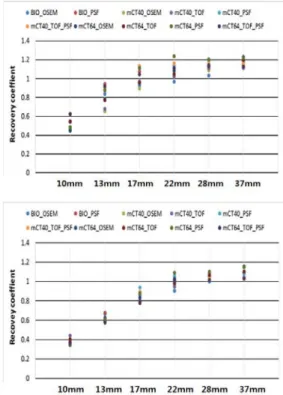
Fig. 7. Recovery coefficient graphs of each spheres on NEMA IEC body phantom. (a) before applying EQ PET, (b) after applying EQ PET.
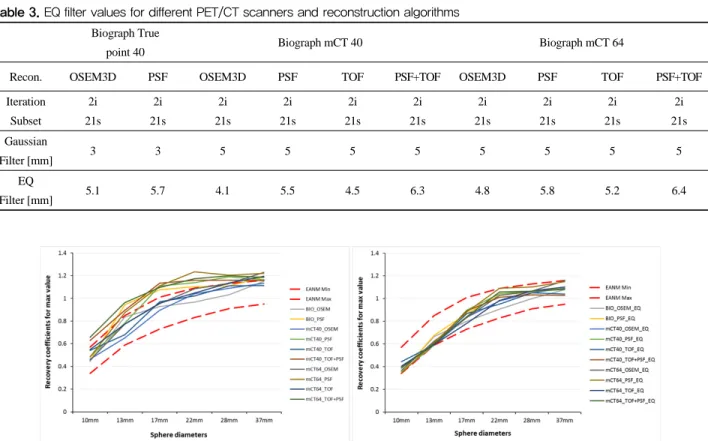
Table 3. EQ filter values for different PET/CT scanners and reconstruction algorithms Biograph True
point 40 Biograph mCT 40 Biograph mCT 64
Recon. OSEM3D PSF OSEM3D PSF TOF PSF+TOF OSEM3D PSF TOF PSF+TOF
Iteration Subset
2i 21s
2i 21s
2i 21s
2i 21s
2i 21s
2i 21s
2i 21s
2i 21s
2i 21s
2i 21s Gaussian
Filter [mm] 3 3 5 5 5 5 5 5 5 5
EQ
Filter [mm] 5.1 5.7 4.1 5.5 4.5 6.3 4.8 5.8 5.2 6.4
3대의 장비에서 획득한 NEMA IEC Body phantom의 영 상에서 6개 구의 방사능 농도의 값이 EARL에서 기준으로 하 는 방사능 농도 범위에 허용되도록 장비와 영상 재구성 별 EQ filter값을 산출하였다.(Table 3)
2) 팬텀실험
Biograph true point 40 Image size 168×168, 1bed/2 분 영상을 획득하였으며, 영상 재구성은 OSEM3D, OSEM3D+
PSF, Iteration 2, subset 21, Gaussian filter FWHM 3mm, Biograph mCT 40, Biograph mCT 64 Image size 200×200, 1bed/1분 영상을 획득하였으며, 영상 재구성은 OSEM3D, OSEM3D+PSF, OSEM3D+PSF, OSEM3D+TOF, OSEM3D+PSF+TOF Iteration 2, subset 21, Gaussian filter FWHM 5mm를 적용하였다 (Table 3).
3대의 PET/CT 장비에 대해서 영상 재구성을 달리 하였을 때 산출된 EQ Filter값을 적용하여 NEMA IEC Body phantom의 6개 구의 실제 방사능 농도와 측정한 방사능 농 도의 비율인 회복 계수를 측정하여 변동계수를 비교 하 였다.
3) 임상실험
임상 영상은 2017년 1월부터 2017년 7월까지 본원에서 Biograph mCT 40 PET/CT 장비에서
18
F-FDG 검사를 시행한 폐암 환자 61명(남:47명, 여:14명)을 대상으로 하 였다.18
F-FDG를 2.6MBq/kg 주입하였으며, 1bed당 1분씩 영상을 획득하였다.획득한 PET 영상에서 폐부위의 종양에 VOI를 설정하여 영상 재구성별로 산출되어진 EQ Filter 값을 적용하여 EQ PET 적용 전 후의 SUVmax를 각각 비교분석 하였다.
통계분석으로는 Medcalc 통계분석 프로그램을 이용하였 으며, ANOVA Test와 Bland-altman 통계분석을 실시하 였다.
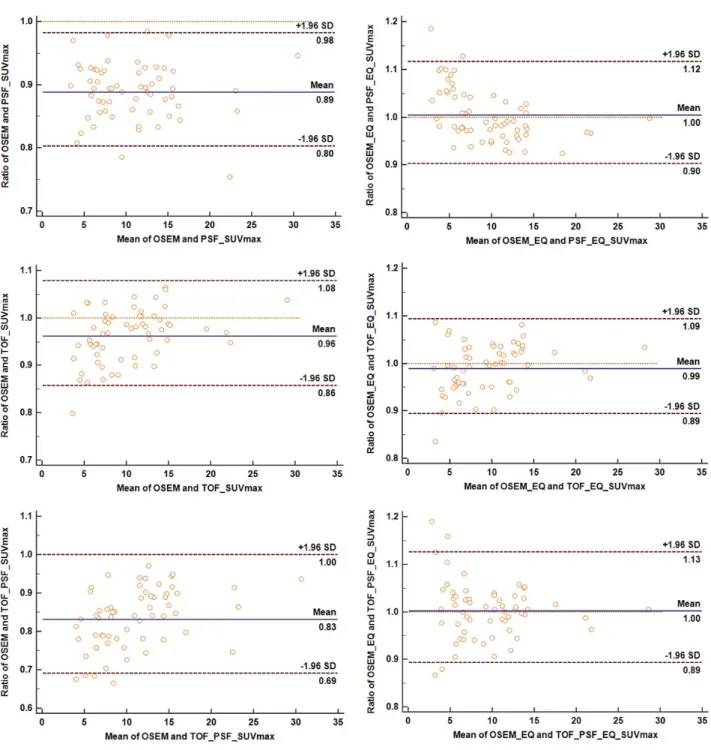
Fig. 10. Graphs show Bland-Altman analyses for ratio of SUVmax before and after applying EQ PET between OSEM and (A) PSF, (B) TOF, (C) PSF+TOF reconstruction.
결 과 1. 팬텀실험
본원의 3대의 PET/CT 장비에서 획득한 NEMA IEC Body phantom의 6개 구의 회복계수의 평균 변동계수는 장
비와 영상재구성에 따라 EQ PET을 적용 전 후의 값은 OSEM3D 영상에서는 0.05에서 0.04, TOF 영상 재구성에 서는 0.04에서 0.03, PSF 영상 재구성에서는 0.04에서 0.03, PSF+TOF 영상 재구성에서는 0.03에서 0.02로 EQ PET을 적용 한 영상에서 NEMA IEC Body phantom의 6 개 구의 회복계수의 평균 변동계수가 감소하였다(Fig. 8).
Fig. 8. This graphs indicate recovery coefficient of each spheres on NEMA IEC body phantom for different PET/CT scanners and reconstruction algorithms. (a) before applying EQ PET, (b) after applying EQ PET.
2. 임상실험
Biograph mCT40 PET/CT장비에서 검사한 61명의 폐 암환자의 FDG PET 영상에서 EQ PET을 적용 전 영상 재구 성을 달리한 종양의 평균 SUVmax는 OSEM3D, TOF, PSF, PSF+TOF순으로 증가하였지만, 통계적으로 유의한 차이는 없었다. (p=0.199) EQ PET을 적용 한 OSEM3D, TOF, PSF, PSF+TOF 영상 재구성에서는 평균 SUVmax 의 높은 일치도를 보였으며 통계적으로도 유의한 차이가 없 었다. (p=1.000) (Fig. 9)
Fig. 9. This graphs show mean values of SUVmax before and after applying EQ PET different reconstruction algorithm in FDG PET images of 61 patients with lung cancer using Biograph mCT 40 PET/CT scanner.
OSEM3D 재구성 영상을 기준으로 PSF 재구성 영상과 SUVmax의 Ratio를 Bland altman 비교결과 EQ PET 적 용 전 Mean값은 0.89, EQ PET 적용 후 1.00, TOF 영상 재구성과의 SUVmax의 Ratio는 EQ PET 적용 전 Mean값 은 0.96, EQ PET 적용 후 0.99, PSF+TOF 영상 재구성과 의 SUVmax의 Ratio는 EQ PET 적용 전 Mean값은 0.83, EQ PET 적용 후 Mean값은 1.00 값을 보여 EQ PET 적용 후 OSEM 3D영상과 각각의 영상 재구성에 대한 SUVmax 차이가 감소하였다(Fig. 10).
결 론
본 연구에서 3대의 PET/CT 장비와 영상 재구성 차이에 따라 발생하는 표준섭취계수의 편차는 EQ PET을 적용 후 팬텀실험에서 구 별로 회복계수의 변동계수가 감소하였으 며, 임상영상에서는 SUVmax의 편차가 감소하였음을 알 수 있었다.
고 찰
PET 영상에서 정량적 평가에 통상적으로 쓰이는 표준섭 취계수는 방사능의 농도를 나타내며, 상대적 섭취 율을 정량 적으로 평가 하여 종양의 병소와 병기의 진단, 그리고 치료 성적 평가에 있어서 사용되고 있는 유용한 지표이다.
하지만 표준섭취계수는 환자의 체격, 검사까지의 시간, 부분용적효과, 관심영역의 설정, 검사장비, 영상의 재구성 방법, 호흡에 따른 위치 변동 등에 따라 변화되므로 다양한 인자의 영향을 고려하여야만 한다.
또한 PET system의 기술이 발전되면서, 검출기의 성능 이 향상되어지고 영상의 질을 높이기 위한 다양한 영상의 재
구성 방법의 알고리즘도 개발되어져 서로 다른 PET/CT 장 비와 영상재구성에 따라 SUV의 차이가 발생되어진다.
6-8)
최근 SIEMENS사에서는 PET/CT 장비와 영상의 재구성 방법의 차이에 의해 발생하는 SUV 차이를 EARL의 NEMA IEC body phantom의 회복계수 값을 기준으로 EQ filter라 는 파라미터 값을 산출하여 SUV의 편차를 줄여줄 수 있는 EQ PET이 소개되었다.
본 연구에서는 본원의 서로 다른 PET/CT 시스템에 EQ PET을 적용 하였을 때 팬텀실험을 통한 회복계수와 임상영 상에서 종양의 SUVmax를 비교평가 하여 검사 장비와 영상 의 재구성방법의 차이에 의해 발생하는 방사능 농도의 차이 를 최소화 시킬 수 있었다.
서로 다른 PET/CT 시스템에 대해 환자의 종양의 병소와 병기의 진단, 그리고 치료 성적 평가함에 있어 지표인 표준섭 취계수의 차이를 EQ PET을 적용하여 최소화 할 수 있으므 로 정량적 평가의 신뢰도가 향상 될 것으로 사료된다.
요 약
양전자 방출 단층촬영에서 정량적 평가에 통상적으로 쓰 이는 표준섭취계수(SUV : Standardized Uptake Value) 는 종양의 병소와 병기의 진단 그리고 치료 성적 평가에 있어 서 사용되고 있는 유용한 지표이다. 하지만 SUV는 환자의 체격, 검사까지의 시간, 부분용적 효과, 관심영역의 설정, 검 사장비, 영상재구성 차이 등에 따라 변화 되므로 다양한 인자 의 영향을 고려하여야만 한다.
그 중에서도 PET/CT 장비와 영상의 재구성 방법의 차이 에 의한 SUV의 차이를 SIEMENS 사의 EQ PET을 이용하 여 방사능의 차이를 보정 할 수 있게 되었다.
그러므로 본 연구에서는 phantom 실험과 FDG PET 임 상영상의 SUVmax를 비교 하여 EQ PET을 적용함으로써, SUV의 변화를 평가 하고 EQ PET의 유용성에 대해서 검증 해보고자 하였다.
본원의 3대의 PET/CT 장비인 Biograph true point 40, Biograph mCT 40, Biograph mCT 64 장비를 이용하여
18
F-FDG를 주입 한 NEMA IEC body phantom 영상을 획 득 한 후 OSEM3D+PSF, OSEM3D+TOF, OSEM3D+PSF+TOF의 알고리즘을 이용하여 영상을 재구성 하였다.
각각 재구성된 영상에서 관심영역의 방사능 농도를 측정한 후, EARL에서 권고하는 NEMA IEC body phantom의 방 사능 농도의 회복계수 값을 비교하여 서로 다른 PET system 간에 방사능 농도의 차이를 줄일 수 있는 EQ filter
값을 산출 하였다.
산출한 EQ Filter 값을 장비와 영상 재구성에 따라 적용하 여 팬텀의 회복계수와 61명의 폐암환자의 FDG PET 영상에 서 종양의 SUVmax를 비교 분석 하였다.
3대의 PET/CT 장비에서 영상의 재구성 알고리즘을 달리 하여 획득한 phantom의 영상의 6개구의 평균 변동계수는 EQ PET 적용 전 후의 값은 OSEM3D 재구성 영상에서 각각 0.05, 0.04 OSEM3D+TOF 재구성 영상에서는 각각 0.04, 0.03, OSEM3D+PSF 재구성 영상에서는 각각 0.04, 0.03, OSEM3D+PSF+TOF 재구성 영상에서는 각각 0.03, 0.02 값을 보여 EQ PET 적용 후 팬텀의 6개 구의 평 균 변동계수는 감소하였다.
임상 영상 비교 에서는 폐암환자 종양의 SUVmax는 OSEM3D, OSEM3D+TOF, OSEM3D+PSF, OSEM3D+
PSF+TOF 순으로 증가하였으며, EQ PET 적용 후 재구성 영상에 대한 SUVmax는 통계적으로 유의한 차이가 없었다 (p=1.000).
PET/CT 영상에서 서로 다른 PET/CT 장비와 영상의 재 구성 방법의 차이에 의해 발생하는 방사능 농도의 차이를 EQ PET을 이용하여 측정함으로서 장비와 영상 재구성별 방사능 농도의 편차가 감소되었다. PET 영상에서 정량적 평 가에 이용되는 SUV의 편차를 줄일 수 있어 종양의 병소와 병 기의 진단, 그리고 치료 성적평가의 정량적 평가 신뢰도가 향 상 될 것으로 사료된다.
REFERENCES
1. 고창순, 고창순 핵의학, 고려의학 2008. P106
2. Boellaard R, O’Doherty MJ, Weber WA, et al. FDG PET and PET/CT: EANM procedure guidelines for tumor PET imaging: version 1.0.
Eur J Nucl Med
2010;37:181.3. Delbeke D, Coleman RE, Guiberteau MJ, Brown ML, Royal HD, Siegel BA, et al. Pocedure guideline for tumor imaging with 18F-FDG PET/CT 1.0.
J Nucl Med.
2006;47:885-95.4. European Association of Nuclear Medicine. EARL FDG-PET/CT accreditation. 2015. Accessed12-1- 2-15.
5. Matthew Kelly EQ․PET: Achieving NEMA- referenced SUV Across Technologies. 2014. SIEMENS Healthcare White paper
6. Matthew D kelly, Siemens Medical Solutions, Inc, et al. White Paper: EQ PET: SUV Harmonization Across Technologies
7. Matthew D kelly, Jerome M Declerck: SUVref:
reducing reconstruction dependent variation in PET SUV.
EJNMMI Research
2011;1:16.8. Go Akamatsu, Hiroyuki Nishida, Akira Fujino, Akihito Ohnishi, Yasuhiko Ikari, Tomoyuki Nishio, Akira Maebatake, Masayuki Sasaki, Michio Senda:
Harmonization of Standardized Uptake Value among different Generation PET/CT Cameras Based on Phantom Experiment Utility of SUVpeak.