1) Division of Geotechnical Engineering, Water Resources University, Department of Construction and Disaster Prevention Engineering, Kyungpook National University
2) Division of Geotechnical Engineering, Water Resources University
Effect of Extreme Rainfall on Cut Slope Stability:
Case Study in Yen Bai City, Viet Nam
Tran The Viet1)・ Trinh Minh Thu2)・ Giha Lee†・ Sewook Oh3)・ Nguyen Thi Hai Van4) Received: December 30th, 2014; Revised: January 22nd, 2015; Accepted: March 3rd, 2015
ABSTRACT : This paper addresses the effects of extreme rainfall on the stability of cut slopes in Yen Bai city, Northern Viet Nam.
In this area, natural slopes are excavated to create places for infrastructures and buildings. Cut slopes are usually made without proper site investigations; the design is mostly based on experience. In recent years, many slope failures have occurred along these cuts especially in rainy seasons, resulting in properties damaged and loss of lives. To explain the reason that slope failure often happens during rainy seasons, this research analyzed the influence of extreme rainfalls, initial ground conditions, and soil permeability on the changes of pore water pressure within the typical slope, thereafter determining the impact of these changes on the slope stability factor of safety. The extreme rainfalls were selected based on all of the rainfalls triggering landslide events that have occurred over the period from 1960 to 2009. The factor of safety (FS) was calculated using Bishop’s simplified method. The results show that when the maximum infiltration capacity of the slope top soil is less than the rainfall intensity, slope failures may occur 14 hours after the rain starts. And when this happens, the rainfall duration is the deciding factor that affects the slope FS values. In short, cut slopes in Yen Bai may be stable in normal conditions after the excavation, but under the influence of tropical rain storms, their stability is always questionable.
Keywords : Cut slope, Negative pore water pressure, Failure, Shear strength, Factor of safety, Critical rainfall, Landslide, Infiltration Journal of the Korean Geo-Environmental Society
16(4): 23~32. (April, 2015) http://www.kges.or.kr
ISSN 1598-0820 DOI http://dx.doi.org/10.14481/jkges.2015.16.4.23
1. Introduction
Landslides constitute a major threat to both lives and property worldwide, especially in regions of residual soil subjected to heavy rainfall (Collins et al., 2004). In the last few years, many damages due to slope instability have been recorded in Yen Bai city Northern Viet Nam. A failure of cut-slopes killed four members of one family in 2005, four people of three families in 2006, and one person in 2010. Many houses collapsed or were badly damaged by slope failures in those years. Experiences in Yen Bai city show that most recorded instances of slope failures occurred in the top soil layers where the soils had been totally weathered. The individual failures were usually in small volumes, ranging from 50 m3 to 500 m3, although in some cases exceeding 1,000 m3. As a result, the total damage and loss of lives due to all of the slope failures every year throughout the entire city are considerably high. The occurrence of landslides in residual soil slopes is attributed to many factors. Rainfall has been considered to
be one of the main causes of the majority of landslides that occur in regions experiencing high seasonal rainfall (Brand, 1981).
Many investigations on the engineering aspects of cut slopes have been done before, after, or during construction, but they require a great amount of intensive work, which is often complicated, costly, and time consuming (Rupke et al., 2007).
Some researchers have investigated the effect of rainfall on slope stability. However, there has been some debate as to the relative roles of the antecedent and the triggering rainfall.
Experience from different regions has resulted in different conclusions as to the significance of antecedent rainfall for slope instability (Rahardjo et al., 2007). Therefore, researching the mechanism of rainfall-induced slope instability plays an important role in reality, especially for the study area, where many slope failures have occurred and are going to occur in the future as a result of extreme rainfalls.
In this paper, the mechanism of rainfall-induced slope failures in residual soils slope is addressed with special
Yen Bai city
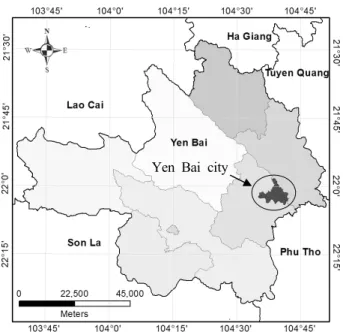
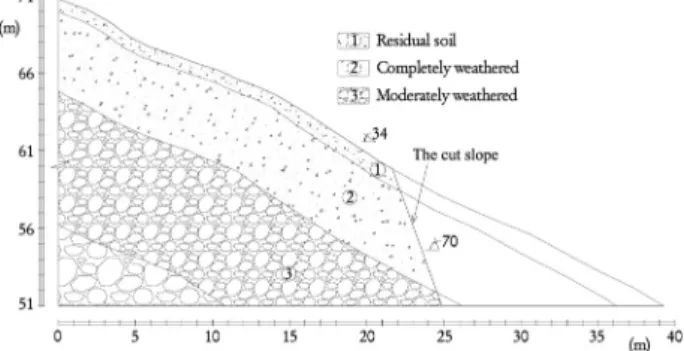
Fig. 1. The geographical location of Yen Bai city (Source: Viet, 2011) Fig. 2. The typical soil profile in Yen Bai city (Source: Viet, 2011) consideration to Yen Bai’s climatic and geological conditions.
For this purpose, a transient seepage analysis under the influence of extreme rainfalls was first built from the initial steady seepage condition, and then the achieved PWPs were used as an input parameter for simulating the slope FS. The expected result would be the relationship between the changing of the FS over time during the selected extreme rainstorms.
2. The study area
2.1 Yen Bai city
Yen Bai city is located at the transition between the north- western and the north-eastern highlands of Vietnam (Fig. 1).
This area lies within the tropics; therefore it is prone to a wide range of natural hazards, including landslides and slope instability, which are mostly triggered by heavy rainfall. The weather is characterized by a tropical monsoon climate with high humidity (annual average of 87%) and high rainfall (average annual of 1,755.8 mm). 80% to 85% of the precipi- tation falls in the monsoon period, which is from June to August. The topography of Yen Bai city is composed of bowl - up - shaped hills and low mountains with gentle, natural slopes. Approximately 85% of the area has slopes less than 310 and altitude ranges from 29 m~90 m above sea level. This study was conducted in the most densely populated parts of the city that occupy about 20% of the total area and contain approximately 70% of the total population.
2.2 Typical soil profile in Yen Bai city
Yen Bai city is characterized by a hilly topography formed by tropical residual soils. The research site is dominated by rocks in Ngoi Chi formation and is currently under the influence of a tropical climate; as a result, residual soils that exist in unsaturated conditions have been formed. The field surveys in the study area shown that the weathering productions of rocks in Yen Bai city have a high clay content, in which the predominant minerals are kaolinite and crystalline Fe and Al oxides, such as goethite, hematite, and gibbsite. Thus, the soil masses in this area are loose, crumbly, and easily eroded and susceptible to landslides when the slopes are saturated.
Based on the characteristics of the residual soil that is dominant in the study area and the descriptive scheme for grading the degree of weathering (McLean & Gribble, 1985). Also, according to the results of the field survey, while digging up the soil for sampling, the typical soil profile for the research site could be drawn as in Fig. 2.
2.3 Typical slope cross-section
From the results in the field observation and site investigation, combining with the typical soil profile as shown in Fig. 2, the typical slope cross-section for the whole area could be illustrated as in Fig. 3.
Based the fact that most cut slope failures recorded in this area have typically occurred on residual and completely weathered soil layers, the moderately weathered layer could be considered as a stable bedding layer. Therefore, the material properties required for slope stability assessment would be in the first
Fig. 3. Typical cross-section of cut slopes in Yen Bai city
Fig. 4. The average daily rainfall in 12 months of year from 1960 to 2009 in Yen Bai
Table 1. Some main properties for slope stability calculation in the study area
Testing categories Symbol Unit Layer 1 Layer 2 Moisture unit weight kN/m3 16.95 17.00 Saturated unit weight kN/m3 17.58 17.66 Effective internal friction ′ Degree 18.29 24.36
Effective cohesion c’ kN/m2 20.20 18.50
Hydraulic conductivity k cm/s 9.59×10⁻⁶ 3.0×10⁻⁵
Table 2. Results of soil water characteristic tests
Suction level (kPa)
Layer 1 Layer 2
Volumetric water content Volumetric water content
(1) (2) (1) (2)
0.0 0.50 0.49 0.47 0.45
20.0 0.44 0.43 0.43 0.40
50.0 0.42 0.42 0.41 0.38
100.0 0.41 0.40 0.37 0.37
200.0 0.40 0.40 0.36 0.35
and second layers. All of the soil properties were taken from the laboratory testing results in 2010. For each parameter, three tests were conducted under identical conditions, and their average values are summarized in Table 1. The angle of (angle indicating the rate of change in shear strength relative to changes in matric suction) was assumed to be ½ of the value of ′ for practical purpose (Fredlund & Rahardjo, 1993;
Krahn, 2004). The value of decreases with the increase in the value of suction. However, for simplicity and the small suction range considered in the stability analyses, a constant
value was assumed (Ng & Shi, 1998; Krahn, 2004).
This parameter is explained in more detailed in equation 1, Section 3.2.
For the property of the unsaturated soil, tests to determine the soil-water characteristic curve (SWCC) were also performed.
SWCC is typically the desaturation or moisture retention curve, and it is a continuous sigmoidal function representing the water storage capacity of a soil as it is subjected to increase soil suction (Fredlund et al., 1996), which means how much equilibrium water a soil can take at a given suction originally. Simply, SWCC indicates the water storage capacity of soil at various matric suction levels. The tests to define SWCC were conducted under the standard test methods for
the determination of SWCC. In order to have more reliable results, for each suction level, two soil samples in each soil layer were tested under the same conditions. During the test, saturated undisturbed soil samples were put into a pressure chamber, and then various levels of suction were applied.
For each level, after the equilibrium state was reached, a value of volumetric water content was calculated based on the weight of the sample. The relationship between the soil volumetric water contents versus the suction values is the SWCC. In this research, five different suctions were applied to draw the SWCC, the testing results of the two soil layers are illustrated in Table 2. This data is used as the input soil parameters in the SEEP/W model in seepage analyses in the next paragraph.
2.4 Rainfall conditions
2.4.1 The average daily rainfall
Rainy season often starts from May and lasts until October annually. This city receives an average from 1.500 mm to 2.200 mm of annual rainfall with the maximum daily rainfall of 349 mm (Sep. 6th, 1973). Fig. 4 shows the average daily rainfall over the 12 months of a year from 1960 to 2009 in Yen Bai.
2.4.2 Extreme rainfall in Yen Bai
Extreme rainfall is the rain which leads to a large number
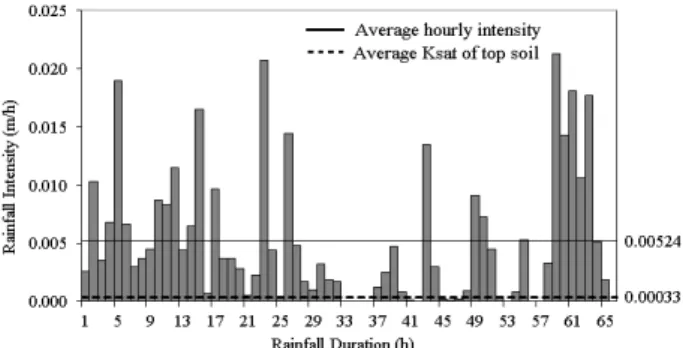
Fig. 5. The Duration & Intensity of Aug, 2006 rainfall Fig. 6. The Duration & Intensity of Aug, 2008 rainfall of landslides or severe damage from slope failure. A number
of studies had been undertaken to determine rainfall thresholds based on historical rainfall data (Aleotti, 2004; Yuan et al., 2005; Matsushi & Matsukara, 2007). According to Mein &
Larson (1973), when rainfall intensity is less than the minimum infiltration capacity, all rainfall can infiltrate into the soil.
When rainfall intensity is greater than the minimum infiltration capacity but does not exceed the soil infiltration capacity during the early stages of infiltration, all of the rainfall also percolates into the soil. However, when the infiltration capacity becomes less than the rainfall intensity, ponding occurs, and the amount of water that exceeds the infiltration capacity disappears as runoff (Lee & Cho, 2001). Therefore, it is evident that critical rainfall should be the one that has a long duration with an intensity that is larger than the top soil coefficient of permeability. Because during a rainfall, the intensity is not uniform all of the time, even short rainfalls, when they meet the above requirements and happen really close to each other, can also have the same effects as a long one. Thus, finding a suitable critical rainfall is not an easy task. In this study, the method was to base on the analysis of historical rainfall data throughout the period of 1960~
2009 and its corresponding slope failures in the study area and the neighbouring regions to find the appropriate events.
Based on that analysis, two rainfalls were selected. The first one happened on August 16th, 2006, which was a rainfall with high intensity that lasted continuously for three days.
This rainfall was followed by the failure of many cut-slopes, which mostly occurred along the main roads around the city.
Three people who lived in the Yen Ninh ward were killed, and many houses were damaged due to this event. The second one happened in August, 2008, and this event had a smaller average intensity but more or less the same duration. Also, this event caused massive damage to properties. The intensity
and duration of these two rainfalls are shown in Figs. 5 and 6.
3. Background of the rainfall-induced slope failures
3.1 Mechanisms of change in pore water pressure in unsaturated soils during rainfall
Many researchers have studied the effects of rainfall on slope instability. Traditionally, most previous investigations on the mechanisms of rainfall-induced slope were based largely on tests on saturated materials (Anderson et al., 1995; Chen et al., 2004). In addition, geotechnical engineers have often rationalized that negative pore water pressure (PWP) should be ignored because they cannot be relied upon in the long term. In other words, it is envisaged that a heavy rainfall will result in the elimination of all of the negative PWPs (Fredlund, 1995). For elongated slopes, it is often assumed that the groundwater table is parallel to the slope surface and that is simply rises to reduce the stability of the slope (Craig, 2004). However, in some cases, this is not realistic, as it depends on the infiltration characteristics of the soil that has perched water zones near the surface of the slope (with an unsaturated profile below) and would, thus, not be properly analyzed using traditional approaches (Collins et al., 2004).
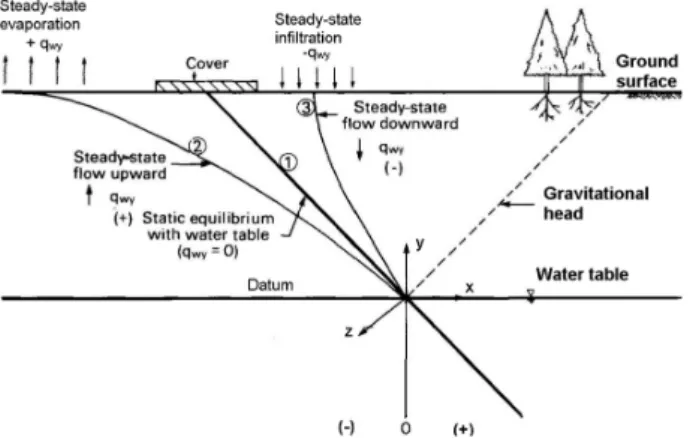
Fig. 7 shows the PWP changes on an unsaturated zone under static, evaporation, and rainfall conditions. The pore water pressure is normally negative under static equilibrium conditions with respect to the water table. According to an analysis of Huong & Thu (2013), the negative PWP head has a linear distribution with depth (line 1). Therefore, there can be no flow of water in the vertical condition. If the cover were removed from the ground surface, the soil surface would be exposed to the air. For that reason, water in soils can flow
Fig. 7. Cross-section of the PWP distribution in unsaturated zone (Fredlund & Rahardjo, 1993)
out from the soil, which would then cause the PWP to become more negative (e.g., PWP head line move to the left [line 2]). The maximum change in PWP will be at the near ground surface. The more evaporation time and the greater the intensity of the evaporation, the more negative the PWP will be. In other words, the PWP head line will be moved to the left.
Steady-state infiltration causes a downward water flow. The negative PWP then increases from the static equilibrium condition.
Thus, the PWP head line will move to the right (line 3). The unsaturated zone will be getting smaller. As a result, the shear strength is decreased, and the FS is decreased. The landslide usually occurs on the residual soil layer in the mountain area. Therefore, the volume and depth of the landslide depends very much on the thickness of the residual soil and weathered rock layer.
3.2 Shear strength of unsaturated soil
Many geotechnical problems, such as bearing capacity, lateral earth pressures, and slope stability, are related to the shear strength of the soil (Fredlund & Rahardjo, 1993). Holtz &
Kovacs (1981) defined the shear strength of a soil as the ultimate or maximum shear stress that the soil can withstand.
In unsaturated soil, Fredlund et al. (1978) proposed a shear strength equation using two independent stress state variables (i.e., net normal stress, and matric suction, ) as in equation (1):
′ ′ (1)
where:
is - shear stress on the failure plane at the failure; ′
is the - intercept of the “extended” Mohr-Coulomb failure envelope on the shear stress axis when the net normal stress and the matric suction at the failure are equal to zero;
is the - net normal stress on the failure plane at the failure; uaf is - the pore air pressure on the failure plane at the failure; is the - total normal stress on the failure plane at the failure; ′ is - the angle of internal friction associated with the net normal stress state variable, ; (ua - uw)f - is the matric suction on the failure plane at the failure; uwf is - the pore water pressure on the failure plane at failure, and is the angle indicating the rate of change in shear strength relative to the changes in the matric suction,
.
Equation (1) can be considered an extension of the shear strength equation for a saturated soil. For an unsaturated soil uw is smaller than ua.
′ (2)
where: ′
At saturation, uw approaches ua, causing matric suction to approach zero (i.e., ). At saturation condition (i.e.,
= 0), equation (2) reduces to the familiar shear strength of a saturated soil as follows:
′ ′ (3)
4. Rainfall induced slope instability analysis
4.1 Analysis of the changes in pore water pressure
The influence of rainfall is assessed through the changes in the pore water pressure distribution within the slope. For the analysis of the stability of the cut slopes, a deterministic slope stability model was used by integrating the two modules SEEP/W and SLOPE/W in the GEOSTUDIO 2004 software.
Three steps were carried out to assess the slope stability: 1) module SEEP/W was used to simulate the pore water pressures (both in static and transient conditions); 2) module SLOPE/W was then employed to find the critical slip surface and the factor of safety (FS) under the transient PWP condition calculated
(a) (b)
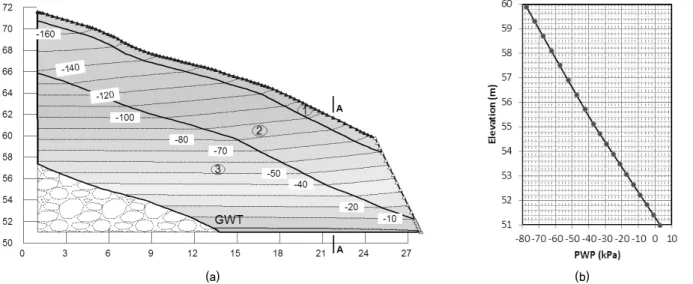
Fig. 8. (a) Distribution of PWP in normal conditions (without rainfall); (b) Distribution of PWP with depth through A - A section by SEEP/W in step 1. For the stability analysis, Bishop’s
simplified method was used. This method of slices satisfies the moment equilibrium, and it is applied to circular failure surfaces (Cheng & Lau, 2008).
For the transient seepage simulation, two sub-steps were applied: 1) the initial PWP condition was selected from several simulations that were created by running the steady-state seepage model with some small quantities of rainfall which were assigned as the flux boundary on the surface of the slope. The chosen model was the one that fit the observed PWP in the field. Figs. 8(a) and 8(b) provide the results for the steady-state seepage calculation.
Fig. 8(a) indicates the distribution of PWP within the study slope during normal conditions (i.e., before the extreme rainfall).
As shown in Fig. 8(a), the ground water table (GWT) is located quite low under the slope surface; this closely reflects the reality as the residual soil profile is typically dry with deep ground water levels (Huat et al., 2009). Basically, the driest part (i.e., the slope surface) has the highest matric suction (i.e., the smallest negative PWP) (Fig. 8(b)). 2) In the following sub-step, the steady-state model calculated above would be used as the initial condition to build the transient seepage models due to the selected 2006 and 2008 critical rainfall events. The transient analysis, by definition, is the one that is always changing. It is changing because it considers how long the soil takes to respond to the user’s boundary conditions (Krahn, 2004). The process of infiltration into the ground can be predicted from a transient seepage analysis, or from equations and numerical models (Cho & Lee, 2001).
During the analysis, evaporation and evapotranspiration are not taken into account. The applied boundary flux, q, is reviewed by elevation in order to avoid ponding. The net flux, Q, is assigned to be zero along the sides of the slope above the groundwater table. The results of the transient seepage calculation for the critical rainstorms that happened in 2006 and 2008 simulated by Geostudio are as illustrated in Figs. 9(a), 9(b), 10(a), and 10(b).
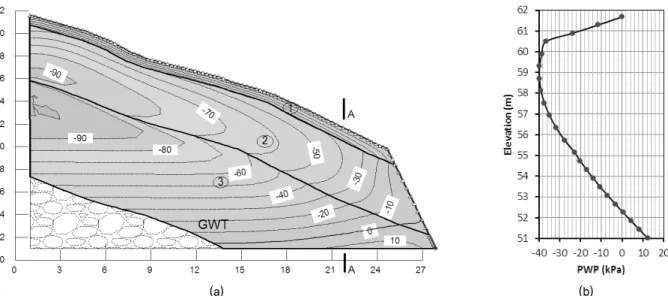
From Fig. 9(a) to Fig. 10(b), it is clear that there is a redistribution of the pore water pressure as a result of the selected extreme-rainstorm events. The slope surface becomes saturated as the value of PWP on the top reaches zero and reduces with depth. The ground water table rises about 1 m in comparison with the initial situation. The distribution of PWP with depth through an arbitrary section (Section A-A) is as illustrated in Figs. 9(b) and 10(b). Fig. 11 is the distribution of PWP versus time during the 2006 rainstorm event through the A-A section after every two hours. As can be seen except from the point on the slope surface, the negative PWP tends to increase over time. This trend is illustrated more clearly in Figs. 12 and 13 below.
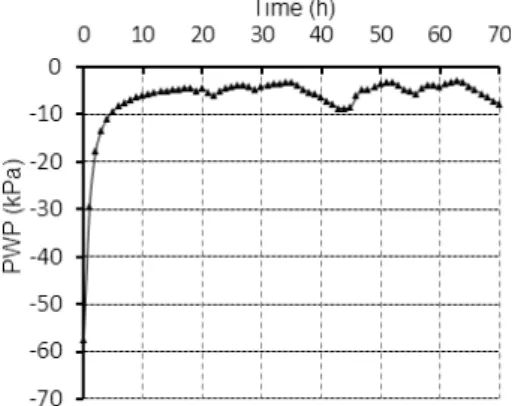
Figs. 12 and 13 show the changing of the PWP at a point located about 0.4 m below the slope surface with time.
There, the time is shown, indicating the whole rainstorm duration. Both graphs demonstrate a fluctuation of PWP with time, depending on the rainfall intensity. However, the fastest increase in PWP was seen during the first five hours after the rain began.
From the critical rainfall data in Figs. 5 and 6, there are
(a) (b)
Fig. 9. (a) Distribution of PWP after 60h of the rainstorm 2006 event simulated by SEEP/W; (b) Distribution of PWP along the A - A section
(a) (b)
Fig. 10. (a) Distribution of PWP after 60h of the rainstorm 2008 event simulated by SEEP/W; (b) Distribution of PWP along the A - A section
Fig. 11. Distribution of PWP versus time during the 2006 rainstorm event through A - A section
Fig. 12. PWP with time during the 2006 rainstorm
not many differences between the two critical rain events:
they have, more or less, the same duration and a much higher intensity compared to the hydraulic conductivity of the top
soil. This explains why there are not many differences between the PWP distribution within the study slope during the 2006 and 2008 rainfalls.
Fig. 13. PWP with time during the 2008 rainstorm
Table 3. Significance of factor of safety (FS) for design (Liu & Evett, 2005)
Factor of safety (FS) Significance
Less than 1.0 Failure
1.00~1.20 Questionable safety
1.30~1.40 Satisfactory for cuts, fills, questionable for dams
1.50~1.75 Safe for dams
4.2 Slope stability analysis
Calculated pore water pressures are used as the input of ground water conditions for subsequent limit equilibrium analysis (Ng & Shi, 1998). The factor of safety is obtained using the modified Mohr-Coulomb failure criterion to take account of the contribution of the matric suction to shear strength (Lee & Cho, 2001). The mechanism of failure is that water infiltration causes a reduction of the matric suction in the unsaturated soil, resulting in a decrease in the effective stress reflected in a decrease in the soil shear strength, to the point where equilibrium can no longer be sustained in the slope (Hossain, 2010). The pore water pressures and suction predicted from the transient seepage models are adopted as input parameters to the SLOPE/W module for the analyses of slope stability at different times during the rainfall periods. The general equation to calculate the factor of safety, FS, based on Bishop’s simplified method is written as follows (Fredlund & Rahardjo, 1993):
′
′
′
′(4)
where:
FS is factor of safety with respect to moment equilibrium;
′ is effective cohesion; is sloping distance across the base of a slice; R is the radius for a circular slip surface or the moment arm associated with the mobilized shear force, Sm
for any shape of slip surface; N is the total normal force on the base of the slice; ′ is the effective angle of internal
friction; is the angle indicating the rate of increase in shear strength relative to the matric suction; uw is pore water pressure; ua is pore air pressure; A is the resultant of external water force; a is the perpendicular distance from the resultant of the external water force to the center of rotation or to the center of moments; W is the total weight of the slice of width
“b” and height “h”; and f is the perpendicular offset of the normal force from the center of rotation or from the center of the moment.
In the analysis of slope stability, it is essential for an engineer to provide a reasonable FS, which shows not only the reliability but also the economic conditions. From this point of view, Liu & Evett (2005) suggested a table that shows significant values of FS for slope design (Table 3)
The soil properties utilized in the slope stability analyses are presented in Table 1. The factors of safety for the study slope were calculated based on the most extreme PWP conditions, which were the results of the transient seepage state. The stability calculation during the rainfalls of 2006 and 2008 were conducted by module SLOPE/W every one hour right after the rain started. The results are presented in Figs. 14 and 15.
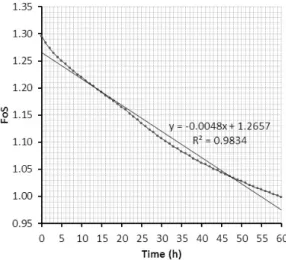
Figs. 14 and 15 show the factor of safety obtained from the slope stability analysis with time during infiltration corresponding to the rainfall events of 2006 and 2008. The factor of safety in both cases was 1.296 before rainfall, and it decreased with time as the rain-water infiltrated into the slope. Then, it reduced gradually, and after 60 hours of rainfall, the factor of safety was 0.999 and 0.998, respectively, indicating that failure could have occurred. In addition, if the assessment was done using Table 3, the safety of the study’s cut-slope would be under question just after about 14 hours in both rainstorm events. This explains why many slope failures occurred during and after these two rainfall events.
Fig. 14. The relationship between FS and rainfall duration in the 2006 rainstorm
Fig. 15. The relationship between FS and rainfall duration in the 2008 rainstorm
5. Conclusion and recommendations
In this study, the reduction of the slope stability factor of safety over time during extreme rainfalls in Yen Bai was examined by means of numerical tools. The analysis process could be divided into three major steps. In the first step, some steady-state seepage models were built by different small values of infiltration on the slope surface. Then, the suitable model would be selected by comparing them with the observed field data on the PWP. In the next step, transient seepage models would be created using the achieved steady- state seepage model and the selected extreme rainfall events in the study area. The factor of safety changing with time during the rain would be calculated in the final step. The following conclusions were deduced from the results of the
analysis:
(1) Rainfalls have considerable influence on the stability of the slope. The antecedent rainfall prior to the storm events has decreased the matric suction in the slope, causing the coefficient of the permeability of the soil to increase, making the soil more permeable to infiltration. The increase in PWP effectively reduces the soil shear strength and makes the slope become more susceptible to failure. The study shows that the factor of safety decreases as the duration of rainfall increases, until a critical duration is reached.
(2) Figs. 9(a) to 10(b) indicate that the negative PWP near the slope surface is most affected by rainfall. When it comes to greater depth, the change in the negative PWP decreases.
(3) The results from this study can provide a basic explanation of the landslide that occurred as a result of the rainfall.
Also, it can be used as a procedure for the design and construction of cut slopes for the prevention and mitigation of the landslide due to rainfall. Because both rainstorms’
level of intensity were larger than the hydraulic conductivity of the top soil layer, the intensity of the event that happened in 2006 was twice as large as the one in 2008, but they had more or less the same duration. One conclusion that could be drawn from this section is that when the intensity of the rain is higher than the top soil hydraulic conductivity, the rainfall duration is the deciding factor that affects the slope factor of safety.
(4) The couple between SEEP/W and SLOPE/W for the simulation of change in the factor of safety during rainfall was conducted. The results of this study show a close relationship with the reality when a large number of landslides have been recorded right after the two selected rainfall events. In this study, in the 60th hour during the extreme rainstorm, the FS in both cases were smaller than one indicating that failure could have occurred and just after 14 hours of continuously raining; thus the FS of the slope is under question. This explains the reason that many slope failures occurred during and after these two rainfall events.
(5) The cut slopes with the experiment’s slope angle in Yen Bai might be stable under normal conditions, but the stability would become very sensitive when the rain comes.
Thus, more studies should be conducted in the future to create precise early-warning graphs illustrating rainfall- induced cut slope failure in Yen Bai in the future.
Acknowledgement
This subject is supported by Korea Ministry of Environment (MOE) as “GAIA Program-2014000 540005”.
References
1. Aleotti, P. (2004), A warning system for rainfall - induced shallow failures, Engineering Geology, Vol. 73, No. 3, pp.
247~265.
2. Anderson, S. A., Sitar, N. and ASCE, M. (1995), Analysis of rainfall induced debris flows, Journal of Geotechnical Engineering, Vol. 121, No. 7, pp. 544~522.
3. Brand, E. W. (1981), Some thoughts on rain - induced slope failures. Proc. 10th Int. Conf. Soil Mech. Found. Eng., Stockholm, pp. 373~376.
4. Chen, H., Lee, C. H. and Law, K. T. (2004), Causative mechanisms of rainfall-induced fill slope, Journal of geotechnical and geo- environmental engineering, Vol. 130, No. 6, pp. 593~602.
5. Cheng, Y. M. and Lau, C. K. (2008), Slope stability analysis and stabilization: New methods and insight. New York, Taylor
& Francis, p. 16.
6. Cho, S. E. and Lee, S. R. (2001), Instability of unsaturated soil slopes due to infiltration, Computer and Geotechnics, Vol.
28, No. 3, pp. 185~208.
7. Collins, B. D., Znidarcic, D., ASCE, S. M. and ASCE, M.
(2004), Stability analyses of rainfall induced landslides, Journal of geotechnical and geoenvironmental engineering, Vol. 130, No. 4, pp. 362~373.
8. Craig, R. F. (2004), Craig’s soil mechanics. London, Chapman
& Hall, p. 348.
9. Fredlund, D. G. (1995), The stability of slopes with negative pore-water pressures. Ian Boyd Donald Symposium on Modern Developments in Geomechanics, Melbourne, Monash University, pp. 99~116.
10. Fredlund, D. G., Morgenstern, N. R. and Widger, R. A. (1978), The Shear strength of unsaturated soils, Canadian Geotech Journal, Vol. 15, No. 3, pp. 313~321.
11. Fredlund, D. G. and Rahardjo, H. (1993), An overview of unsaturated soil behavior, Proceeding of ASCE Convention, Dallas, Geotechnical Special Publication, Vol. 39, pp. 1~31.
12. Fredlund, M. D., Fredlund, D. G., Wilson, G. W. and Sillers, W.
S. (1996), Design of a knowledge - based system for unsaturated soil properties. The Canadian Conference on Computing in Civil and Building Engineering. Montreal, Quebec, pp. 659~677.
13. Holtz, R. D. and Kovacs, W. D. (1981), An introduction to geotechnical engineering. New Jersey, Prentice Hall, p. 490.
14. Hossain, M. K. (2010), Effect of rainfall on matric suction and stability of a residual granite soil slope, DUET Journal, Vol. 1, No. 1, pp. 37~41.
15. Huat, B. B. K., Sew, G. S. and Ali, F. H. (2009), Tropical residual soils engineering. London, YK, Taylors & Francis Group plc, p. 73.
16. Huong, N. T. N. and Thu, T. M. (2013), Application of unsaturated soil properties in slope stability analysis for Sat river earth-fill dam.Geotechnics for Sustainable Development- Geotech Hanoi 2013, Hanoi, pp. 593~600.
17. Krahn, J. (2004), Stability modeling with SLOPE/W - An engineering methodology. Alberta, Canada, GEO-SLOPE/W International Ltd, p. 374.
18. Lee, S. R. and Cho, S. E. (2001), Instability of unsaturated soil slopes due to infiltration, Computers and Geotechnics, Vol.
28, No. 3, pp. 185~208.
19. Liu, C. and Evett, J. B. (2005), Soils and Foundation. Singapore:
Prentice - Hall, p. 432.
20. Matsushi, Y. and Matsukara, Y. (2007), Rainfall thresholds for shallow landsliding derived from pressure- head monitoring:
cases with permeable and impermeable bedrocks in Boso Peninsula, Japan, Earth Surface Processes & Landforms, Vol.
32, No. 9, pp. 1308~1322.
21. McLean, A. C. and Gribble, C. D. (1985), Geology for civil engineers. University of Glasgow, Taylor & Francis, p. 70.
22. Mein, R. G. and Larson, C. L. (1973), Modelling infiltration during a steady rain, Water Resources Research, Vol. 9, No.
2, pp. 384~396.
23. Ng, C. W. W. and Shi, Q. (1998), A numerical investigation of the stability of unsaturated soil slopes subjected to transient seepage, Elsevier Science Ltd, Vol. 22, No. 1, pp. 1~28.
24. Rahardjo, H., Ong, T. H., Rezaur, R. B. and Leong, E. C.
(2007), Factors controlling instability of homogenous soil slopes under rainfall, Journal of Geotechnical and Geoenvironmental Engineer, Vol. 133, No. 12, pp. 1532~1543.
25. Rupke, J., Huisman, M. and Kruse, H. M. G. (2007), Stability of man - made slopes, Eng Geology, Vol. 91, No. 1, pp.
16~24.
26. Viet, T. T. (2011), Stability assessment of man - made slopes, a case study in Yen Bai. Faculty of Geo-Information Science and Earth Observation, University of Twente, Enschede, The Netherlands, Master Thesis, pp. 1~69.
27. Yuan, C. C., Chien, C. T., Chieh, Y. F., Hui, Y. W. and Chieh, T. C. (2005), Rainfall duration and debris - flow initiated studies for real - time monitoring, Environ Geol, Vol. 47, No. 5, pp.
715~724.