• 검색 결과가 없습니다.

What Kinds of Lands Have Been Converted into the Urban Uses?: the Characteristics of Urban Land Development in the Case of Daegu Region

N/A
N/A
Protected

Academic year: 2021

Share "What Kinds of Lands Have Been Converted into the Urban Uses?: the Characteristics of Urban Land Development in the Case of Daegu Region"

Copied!
6
0
0

로드 중.... (전체 텍스트 보기)

전체 글

(1)

What Kinds of Lands Have Been Converted into the Urban Uses?: the Characteristics of Urban Land Development in the Case of Daegu Region

Jae Ik Kim

1

(Received March 30, 2012 / Revised April 18, 2012 / Accepted April 26, 2012)

ABSTRACT

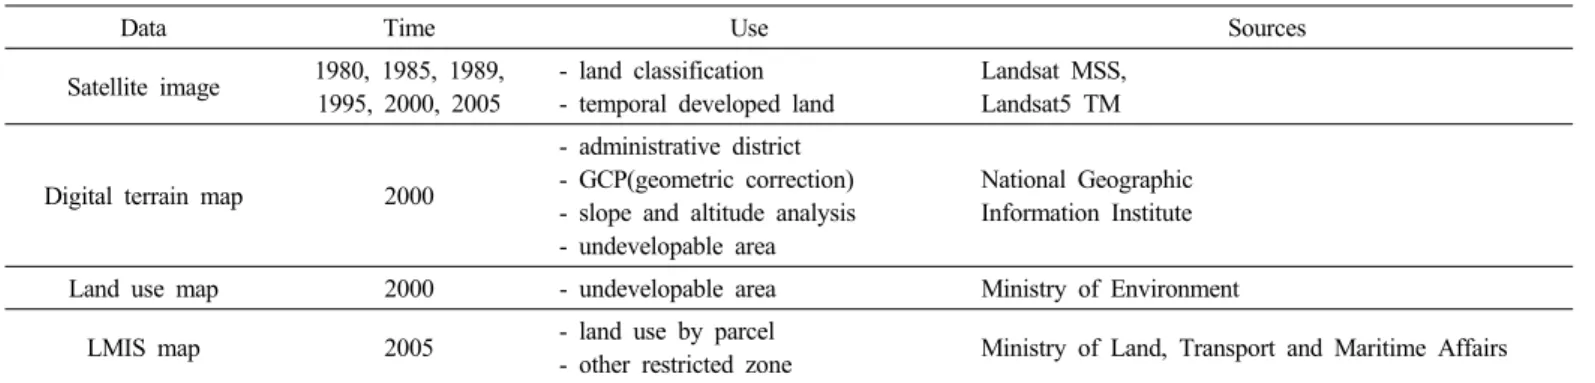
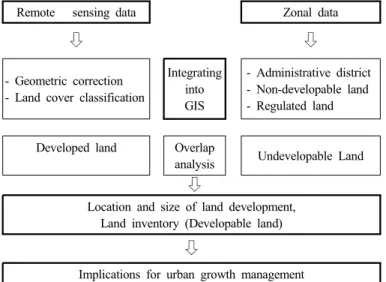
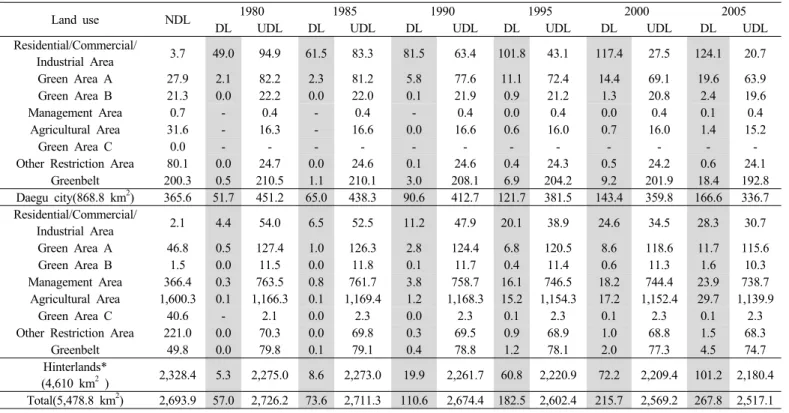
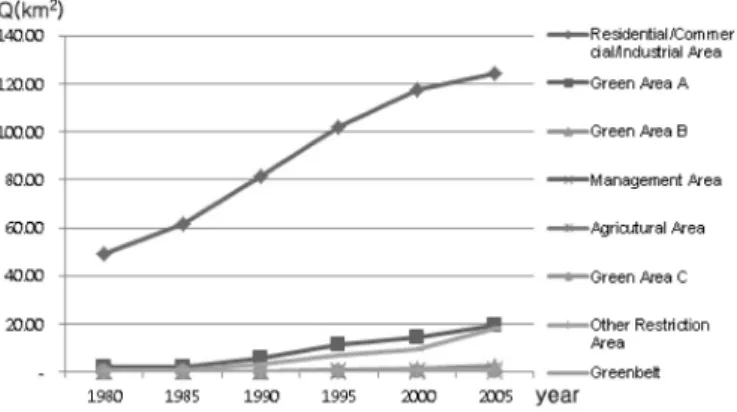
The primary purposes of this study are to identify the characteristics of land development in urban area through GIS and remote sensing techniques and to provide useful implications for urban spatial policy. To perform these tasks, Daegu metropolitan city and its vicinities were selected as a study area, and remote sensing data and attributed data were collected, organized and analyzed. This study focuses on the following three steps. First, it identifies the characteristics of land development in urban areas by utilizing multi-temporal satellite image data (Landsat TM, 1980, 1985, 1990, 1995, 2000 and 2005). Second, it tries to find an answer on a critical question concerning land use conversion, i.e., which land use leads expansion of urban area? Third, it derives implications for urban spatial policies based on these findings. The characteristics of the urban extents tell us that the main land use converted into urban use from non-urban uses is green areas. The public sector, central and local governments, leads the land use conversions of suburban lands as exclusive legal body to issue permission of land use change. Based on these findings, this study concludes that the more systematic and technically advanced management tools should be utilized for more effective spatial management for urban growth.

Keywords: Urban Growth Management, Land Development, Developable Land

1) Professor, Department of Urban Planning, Keimyung University, Daegu, Korea (Corresponding author: [email protected])

http://lhi.lh.or.kr

1. Background

In the field of urban planning, paradigm has been shifted from quantitative growth to qualitative aspects of human life. In modern cities around world, especially in advanced countries under suburbanization tends, land developments are very active in the edge of a city. Consequently, managing the edge of a large city becomes a crucial part of urban management.

Urban growth management concerns about the location, size, time, and cost of development. Therefore, land market monitoring is a heart of urban growth management. Unfortunately, land market monitoring for effective urban growth management is not implemented in Korea yet. Instead, there are various restrictions and permit systems to control land development, such as environment appraisal and traffic impact analysis. But these requirements cannot be effective tools to control urban growth since they can only be applied to individual projects.

In most advanced countries, land market monitoring is widely adopted and applied to expansion pattern of urban area, land use conversion, biological and environmental studies by utilizing remote sensing data. The main driving force of land conversion from non-urban use to urban use is industrialization and

economic development (Wu, 2004; Xiao et al., 2006). Mori (1998) pointed out that the differences in land value were main force of land use change. Other studies suggested socio-economic and physical factors (Hiroshi, 1998; Seto and Kaufmann, 2003;

Guangjin et al., 2005). There have been many research contri- butions to improve urban growth management (Ding and Hopkins, 1999; Cevero, 2001; Heim, 2001; Carruthers, 2002;

Pendall and Fulton, 2002; Allen and Lu, 2003; Liu and Anderson, 2004). Remote sensing techniques and the GIS were utilized to evaluate land development by many scientists (Cihlar, 2000; Liu and Anderson, 2004; Tiang et al., 2005; Jieying et al., 2006)

However, there are scanty studies to apply land market monitoring system to real land market management or urban growth control. Even worse, there is few studies to identify the effectiveness of various land use restrictions as an urban growth management tools.

Effective monitoring in urban land development cannot be

achieved unless proper systematic and applicable mechanism is

in operation. For these reasons, this study tries to identify the

characteristic of land development in urban area through GIS and

remote sensing techniques and to provide useful implications for

urban spatial policy. To perform these tasks, Daegu Metropolitan

(2)

Table 1. Summary of Data

Data Time Use Sources

Satellite image 1980, 1985, 1989, 1995, 2000, 2005

- land classification - temporal developed land

Landsat MSS, Landsat5 TM

Digital terrain map 2000

- administrative district - GCP(geometric correction) - slope and altitude analysis - undevelopable area

National Geographic Information Institute

Land use map 2000 - undevelopable area Ministry of Environment

LMIS map 2005 - land use by parcel

- other restricted zone Ministry of Land, Transport and Maritime Affairs

City and its vicinities were selected as study area, and remote sensing data and attribute data were collected, organized and analyzed.

2. Data and Approach

2.1 Data

Data used in this study can be classified into two categories.

One is spatial data which consist of vector and raster data. Vector data are digital terrain maps, land use maps, maps created by the LMIS (Land Management Information System) of Korea. The LMIS contains detailed land use information by parcel level.

Unlike the primary statistical unit prepared by National Statistical Office in 2001, it enables us to identify road and water boundary.

Rater data are mainly satellite images to be analyzed by remote sensing techniques. These are the basis of administration maps.

Another is attribute data such as population and employment data. Data descriptions are summarized in Table 1.

2.2 Approach

The concept of land development monitoring varies with region, method, time, and range. In general, land development monitoring supervises land development phenomena and provides them to policy makers (Knapp, 2001).

This study deals the land development monitoring with respect to urban growth management as follows. First, the spatial boundary of this study is Daegu metropolitan area. It includes Daegu metropolitan city and its vicinities. Second, this study covers two environmental aspects of land development – socio-economic and natural environment. In particular, this study concentrates on the location and size of land development as well as developable land stocks. Third, the time span of this study is twenty five years - from 1980 to 2005.

Lands can be classified into three categories – developed (urbanized) lands, undeveloped lands, and non-developable lands.

Developed lands, also known as existing urbanized areas, can be extracted from satellite images. Undevelopable lands are the land with physical restrictions and with institutional regulations. They can also be identified by using digital terrain map, land use map

and LMIS. Rest of lands is undeveloped land and is land stock for development.

The analysis of this study follows several steps. In order to identify the urbanized area (developed lands), geographic correction and land cover analysis of satellite images were performed. GCP (Ground Control Point) for geographic correction references permanent points in the digital terrain map. For more accurate geographic correction, SPOT images (15m by 15m resolution), rather than Landsat5 TM (30m by 30m) were used. The convergence of origin (GCP) and destination image was performed by geometric model (Polynomial model, by setting Polynomial order

= 2). After the ‘image to image’ correction, the final image transformation was performed by applying the nearest neighbor method.

We reclassified urbanized area, agricultural area, forest, vacant land, and waters by considering the land cover analysis classifi- cation of Department of Environment. We classified land cover using supervised classification model and utilized ERDAS IMAGINE signature editor. The type signatures defined is parametric (statistical).

To evaluate the signatures, we computed the statistical distance between signatures (separability). According to signature separability and contingency matrix, signatures were significant.

Maximum likelihood method was applied to parametric rule.

Undevelopable lands in this study include waters (streams and rivers, water reservoirs, and dams) and physical limitation of development (lands with slope higher than 30 degree and altitude higher than 200m). For slope and altitude analysis, DEM (digital elevation model) was utilized in ArcGIS 9.2.

All these data, along with administration maps, were built into GIS for analysis. The analysis process is summarized in Figure 1.

3. Monitoring Land Developments

3.1 Study Area

Daegu city, as a regional center of south-eastern part of Korea,

contains seven ‘Gu’s (District, the primary self-governing body

in the greater city area), 2 cities, and seven Guns (the primary

self-governing unit in rural area) with total population of

(3)

Remote sensing data Zonal data

⇩ ⇩

- Geometric correction - Land cover classification

Integrating into GIS

- Administrative district - Non-developable land - Regulated land

Developed land Overlap

analysis Undevelopable Land

Location and size of land development, Land inventory (Developable land)

Implications for urban growth management Fig. 1. The process of analysis

Fig. 2. Study area: Daegu metropolitan area

Table 2. The trend of land development by district: 1980~2005 (km

2

)

District NDL 1980 1985 1990 1995 2000 2005

DL UDL DL UDL DL UDL DL UDL DL UDL DL UDL

Jung-Gu 0.16 6.01 0.85 5.97 0.86 6.27 0.55 6.35 0.48 6.60 0.23 6.66 0.16

Dong-Gu 105.28 7.92 68.31 10.41 65.66 14.00 62.07 17.73 58.34 19.93 56.13 25.50 50.57

Seo-Gu 0.99 7.57 8.75 10.44 5.86 12.41 3.89 12.92 3.38 13.83 2.47 14.13 2.17

Nam-Gu 5.23 7.11 5.24 7.75 4.77 8.74 3.78 9.14 3.37 9.61 2.91 9.77 2.75

Buk-Gu 16.38 10.64 65.94 11.93 64.46 15.63 60.75 20.81 55.57 25.08 51.31 28.12 48.27

Suseong-Gu 24.69 7.35 43.99 9.14 42.47 14.22 37.40 17.74 33.87 20.27 31.34 22.55 29.06

Dalseo-Gu 13.50 4.36 44.09 7.72 40.85 13.88 34.69 22.93 25.63 30.21 18.36 33.51 15.06

Dalseong-Gun 199.35 0.71 214.02 1.59 213.39 5.46 209.52 14.10 200.89 17.91 197.08 26.34 188.65 Daegucity 365.58 51.66 451.20 64.95 438.32 90.61 412.65 121.72 381.54 143.44 359.82 166.58 336.68 Youngchun-Si 453.13 1.17 462.89 1.76 462.14 3.72 460.19 7.74 456.16 9.20 454.70 13.67 450.23 Gyeongsan-Si 187.89 1.83 218.22 2.93 217.87 6.67 214.13 14.06 206.73 18.66 202.13 28.47 192.32 Gunwi-Gun 362.96 0.13 249.72 0.31 250.18 0.68 249.80 2.91 247.57 3.13 247.36 3.68 246.81 Chungdo-Gun 480.21 0.37 215.24 0.53 215.18 1.38 214.33 3.71 212.00 3.97 211.74 6.00 209.71 Goryeong-Gun 121.82 0.25 257.80 0.37 257.66 1.03 257.00 5.36 252.67 6.08 251.95 8.91 249.12 Sungju-Gun 319.51 0.22 294.18 0.35 293.86 0.90 293.31 4.70 289.51 5.45 288.76 7.42 286.79 Chilgok-Gun 221.97 0.95 228.08 1.75 227.01 3.46 225.30 8.77 220.00 11.13 217.63 15.12 213.64 Changyong-Gun 180.89 0.40 348.90 0.63 349.11 2.10 347.64 13.51 336.23 14.60 335.14 17.93 331.81 Hinterlands 2,328.36 5.33 2,275.03 8.64 2,273.00 19.94 2,261.70 60.76 2,220.87 72.21 2,209.42 101.21 2,180.43

Total 2,693.94 57.00 2,726.22 73.58 2,711.31 110.55 2,674.35 182.48 2,602.41 215.65 2,569.24 267.79 2,517.11 - NDL: Non-developable land, DL: Developed land, UDL: Undeveloped land

3,112,179 (Daegu city=2,464,547 and vicinities=647,632) in 2005. Figure 2 shows study area. The area provides 916,632 jobs for residents (Daegu=714,703 and vicinities=201,929) in 2005.

3.2 Land Development by Administration District Table 2 presents non-developable lands, developed lands, and undeveloped lands by administration boundary and by year. The total study area is 5.478.8 km

2

(Daegu metropolitan city = 868.8 km

2

and hinterlands = 4,610.0 km

2

). As this table illustrates Daegu city has expanded rapidly since 1990. Similar pattern can also be observed in hinterlands, even though the share of developed lands is relatively low. However, the growth rate of urbanized area is much higher in hinterlands than in core city.

Among eight districts of Daegu city, districts in suburban areas (such as Dalseo, Buk, Dong, and Suseong) where large scale residential development occurred during study period reveal high level of land development. There is a sharp increase in new land development in Dalsung-gun, a rural area in Daegu metropolitan city. Other districts, characterized as traditional city core areas, do not have room for additional development with rare vacant lands.

New development in hinterlands had been led by Gyeongsan city, Changnyong-Gun, Chilgok-Gun, Youngchun city, partly because of intraregional development pressure and partly because development spillover from the core city. These trends are visually illustrated in Figure 3 and Figure 4.

3.3 Urban Extents

Urban extents by consecutive years reveal the location and size

of urban development. Figure 5 shows urban extents of the

(4)

Fig. 3. Land development area by district: Daegu

Fig. 4. Land development area by city (town): Hinterlands

Fig. 5. Spatial distribution of developed land and undeveloped land

Table 3. The trend of land development by land use: 1980~2005(km

2

)

Land use NDL 1980 1985 1990 1995 2000 2005

DL UDL DL UDL DL UDL DL UDL DL UDL DL UDL

Residential/Commercial/

Industrial Area 3.7 49.0 94.9 61.5 83.3 81.5 63.4 101.8 43.1 117.4 27.5 124.1 20.7

Green Area A 27.9 2.1 82.2 2.3 81.2 5.8 77.6 11.1 72.4 14.4 69.1 19.6 63.9

Green Area B 21.3 0.0 22.2 0.0 22.0 0.1 21.9 0.9 21.2 1.3 20.8 2.4 19.6

Management Area 0.7 - 0.4 - 0.4 - 0.4 0.0 0.4 0.0 0.4 0.1 0.4

Agricultural Area 31.6 - 16.3 - 16.6 0.0 16.6 0.6 16.0 0.7 16.0 1.4 15.2

Green Area C 0.0 - - - - - - - - - - - -

Other Restriction Area 80.1 0.0 24.7 0.0 24.6 0.1 24.6 0.4 24.3 0.5 24.2 0.6 24.1

Greenbelt 200.3 0.5 210.5 1.1 210.1 3.0 208.1 6.9 204.2 9.2 201.9 18.4 192.8

Daegu city(868.8 km

2

) 365.6 51.7 451.2 65.0 438.3 90.6 412.7 121.7 381.5 143.4 359.8 166.6 336.7 Residential/Commercial/

Industrial Area 2.1 4.4 54.0 6.5 52.5 11.2 47.9 20.1 38.9 24.6 34.5 28.3 30.7

Green Area A 46.8 0.5 127.4 1.0 126.3 2.8 124.4 6.8 120.5 8.6 118.6 11.7 115.6

Green Area B 1.5 0.0 11.5 0.0 11.8 0.1 11.7 0.4 11.4 0.6 11.3 1.6 10.3

Management Area 366.4 0.3 763.5 0.8 761.7 3.8 758.7 16.1 746.5 18.2 744.4 23.9 738.7

Agricultural Area 1,600.3 0.1 1,166.3 0.1 1,169.4 1.2 1,168.3 15.2 1,154.3 17.2 1,152.4 29.7 1,139.9

Green Area C 40.6 - 2.1 0.0 2.3 0.0 2.3 0.1 2.3 0.1 2.3 0.1 2.3

Other Restriction Area 221.0 0.0 70.3 0.0 69.8 0.3 69.5 0.9 68.9 1.0 68.8 1.5 68.3

Greenbelt 49.8 0.0 79.8 0.1 79.1 0.4 78.8 1.2 78.1 2.0 77.3 4.5 74.7

Hinterlands*

(4,610 km

2

) 2,328.4 5.3 2,275.0 8.6 2,273.0 19.9 2,261.7 60.8 2,220.9 72.2 2,209.4 101.2 2,180.4 Total(5,478.8 km

2

) 2,693.9 57.0 2,726.2 73.6 2,711.3 110.6 2,674.4 182.5 2,602.4 215.7 2,569.2 267.8 2,517.1

twenty five years (1980~2005) in five year interval. The figure tells us that new developments have been occurred near existing developed lands and suburban areas. It also shows that the land development is occurred in large scale at certain location.

3.4 Land Development by Land Use

Land area by land use restriction is shown in Table 3. Table 3

along with Figure 6 and Figure 7 show that the main land use of

new development during study period is residential, commercial

and manufacturing use. Consequently, undeveloped lands (UDLs)

(5)

Fig. 6. Land development area by land use: Daegu

Fig. 7. Land development area by land use: Hinterlands

of these uses have decreased significantly, from 95.9 km

2

in 1980 to 20.7 km

2

in 2005, in the case of Daegu, and those of hinterlands have declined from 54.0 km

2

in 1980 to 30.7 km

2

in 2005. This result is quite normal since these lands are designated for development. However, we can derive three distinctive develop- ment features from these development trends.

First, a special attention should be given to the development trends between developable land in inner city region and outer city regions (especially green area and greenbelt) after 1990.

Even though there are some developable lands available in the inner-city area, considerable lands in green and greenbelt area, where only public authorities can develop the lands for public purposes, have been developed since 1990. This tells us that recent land development characterized as green area reduction since 1990 is driven by the public sector.

Second, green area, forest and agricultural lands have been converted into urban uses rapidly in the hinterlands. The speed of agricultural lands and management area development is faster than residential, commercial and manufacturing use. This is the effects of government-driven large scale land development such as two-million housing project launched in early 1990s.

Third, the increase rate and total quantity of development activities in agricultural area overtook the residential, commercial and manufacturing use in hinterlands in 2005. The land development in greenbelt and green area show a similar trend with that of Deagu Metropolitan City.

4. Conclusion

So far, this study suggests methods and approaches of land monitoring for urban growth management, and analyzes land development by land use and by region.

The main finding of this study can be summarized as follows.

First, the main land developments have been occurred near the edge of core city and near existing urbanized area. Second, considerable amount of natural green area and greenbelt area have been developed in inner city areas by public sector.

Meanwhile, agricultural lands and management areas have been developed in hinterlands, even though considerable amount of developable lands exist in inner city side of core city. By summing these findings together, we suggest that more refined and advanced way of managing urban land development are required urgently.

There have been many government-driven large-scale land developments in suburban areas, such as new towns, innovation cities, free enterprise zones for last two decades. This may make the difference between inner-city development and suburban development. It is a quite challengeable research topic to examine whether these developments are justifiable in social point of view. But this topic is beyond our scope, and we leave it for a future research topic.

References

1. Allen, J. and K. Lu (2003), “Modeling and prediction of future urban growth in the Charleston Region of South Carolina: A GIS-based integrated approach,” Conservation Ecology , 8(2) (on line).

2. Carruthers, J. I. (2002), “The impact of state growth management programs: a comprehensive analysis”, Urban Studies, 39(11): 1959~

1982.

3. Cervero, R. (2001), “Efficient urbanization: Economic performance and the shape of the metropolis”, Urban Studies, 38(10): 1651~

1671.

4. Cihlar, J. (2000), “Land cover mapping of large areas from satellites: Status and research priorities”, International Journal of Remote Sensing, 21(6&7): 1093~1114.

5. Ding, C., G. Knaap and L. D. Hopkins (1999), “Managing urban growth with urban growth boundaries: A theoretical analysis”, Journal of Urban Economics, 46: 53~68.

6. Guangjin, T., L. Jiyuan, X. Yichun, Y. Zhifeng, Z. Dafang and N.

Zheng (2005), “Analysis of spatio-temporal dynamic pattern and driving forces of urban land in China in 1990s using TM images and GIS”, Cities, 22(6): 400~420.

7. Heim, C. E. (2001), “Leap-frogging, urban sprawl, and growth management: Phoenix, 1950~2000,” American Journal of Economics and Sociology , 60(1): 245~283.

8. Hiroshi, M. (1998), “Land conversion at the urban fringe: A

(6)

comparative study of Japan”, Birtain and the Netherlands. Urban Studies, 35(9): 1541~1558.

9. Jieying, X., S. Yanjun, G. Jingfeng, T. Ryutaro, T. Changyuan, L.

Yanqing and H. Zhiying (2006), “Evaluating urban expansion and land use change in Shijiazhuang, China, by using GIS and remote sensing”, Landscape and Urban Planning, 75: 69~80.

10. Knaap, G. J. (2011), Land Market Monitoring for Smart Urban Growth, 2001, Lincoln Institute of Land Policy.

11. Lin, R., P. N. Joshua and M. M. John (2005), “Twenty-five years of sprawl in the Seattle region: Growth management responses and implications for conservation”, Landscape and Urban Planning, 71: 51~72.

12. Liu, X. H. and C. Anderson (2004), “Assessing the impact of temporal dynamics on land-use change modeling”, Computers, Environment and Urban Systems, 28: 107~124.

13. Mori, H. (1998), “Land conversion at the urban fringe: A comparative study of Japan, Britain and the Netherlands”, Urban Studies, 35(9): 1541~1558.

14. Pendall, R., J. Martin and W. Fulton (2002), “Holding the line:

Urban containment in the united states”, A Discussion Paper, The Brookings Institution Center on Urban and Metropolitan Policy.

15. Seto, K. C. and R. K. Kaufmann (2003), “Modeling the drivers of urban land use change in the Pearl River Delta, China: Integrating remote sensing with socioeconomic data”, Land Economics, 79(1):

106~121.

16. Tian, G., J. Liu, Y. Xie, Z. Yang, D. Zhuang and Z. Niu (2005),

“Analysis of spatio-temporal dynamic pattern and driving forces of urban land in China in 1990s using TM images and GIS”, Cities, 22(6): 400~420.

17. Wu, Q., H. Q. Li, R. S. Wang, J. Paulussen, Y. He and M. Wang (2006), “Monitoring and predicting land use change in Beijing using remote sensing and GIS”, Landscape and Urban Planning (forthcoming).

18. Xiao, J., Y. Shen, J. Ge, R. Tateishi, C. Tang and Y. Liang (2006),

“Evaluating urban expansion and land use change in Shijiazhuang,

China, by using GIS and remote sensing”, Landscape and Urban

Planning, 75: 69~80.

수치

Table 1. Summary of Data
Fig. 2. Study area: Daegu metropolitan area
Table 3. The trend of land development by land use: 1980~2005(km 2 )
Fig. 6. Land development area by land use: Daegu

참조

관련 문서

• 이명의 치료에 대한 매커니즘과 디지털 음향 기술에 대한 상업적으로의 급속한 발전으로 인해 치료 옵션은 증가했 지만, 선택 가이드 라인은 거의 없음.. •

웹 표준을 지원하는 플랫폼에서 큰 수정없이 실행 가능함 패키징을 통해 다양한 기기를 위한 앱을 작성할 수 있음 네이티브 앱과

In the line of this, in what ways does Design Control in planning policy and the development of Urban Design Code can improve the quality of urban space.. In your opinion, what

The primary goal of urban renewal is to improve the structure of the urban area, housing development, infrastructure (roads, water, power supply, etc),

The main objective of the Bi Regional Center for SMES Development is oriented towards generating the conditions of cooperation among the countries which

The Process of Economic Growth in Korea How Korea Dealt with the Economic Crisis Korean Companies.. Future Growth Engine and Policy Direction.. The Korean Economy Now..

Current Tokyo is rich in green compared to other metro cities. In some parts, the greenery has been contributed by the many inherited gardens from the Edo era to today which

웰드라인의 위치를 위치를 옮기는 옮기는 방안 방안 - 게이트 위치 변경. - 제품 두께분포 변경 -