1. Introduction
The detailed investigation of the electrochemical behav- ior of magnesium alloys in various corrosion-active sol- utions in view of the development of novel approaches to anticorrosion protection constitutes an important theo- retical and practical problem focusing the attention of many research groups all over the world [1-6]. In the pres- ent paper, the results of studies of the corrosion activity of magnesium alloys with and without protection coatings in the chloride-containing media by several independent methods is reported.
The use of the conventional methods of study of the corrosion properties of the materials, such as gravimetry, volumetry, potentiodynamic polarization, and electro- chemical impedance spectroscopy, is concerned with the proportional occurrence of the corrosion process over the whole surface of the examined sample. However, for the majority of corrosion processes this approach is not appro- priate because of the difference in the phase and chemical compositions and the morphological structure of the cor- roded material. The formation of anodic and cathodic re- gions on the surface of the some materials in contact with
a corrosion-active media is the main reason of the occur- rence of local corrosion processes. The Scanning Vibrating Probe method – SVP (another used abbreviation is SVET, Scanning Vibrating Electrode Technique) allows studying the changes in the microelectrochemical activity of the sample under study on the microscale level. The changes in the potential distribution depend on the local current in the electrolyte over the samples surface. These changes revealed by the SVP method provide detailed information on the intensity of the individual corrosion processes.
The difference in the corrosion mechanisms for two types of Mg alloys has been established in the present paper. The stages of the corrosion process of the MA8 and VMD10 magnesium alloys have been also revealed and described.
The plasma electrolytic oxidation method is usually ap- plied for fabrication of coatings that improve the surface properties of various metals and alloys [1,2,7]. The fric- tional, corrosive, electrical, and thermal properties of these coatings have generated interest in view of their possible use in mechanical, aerospace, aircraft, and automobile in- dustry, engineering equipment components, and biomedical devices. This method can be used for the Mg alloys corro- sion protection [2]. An additional treatment of PEO-coat- ings by superdispersed polytetrafluoroethylene (SPTFE,
Corrosion Monitoring of PEO-Pretreated Magnesium Alloys
A. S. Gnedenkov1,2,†, S. L. Sinebryukhov1, D. V. Mashtalyar1,2, S. V. Gnedenkov1,2, and V. I. Sergienko1,2
1Institute of Chemistry, pr. 100-letiya Vladivostoka 159, Vladivostok 690022, Russia,
2Far Eastern Federal University, 8 Sukhanova St., Vladivostok, 690950, Russia (Received February 09, 2017; Revised February 09, 2017; Accepted June 07, 2017)
The MA8 alloy (formula Mg–Mn–Се) has been shown to have greater corrosion stability than the VMD10 magnesium alloy (formula Mg–Zn–Zr–Y) in chloride-containing solutions by Scanning Vibrating Electrode Technique (SVET) and by optical microscopy, gravimetry, and volumetry. It has been established that the crucial factor for the corrosion activity of these samples is the occurrence of microgalvanic coupling at the sample surface. The peculiarities of the kinetics and mechanism of the corrosion in the local heterogeneous regions of the magnesium alloy surface were investigated by localized electrochemical techniques. The stages of the corrosion process in artificial defects in the coating obtained by plasma electrolytic oxidation (PEO) at the surface of the MA8 magnesium alloy were also studied. The analysis of the experimental data enabled us to determine that the corrosion process in the defect zone develops predominantly at the magnesium/coating interface. Based on the measurements of the corrosion rate of the samples with PEO and composite polymer-containing coatings, the best anticorrosion properties were displayed by the composite polymer-containing coatings.
Keywords: SVET, PEO, magnesium alloys, composite protective coating, SIET
†Corresponding author: [email protected]
Forum® trademark) followed by a special heat treatment enables one to create composite polymer-containing coat- ings having the highest anticorrosion and antifriction prop- erties [7,8].
Heterogeneity of the electrolyte/PEO-coating/substrate in- terface (magnesium alloy MA8), the staging and character of the corrosion process occurring in the artificial defect zone at the surface of the PEO-coating were investigated in the present work by means of the scanning surface analysis meth- ods: Localized Electrochemical Impedance Spectroscopy (LEIS), Scanning Vibrating Probe (SVP) and Scanning Ion-selective Electrode (SIET) techniques along with Non-Contact Optical Surface Profiler (OSP) technique. Due to applying of the aforementioned methods, the character of the magnesium alloys corrosion and the development of the corrosion destruction in the passivating layer/alloy interface was established.
2. Corrosion Activity of the Alloys According to the SVP Data
2.1 MA8 alloy
After exposure of the MA8 alloy sample for 4 hours (NaCl, 0.3 mM), an intensive corrosion process at the al- loy's surface was observed. Changes in the color intensity distribution of the samples on the SVP-diagram indicate the heterogeneity of the fixed local potential distribution at the surface. After 16 hours of the sample exposure, heterogeneity of the potential distribution at the MA8 al- loy surface increased and became more clearly expressed.
Cathodic regions became more localized. The potential distribution at the surface after 40 - 60 hours of exposure corresponds to intensification of the corrosion destructions
at anodic parts having lower potential values. Initiation and changing of the size and geometry of the zones of electrochemical heterogeneity over time are related to the presence of intermetallic phases (phases with more pos- itive values of the potential in comparison with the magne- sium base) in the alloy.
The data obtained by the SVP method are in good agreement with those obtained by the optical microscopy (Fig. 1). Exposure of the samples to the corrosion-active media results in the electrochemical dissolution of the magnesium alloy and, therefore, the level of the alloy sur- face on the sample under study decreases in comparison with that of the epoxy resin. The samples corrosion proc- esses take place on their anodic parts, which are predom- inant in comparison with the cathodic ones. The level of the cathodic regions versus the level of resin did not vir- tually change during the experiment (Fig. 1). These results indicate to an intensive corrosion process even in weakly saline waters. One can conclude that a reliable anti- corrosion protection of magnesium alloys is required [9,10].
2.2 VMD10 alloy
The occurrence of the corrosion-active process was reg- istered at the surface of the magnesium alloy VMD10 (system Mg-Zn-Zr-Y) immediately upon immersion of the sample in the electrolyte. It should be emphasized that the dynamics of the corrosion process and the character of the anodic and cathodic regions distribution on the VMD10 and MA8 magnesium alloys were substantially different. Immersion of the sample for 15 to 22 hours results in the migration of the local anodic regions. This process is related to dissolution of grains containing the (a)
(b)
Fig. 1 Comparison of the data obtained by the SVP technique (a) and optical microscopy (b) at the surface of the magnesium MA8 alloy [9].
α-phase of magnesium. A heterogeneous character of the corrosion process of the VMD10 alloy (just like the MA8 alloy) is related to the difference in the free corrosion potential values of the phases (T-phase, Zr4Zn) in compar- ison with the α-phase of magnesium.
When the immersion time increased up to 73 hours, the potential distribution started to stabilize. The cathodic parts of the sample, in contrast to the anodic ones, did not virtually change the position at the sample surface.
Higher corrosion stability of the MA8 magnesium alloy, in comparison with that of the VMD10 alloy, was ascer- tained by means of the analysis of the values of the local electrode potentials in the extreme points of the cathodic and anodic areas (ΔE). The value of ΔE for the VMD10 alloy was more than one order of magnitude higher than that of the MA8 alloy (1230 µV against 90 µV). Higher values of the current density for the VMD10 alloy (0.42 A/m2) in comparison with MA8 alloy (0.045 A/m2) can be explained by the minimum of potential values in the local anodic regions. For both MA8 and VMD10 alloys there exists an absolute correlation of the data obtained by the optical microscopy and the SVP-method (Fig. 2) [9,10].
3. Corrosion Kinetics in the Artificial Defect Zone
Magnesium alloy MA8 rod was used as a sample. The MA8 surface was processed by the PEO method in a sili- cate-fluoride electrolyte in the bipolar mode for obtaining of PEO-coating at the surface of the Mg alloy. The thick- ness of the coating was equal to 16 μm, and the coated electrode area was 1.14 cm2.
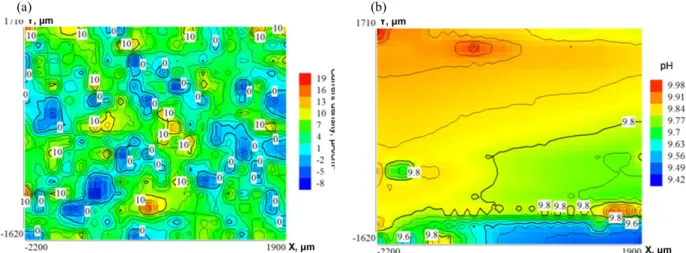
The area of the PEO-coating at the surface of the MA8 alloy has been investigated in a 0.05 M NaCl by SVET and SIET (with pH ion-selective membrane). According to the SVET the corrosion activity of the magnesium alloy with PEO-coating had a minimum values. This method prac- tically could not detect changes in microelectrochemical ac- tivity over the PEO-surface (Fig. 3a). At the same time SIET as more sensitive method for such objects has demon- strated the local cathodic and anodic areas, areas with more positive values of the pH and less positive ones (Fig. 3b).
Heterogeneity of the magnesium alloy composition is the main reason of its spatial electrochemical hetero- geneity because of the difference of values of the electrode potential of intermetallic inclusions in comparison with the magnesium base.
In the centre of the sample with PEO-coating, an artifi- cial pinhole (0.5 mm in diameter) was made using a drill to study the development kinetics of the corrosion-active zone at the coating surface. The electric contact for carry- ing out the electrochemical measurements was supplied
(a)
(b)
Fig. 2 Comparison of the data obtained by SVP technique (a) and optical microscopy (b) at the surface of the magnesium VMD10 alloy [9].
in the bottom of metallic part of the investigated sample.
Due to the features of the LEIS method, the impedance and a phase angle distribution have been generated at all stages of the corrosion active process [2]. The color in- tensity in Fig. 4 characterizes the distribution of the im- pedance values at the sample surface. A decrease of the impedance magnitude (Fig. 4a) was registered after mak- ing of the artificial pinhole. The defect zone in the begin- ning of the experiment had very clear edges and a limited area. The tendency of decreasing of the impedance values can be revealed during the time of the experiment. A small increase in the resistance of the investigated system was fixed after exposure of the samples to the corrosion-active media for 6 hours as a result of the increase of the thick- ness of the corrosion products layer that led to a reduction in the supply of active components to the zone of corrosion.
The exposure of the sample to a 3% NaCl solution for 15 hours (Fig. 4b) resulted in a sharp reduction of the impedance modulus. Analysis of the experimental results gave us a base to suggest that the corrosion process in the defect zone developed predominantly at the magne- sium/coating interface. Besides, the LEIS technique al- lows detecting the precision changes result from corrosion process, which cannot be found by optical microscopy.
The Randles equivalent electrical circuit, which ad- equately simulates the mechanism of the corrosion process in the local defect of the protective PEO-coatings, has been used [2].
The commensurability and comparability of the top- ography of the defect zone and the neighbouring surface area before and after the exposure of the sample to the corrosion-active solution were determined using the opti- cal microscopy and additionally corroborated by the OSP
(a) (b)
Fig. 3 SVET (a) and SIET (b) mapping on the area of the initial PEO-coating on the Mg MA8 alloy sample.
(a) (b)
Fig. 4 LEIS mapping on the area around the artificial defect in the PEO-coating on the Mg alloy sample. Impedance modulus:
a) before immersion in the 3% NaCl solution, and b) after a 15-hour immersion in the 3% NaCl solution [2].
technique. It should be emphasised that, according to the optical estimation and OSP method, the area of the defect zone did not change during the time of the experiment (Fig. 5).
According to the SVP method, the MA8 sample with an artificial defect in the PEO-coating was immersed into the electrolyte (the conductivity is equal to 150.0 μS/cm).
The changing of the potential distribution over the surface was evaluated by the SVP method. The SVP mapping on the area around the artificial defect in the PEO-coating on the Mg alloy sample before the immersion in the 3%
NaCl solution is shown in Fig. 6a. After 3 hours of the exposure of the sample to the 3% NaCl solution, an in- crease of the potential gradient in the defect zone was observed. The tendency to the increase of the values of the potential gradient was continued and maintained (Fig.6b) after 6 hours of the exposure of the sample.
However, the decrease of the distance between the equi- potential lines (Fig. 6b), which results from the formation of the corrosion products on the sides of the defect, was also established. Twelve hours of the exposure caused a sharp decrease of the potential values gradient (Fig. 6c).
At this stage, the products of the corrosion process began to deposit at the bottom of the defect zone, whereas the distance between equipotential lines tends to increase. Due to a partial passivation of the metal in the defect zone by corrosion products, the corrosion process began to de- velop on the intact part of the coating. This process must be realized through the coating pores. When the im- mersion time was increased up to 15 hours, the values of the potential gradient between the undamaged coating and the bottom of the active surface (defect zone) began to increase again (Fig. 6d). The distance between equi- potential lines also increased, which was the result of the acceleration of the corrosion process in the defect zone.
4. Corrosion Rate Estimated by Gravimetry and Volumetry Methods
The data of the corrosion rate obtained by the gravim- etry (Pw) and volumetry (PH) methods in correlation with the values of the total specific volume of the emitted hy- drogen are presented in Table 1.
According to the experimental data, the corrosion rates Pw and PH have a good correlation with each other and (a)
(b)
Fig. 5 OSP mapping on the area around the artificial defect in the PEO-coating on the Mg alloy sample (a) before immersion in the 3% NaCl solution and (b) after a 15-hour immersion in the 3% NaCl solution. Insertions are photos of defect zone.
Table 1 Corrosion rate of the VMD10 and MA8 magnesium alloys under the immersion in a 3% NaCl solution for 7 days [9]
Sample Corrosion rate, mm/year
V/S, ml/cm2
Pw PН
MA8 1.15 0.64 1.97
VMD10 5.05 2.10 6.33
MA8+PEO – 0.05 0.15
VMD10+PEO – 0.93 2.85
corroborate the SVP data conclusion on higher corrosion activity of the VMD10 alloy in comparison with the MA8 alloy [9]. Lower values of the corrosion rate registered by volumetry could be related to the partial hydrogen dis- solution in the magnesium matrix after the formation of
corrosion products layer at the surface of the alloy and in the corrosion-active solution. At the same time, higher values of the corrosion rate obtained by the gravimetry method could be explained by the partial capturing of the surface grains of the magnesium, which are unaffected by the corrosion but weakly connected to the base of the alloy, during the process of removal of the corrosion prod- ucts under the etching [9].
The dynamics of changes in the corrosion rate in the 3% NaCl solution is shown in Fig. 7 for the investigated MA8 and VMD10 alloys according to the results of grav- imetry measurements. Analysis of the experimental data indicates to higher intensity of the corrosion of the VMD10 alloy in contrast to the MA8 alloy.
The MA8 alloy is characterized by a stable corrosion rate (Pw ~ 1.1 mm/year) upon two days of the immersion in a corrosion medium. The corrosion rate for the VMD10 alloy constantly increased over time and became Pw ~ 5 mm/year by the end of the experiment. The reason of such course of the corrosion process on the VMD10 and MA8 alloys is concerned with the difference in chemical com- (a)
(b)
(c)
(d)
Fig. 6 SVP mapping on the area around the artificial defect in the PEO-coating on the Mg alloy sample: upon immersion in a 3% NaCl aqueous solution (in hours): a) 0, b) 6, c) 12, and d) 15.
Fig. 7 Alteration of the corrosion rate versus the immersion time in a 3 % NaCl solution for magnesium MA8 and VMD10 alloys [9].
positions of the alloys and that of the corrosive activity of the phases and compounds presented in the alloy. The latter factor appears on the microscale level and has been confirmed by the SVP-data [9,10,11]. A decrease of the corrosion rate values was registered upon formation of the PEO-coating at the surface of the MA8 and VMD10 magnesium alloys. The formation of the PEO-coating at the surface of the MA8 magnesium alloy resulted in a
dramatic reduction of the corrosion rate. The value of PН
reduced from 0.64 mm/year (for bare alloy) to 0.05 mm/year (for PEO-coated alloy), i.e., by more than one order of magnitude (Table 1). The value of the corrosion rate (PН) for the VMD10 magnesium alloy also decreased from 2.10 to 0.93 mm/year, i.e., more than twofold (Table 1). The corrosion activity of the PEO-coated VMD10 mag- nesium alloy exceeds that of the uncoated MA8 alloy in the corrosive media (0.93 mm/year versus 0.64 mm/year, respectively). The corrosion process occurs through the pores of the PEO-layer due to high porosity structure of the coating. According to the experimental results ob- tained by the LEIS [2], if PEO-coatings formed at the surface of the magnesium alloys have microsized defects (for instance, a deep pore), then the corrosion active media destroys magnesium alloys under the coating.
The corrosion rate significantly decreased upon filling (sealing up) of pores by the inert compound – super- dispersed polytetrafluoroethylene. Upon filling the PEO coating pores by SPTFE followed by special heat treat- ment, no hydrogen was formed at all. The corrosion rate (PН) values for both types of the magnesium alloys (MA8 and VMD10) were about 0 mm per year after exposure of the samples to the 3% NaCl solution for 7 days [9,10,11].
Cross-section prepared by Ar+ etching of the sample is shown in Fig. 8a. The thickness of the obtained PEO-coating was found to be 20 µm. The SPTFE layer was uniform with the general thickness equal to about 1–1.5 µm. Cross-section prepared by metallographic method of the sample processing is presented in Fig. 8b and 8c. Points marked within the PEO-coating (Fig. 8b, 8c) indicated the fluorine distribution in the inner part (point 1), in the middle part (point 2, 3), in the pore (point 4, 5, 6) and in the outer part of the coating (point 7).
The analysis of the experimental data presented in the Table 2 testified to a higher fluorine concentration in the (a)
(b)
(c)
Fig. 8 SEM-images of the cross-section for the magnesium sample with PEO-coating after filling of pores by SPTFE. Cross-sections were prepared by Ar+ etching (a), by metallographic method (b, c) of the sample processing [12].
Table 2 Fluorine distribution through the PEO-coating at the surface of the Mg alloy [12]
Point # Part of the coating Fluorine content, at. %
1 inner part 12.71
2 middle part 08.05
3 middle part 06.34
4 porous part 22.56
5 porous part 35.77
6 porous part 34.13
7 outer part -
inner part (point 1) of the coating in comparison with the middle part (point 2, 3). This result is related to the formation of the thin uniform porousless layer of the MgF2
during the PEO process in the inner part of the PEO-coat- ing [12].
The fluorine content decreases through the thickness of the coating (Fig. 8b) and practically vanished in the outer part (Fig. 8c; point 7) (Table 2). The highest value of the fluorine concentration was determinate inside the pour on the surface of the PEO-coating (Fig. 8b, 8c; point 4–6).
This result is connected with the SPTFE-treatment of the surface and confirmed the penetration of the polymer in- side the pours with the formation of the composite poly- mer-containing coating [12].
The typical change of the friction coefficient (µ) over the sliding route of a steel ball over the surface of the samples of three types is shown in Fig. 9.
For the sample without coating, the friction coefficient manifests low-amplitude oscillations in the range 0.08–
0.14 with the average value of 0.11. The observed behav- ior is typical for such soft material as magnesium: it in- dicates to a stepwise trend of the adhesion wear. Although the friction coefficient has rather low values, its oscil- lations demonstrate poor tribological properties of the al- loys without coating.
The sample with the base PEO-coating manifests rather high friction coefficients in the range 0.23–0.39. The in- crease of the slope of the straight line approximating ex- perimental values of the friction coefficient along with the increase of the route slope for PEO-coating (Fig. 9) is explained in [12] by changes in areas of contacting sur- faces (PEO-coating and steel ball) in the process of the tribological test. As a result, in the contact area the chem-
ical interaction of the coating with steel becomes stronger, which yields the friction coefficient increase. One should mention that the value of friction coefficient of the PEO-coating is 3.5-fold higher than that of the sample of magnesium alloy MA8 without coating. The curve for the composite coating demonstrates the best tribological parameters due to the presence of SPTFE at its surface.
The friction coefficient here has the lowest values: 0.01–
0.06 with the average value about 0.04, which is more than 8-fold lower than that of the initial coating formed in the PEO process.
The composite coating with thoroughly sealed pores of the base PEO-layer provides the details made of magne- sium alloys not only with the maximal corrosion protection, but also with the decrease of the friction coefficient. Low value of this parameter indicates to a substantial increase of the coating antifriction properties. Here SPTFE serves as a lubricant. In this case, due to chemical inertness, the chemical interaction of the coating material with steel and changes in the contacting surfaces areas are absent, which ensures constant values of the friction coefficient [12].
5. Conclusions
To sum up, the crucial factor of the corrosion activity of the investigated samples MA8 (Mg–Mn–Се) and VMD10 (Mg–Zn–Zr–Y) was obtained by the SVP method.
The analysis of the these data enabled us to suggest that the secondary phases in the VMD10 composition have more positive values of the potential in the corrosion ac- tive media in comparison with the α-phase of magnesium that results in the acceleration of the dissolution of the α-phase. The data obtained by the independent gravimetry and volumetry methods and optical microscopy have a good correlation with the SVP data. The kinetics and mechanism of the corrosion process of the magnesium alloy in the local part of the heterogeneous area – the artificial defect zone at the surface of the PEO-coating – were investigated by a combination of the localized scanning methods (LEIS, SVP, OSP). LEIS data enabled one to conclude that the corrosion process in the defect zone develops predominantly at the magnesium/coating interface. The unique method for the formation of a com- posite polymer-containing coating at the surface of magne- sium alloy MA8 has been established in this paper. Special treatment of PEO-coatings by SPTFE enables one to im- prove significantly both protective and antifriction proper- ties of the surface of magnesium alloys. Protective proper- ties of the composite coating obtained through SPTFE treatment were more than 300-fold higher than that of the initial coating formed by the PEO method. It has been Fig. 9 Dependence of the friction coefficient of the pair steel
(100Cr6) ball/sample on the type of surface treatment of the surface of the magnesium alloys MA8 at a load of 7 N [12].
established, that the SPTFE treatment of PEO-layers sharply decreases values of the corrosion rate.
Acknowledgments
This work was supported by the Grant of Russian Science Foundation (on project No.14-33-00009).
References
1. S. V. Gnedenkov, O. A. Khrisanfova, A. G. Zavidnaya, S. L. Sinebryukhov, V. S. Egorkin, M. V. Nistratova, A.
Yerokhin and A. Matthews, Surf. Coat. Technol., 204, 2316 (2010).
2. S. L. Sinebryukhov, A. S. Gnedenkov, D. V. Mashtalyar, S. V. Gnedenkov, Surf. Coat. Technol., 205, 1697 (2010).
3. G. Song, A. AtrensAdv. Eng. Mater., 5, 837 (2003).
4. G. Williams, R. Grace, Electrochim. Acta, 56, 1894 (2011).
5. A. L. Yerokhin, A. Shatrov, V. Samsonov, P. Shashkov, A. Leyland, A Matthews, Surf. Coat. Technol., 182, 78 (2004).
6. R. Arrabal, J. M. Mota, A. Criado, A. Prado, M. Mohedano, E. Matykina, Surf. Coat. Technol., 206, 4692(22) (2012).
7. S. V. Gnedenkov, S. L. Sinebryukhov, Compos. Interface., 16, 387 (2009).
8. S. V. Gnedenkov, S. L. Sinebryukhov, D. V. Mashtalyar, V. S. Egorkin, A. K. Tsvetnikov, A. N. Minaev, Protect.
Met., 43, 667 (2007).
9. A. S. Gnedenkov, S. L. Sinebryukhov, D. V. Mashtalyar, S. V. Gnedenkov, Surf. Coat. Technol., 225, 112 (2013).
10. A. S. Gnedenkov, S. L. Sinebryukhov, D. V. Mashtalyar, S. V. Gnedenkov, Phys. Procedia, 23, 98 (2012).
11. A. S. Gnedenkov, S. L. Sinebryukhov, D. V. Mashtalyar, S. V. Gnedenkov, Sol. St. Phen., 213, 143 (2014).
12. S. V. Gnedenkov, S. L. Sinebryukhov, D. V. Mashtalyar, V. S. Egorkin, M. V. Sidorova, A. S. Gnedenkov, Corros.
Sci., 85, 52 (2014).
![Fig. 1 Comparison of the data obtained by the SVP technique (a) and optical microscopy (b) at the surface of the magnesium MA8 alloy [9].](https://thumb-ap.123doks.com/thumbv2/123dokinfo/5403688.218128/2.892.247.647.122.384/comparison-obtained-technique-optical-microscopy-surface-magnesium-alloy.webp)
![Fig. 2 Comparison of the data obtained by SVP technique (a) and optical microscopy (b) at the surface of the magnesium VMD10 alloy [9].](https://thumb-ap.123doks.com/thumbv2/123dokinfo/5403688.218128/3.892.260.639.649.1055/comparison-obtained-technique-optical-microscopy-surface-magnesium-alloy.webp)
![Table 1 Corrosion rate of the VMD10 and MA8 magnesium alloys under the immersion in a 3% NaCl solution for 7 days [9]](https://thumb-ap.123doks.com/thumbv2/123dokinfo/5403688.218128/5.892.88.817.543.645/table-corrosion-rate-magnesium-alloys-immersion-nacl-solution.webp)
![Fig. 7 Alteration of the corrosion rate versus the immersion time in a 3 % NaCl solution for magnesium MA8 and VMD10 alloys [9].](https://thumb-ap.123doks.com/thumbv2/123dokinfo/5403688.218128/6.892.98.412.818.1037/alteration-corrosion-versus-immersion-nacl-solution-magnesium-alloys.webp)
![Table 2 Fluorine distribution through the PEO-coating at the surface of the Mg alloy [12]](https://thumb-ap.123doks.com/thumbv2/123dokinfo/5403688.218128/7.892.86.818.893.1090/table-fluorine-distribution-peo-coating-surface-mg-alloy.webp)
