pISSN 2288-9272 eISSN 2383-8493 J Oral Med Pain 2016;41(3):99-109 http://dx.doi.org/10.14476/jomp.2016.41.3.99
Factors Influencing the Xerostomia Symptoms in the Patients with Temporomandibular Disorders
Ki-Mi Kim, Jin-Seok Byun, Jae-Kwang Jung, Jae-Kap Choi
Department of Oral Medicine, School of Dentistry, Kyungpook National University, Daegu, Korea
Received August 19, 2016 Revised September 13, 2016 Accepted September 19, 2016
Purpose: This study investigated factors influencing the xerostomia symptoms in the patients with temporomandibular disorders (TMDs).
Methods: Eighty-six participants over the age of twenty were randomly enrolled from patients with TMDs. The patients were diagnosed by Diagnostic Criteria-TMD (DC-TMD). Intensity of the pain and level of stress of the patients were recorded using TMD pain visual analogue scale (VAS) and stress VAS, respectively. The Symptom Checklist-90-Revised (SCL-90R), dry mouth symptom questionnaire, unstimulated salivary flow rate (USFR) and oral moisture were mea- sured.
Results: The patients who had above the mean of the TMD pain VAS had significantly higher scores on the stress VAS, subjective dry mouth symptoms and T-score of somatization. The pa- tients who suffered from pain more than three months had significantly higher TMD pain VAS, subjective dry mouth symptoms and T-score of somatization. There were no significant differ- ences in xerostomic symptoms according to the diagnosis of TMDs. Moreover, TMD pain VAS and the stress VAS did not correlated to USFR and oral moisture.
Conclusions: The level of individuals’ TMD pain and stress significantly affect their subjective dry mouth symptoms, however, it did not affect USFR and oral moisture.
Key Words: Oral moisture; Stress; Temporomandibular disorders; Xerostomia
Correspondence to:
Jae-Kap Choi
Department of Oral Medicine, School of Dentistry, Kyungpook National University, 2177 Dalgubeol-daero, Jung-gu, Daegu 41940, Korea Tel: +82-53-600-7321 Fax: +82-53-426-2195 E-mail: [email protected]
JOMP
Journal of Oral Medicine and PainCopyright Ⓒ 2016 Korean Academy of Orofacial Pain and Oral Medicine. All rights reserved.
CC This is an open-access article distributed under the terms of the Creative Commons Attribution Non-Commercial License (http://creativecommons.org/licenses/by-nc/4.0/), which permits unrestricted non-commercial use, distribution, and reproduction in any medium, provided the original work is properly cited.
INTRODUCTION
Temporomandibular disorders (TMDs) are musculoskel- etal disorders associated with the temporomandibular joint pathology and the function of the masticatory system.
Occlusal factors, trauma, emotional stress, deep pain input and parafunctional activities are suggested as major etio- logic factors in TMDs.
1)In particular, it is well known that psychological factors play a significant role in the etiology and maintenance of TMDs. People who have a high inci- dence of exposure to stressful life events
2)and increased levels of anxiety and stress-related somatic symptoms
3)are reported more prevalent in TMD patients.
Stress is known to be closely related to reinforcement of
parafunctional activities, especially bruxism.
4)Stress seems
to alter the activity of muscle through either gamma effer-
ent system to the muscle spindle or by means of sympa-
thetic effect to the muscle tissues or related structures.
5-9)Therefore, it is likely that stress may be considerably related
to the masticatory muscle pain and the joint problems such
as localized muscle soreness, disc displacement, and even
osteoarthritis. Moreover, it is generally accepted that stress
is also associated with xerostomia. According to the study
of Bergdahl and Bergdahl,
10)subjective oral dryness and re-
duced unstimulated salivary flow rate (USFR) were signifi-
cantly associated with depression, trait anxiety, perceived
stress, and state anxiety. Kim
11)also reported that the job
stress itself could be a causative factor of xerostomia.
Based on these findings, we hypothesized that TMD itself and xerostomic condition might be directly correlated, and investigated the stress as intersection of these two diseases.
A study showed the relationship between the orofacial pain and xerostomia,
12)but studies on the relationship between TMDs and xerostomia are still insufficient. The objective of this study is to investigate the relationship between the TMDs and xerostomia and reveal specific factors influenc- ing the xerostomia symptoms in the patients with TMDs us- ing Symptom Checklist-90-Revised (SCL-90R), dry mouth symptom questionnaire, USFR and oral moisture.
MATERIALS AND METHODS
1. Subjects
Eighty-six participants over the age of twenty were ran- domly enrolled from patients who visited the Department of Oral Medicine at Kyungpook National University Hospital (Daegu, Korea) with TMDs from June to July 2016.
Individuals with a history of taking any medication during two weeks before their visit and with rheumatoid arthri- tis or congenital musculoskeletal problems were excluded in this study. Patients who are not able to fill out SCL-90R were excluded, as well. All subjects were provided with a full explanation of the protocol and written informed con- sent has been obtained before the study began. This study was approved by Kyungpook National University Hospital’s Institutional Review Board (IRB No. 2016-05-007-001).
2. Measurements
1) General information
Smoking and drinking status of the patients were record- ed. The patients were asked “To what extend do you have stress?” for evaluating their stress and “To what extend do you have pain on TMJ or surrounding structures?” for eval- uating the severity of except TMD pain. Above two inqui- ries were assessed by visual analogue scale (VAS).
2) Diagnosis of TMDs
Diagnosis of TMDs was made in a basis of the patient’s chief complaints, clinical examination, clinical history, and radiological examinations using Diagnostic Criteria for TMD (DC-TMD).
13,14)Diagnosis was categorized into 1) joint, 2) muscle, and 3) mixed problems (muscle problems along with joint ones). If the patient had more than three-month history of pain, he or she was categorized as chronic group.
If the participant had no pain, only joint sounds, or having pain within three months, then he or she was categorized as acute group.
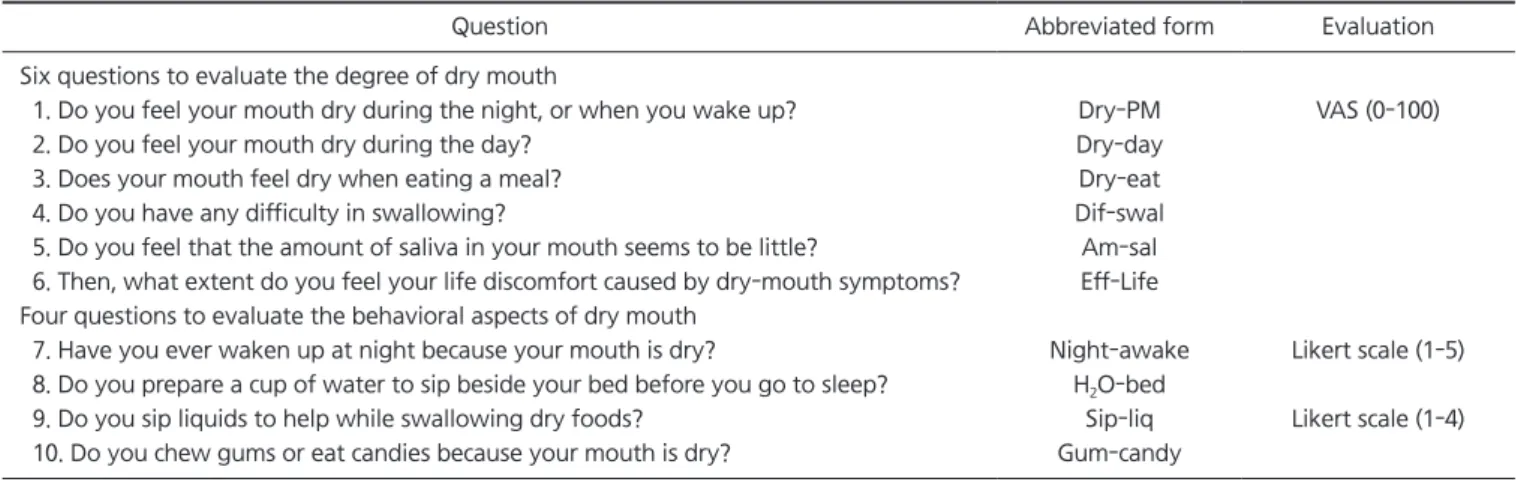
3) Dry mouth symptom questionnaire
The dry mouth symptom questionnaire
15)was used to evaluate subjective xerostomia symptoms. It is composed of ten questions and divided into two parts. One is composed of six questions to evaluate the degree of dry mouth using VAS and the other is composed of four questions to evalu- ate the behavioral aspects of dry mouth using the Likert scale. The participants were asked to fill in the question- naire. We used each scores and the sum of the VAS of six
Table 1. Dry mouth symptom questionnaires
Question Abbreviated form Evaluation
Six questions to evaluate the degree of dry mouth
1. Do you feel your mouth dry during the night, or when you wake up? Dry-PM VAS (0-100)
2. Do you feel your mouth dry during the day? Dry-day
3. Does your mouth feel dry when eating a meal? Dry-eat
4. Do you have any difficulty in swallowing? Dif-swal
5. Do you feel that the amount of saliva in your mouth seems to be little? Am-sal 6. Then, what extent do you feel your life discomfort caused by dry-mouth symptoms? Eff-Life Four questions to evaluate the behavioral aspects of dry mouth
7. Have you ever waken up at night because your mouth is dry? Night-awake Likert scale (1-5) 8. Do you prepare a cup of water to sip beside your bed before you go to sleep? H
2O-bed
9. Do you sip liquids to help while swallowing dry foods? Sip-liq Likert scale (1-4) 10. Do you chew gums or eat candies because your mouth is dry? Gum-candy
VAS, visual analogue scale.
questions to evaluate the degree of dry mouth (Sub-sum6) for the statistical analysis. The questionnaire and the abbre- viated form are shown at Table 1.
4) Unstimulated salivary flow rate
Patients were instructed to drool the saliva for 10 minutes into a centrifuge tube. After collecting them for ten min- utes, the volume of saliva was measured. According to the criteria proposed by Ericsson and Hardwick,
16)severe hy- posalivation was defined as an USFR <1 mL/10 min, normal salivation was defined as an USFR ≥2.5 mL/10 min, and the in-between was classified as low salivation group.
5) Oral moisture
Oral moisture in the subject’s mouth was measured to compare with subjective oral dryness and USFR. The inves- tigator measured oral moisture on the subject’s tongue by using the Oral Moisture Checking Device (Mucus; Life Co., Ltd., Tokyo, Japan).
17,18)It measures moisture of the epithe- lium in terms of capacitance.
17)According to the criteria of the manufacturers guide line, normal group was defined as oral moisture ≥30%, dry group was defined as oral moisture
<25%, and moderate group was defined between the two groups. To reduce errors, the participants asked to swal- low the saliva before the test and the investigator measured them five times.
6) Symptom Checklist-90-Revised
SCL-90R, self-report inventory of general psychiatric symptoms, was administered to evaluated psychological
status of the participants. SCL-90R consists of ninety ques- tions and is composed of nine symptom dimensions, in- cluding somatization (SOM), obsessive-compulsive behavior (O-C), interpersonal sensitivity (I-S), depression (DEP), anxi- ety (ANX), hostility (HOS), phobic anxiety (PHOB), paranoid ideation (PAR), and psychoticism (PSY). It has also three global indices of functioning including global severity in- dex (GSI), positive symptom distress index (PSDI), and posi- tive symptom total (PST).
19)T-scores are used for the statis- tical analysis.
3. Statistical Analysis
Statistical analysis of the data was performed using the PASW Statistics 18.0 for Windows (IBM Co., Armonk, NY, USA) including the independent two-sample t-test, ANOVA, chi-square and correlation analysis. A difference of p<0.05 was considered statistically significant.
RESULTS
1. Demographic and TMD Profiles of the Patients
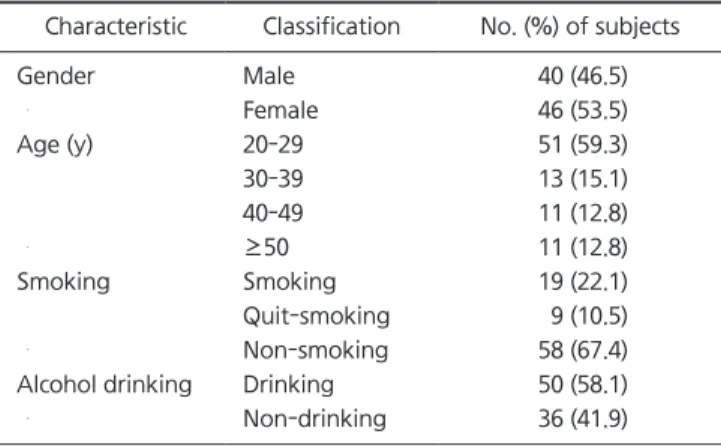
The participants were forty males and forty-six females.
Of the total patients, 59.3% were in their twenties. Fifty- eight patients were non-smokers and fifty patients were alcohol consumers (Table 2). Around 34% had history of pain for more than three months and there was no sex dif- ference. In the case of male patients, joint pain group and mixed pain group were similar in percentage, whereas fe- male patients had more mixed pain than muscle or joint pain only (Table 3). The average TMD pain VAS was 39.64 out of 100 and the average stress VAS was 49.33 among the
Table 2. Demographic profiles of the participants
Characteristic Classification No. (%) of subjects
Gender Male 40 (46.5)
Female 46 (53.5)
Age (y) 20-29 51 (59.3)
30-39 13 (15.1)
40-49 11 (12.8)
≥50 11 (12.8)
Smoking Smoking 19 (22.1)
Quit-smoking 9 (10.5)
Non-smoking 58 (67.4)
Alcohol drinking Drinking 50 (58.1)
Non-drinking 36 (41.9)
Table 3. Analysis of TMD profiles
TMD profile Male (n=40)
Female (n=46)
Total (n=86)
Acute 26 (65.0) 31 (67.4) 57 (66.3)
Chronic 14 (35.0) 15 (32.6) 29 (33.7)
Joint 17 (42.5) 2 (4.3) 30 (34.9)
Muscle 6 (15.0) 13 (28.3) 8 (9.3)
Mixed 17 (42.5) 31 (67.4) 48 (55.8)
TMD VAS 42.25 37.37 39.64
Stress VAS 45.88 52.33 49.33
TMD, temporomandibular disorder; VAS, visual analogue scale.
Values are presented as number (%) or mean number only.
all patients. The TMD pain VAS in male and the stress VAS in female were higher than the opposites, but they were no statistically significant (Table 3).
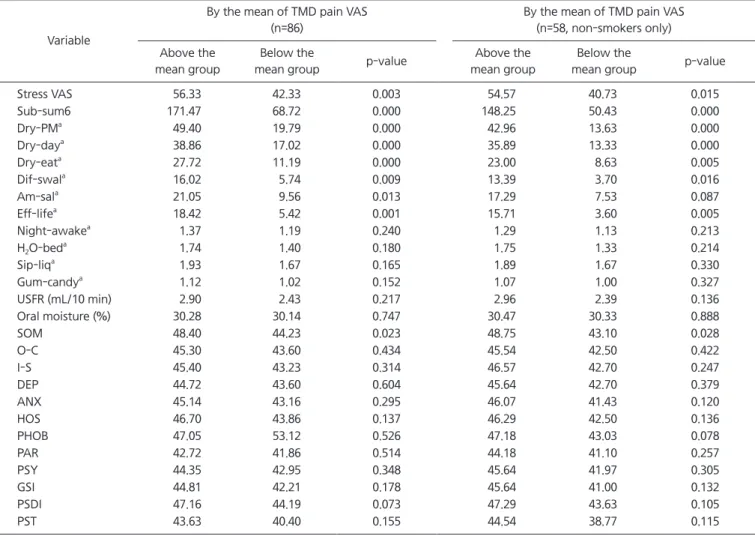
2. Relationship between the TMD Pain VAS and the Other Factors
We divided the participants into two groups by the mean of the TMD pain VAS. The patients who had above the mean of the TMD pain VAS had significantly higher scores on the stress VAS (p=0.003), Sub-sum6 (p=0.000), night- time dryness (Dry-PM, p=0.000), day-time dryness (Dry-day, p=0.000), dryness when eating (Dry-eat, p=0.000), difficulty in swallowing (Dif-swal, p=0.009), lack of the amount of
saliva (Am-sal, p=0.013), life discomfort (Eff-life, p=0.001), and T-score of SOM (p=0.023). Within the non-smoking group, the patients who had above the mean of the TMD pain VAS had significantly higher scores on the stress VAS (p=0.015), Sub-sum6 (p=0.000), Dry-PM (p=0.000) Dry-day (p=0.000), Dry-eat (p=0.005), Dif-swal (p=0.016), Eff-life (p=0.005), and T-score of SOM (p=0.028) (Table 4).
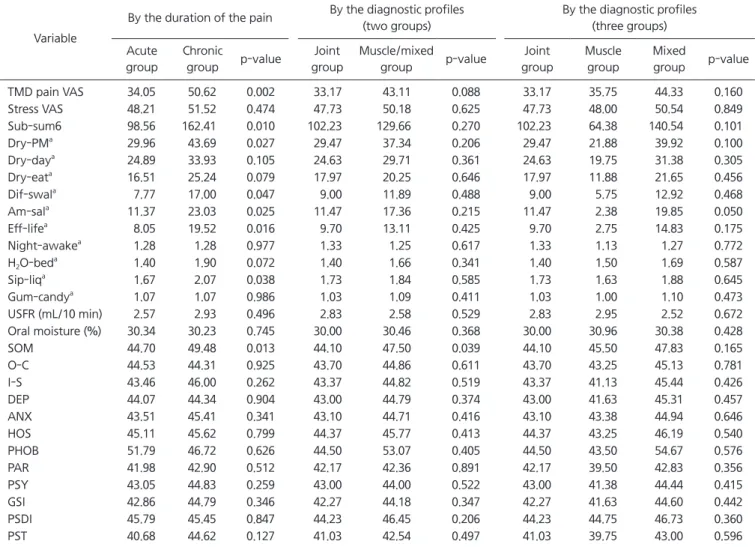
3. Relationship between the Diagnostic TMD Profiles and the Other Factors
The patients who had pain for more than three months (chronic group) had significantly higher TMD pain VAS (p=0.002), Sub-sum6 (p=0.010), Dry-PM (p=0.027), Dif-swal
Table 4. Relationship between the TMD pain VAS and the other factors
Variable
By the mean of TMD pain VAS (n=86)
By the mean of TMD pain VAS (n=58, non-smokers only) Above the
mean group
Below the
mean group p-value Above the
mean group
Below the
mean group p-value
Stress VAS 56.33 42.33 0.003 54.57 40.73 0.015
Sub-sum6 171.47 68.72 0.000 148.25 50.43 0.000
Dry-PM
a49.40 19.79 0.000 42.96 13.63 0.000
Dry-day
a38.86 17.02 0.000 35.89 13.33 0.000
Dry-eat
a27.72 11.19 0.000 23.00 8.63 0.005
Dif-swal
a16.02 5.74 0.009 13.39 3.70 0.016
Am-sal
a21.05 9.56 0.013 17.29 7.53 0.087
Eff-life
a18.42 5.42 0.001 15.71 3.60 0.005
Night-awake
a1.37 1.19 0.240 1.29 1.13 0.213
H
2O-bed
a1.74 1.40 0.180 1.75 1.33 0.214
Sip-liq
a1.93 1.67 0.165 1.89 1.67 0.330
Gum-candy
a1.12 1.02 0.152 1.07 1.00 0.327
USFR (mL/10 min) 2.90 2.43 0.217 2.96 2.39 0.136
Oral moisture (%) 30.28 30.14 0.747 30.47 30.33 0.888
SOM 48.40 44.23 0.023 48.75 43.10 0.028
O-C 45.30 43.60 0.434 45.54 42.50 0.422
I-S 45.40 43.23 0.314 46.57 42.70 0.247
DEP 44.72 43.60 0.604 45.64 42.70 0.379
ANX 45.14 43.16 0.295 46.07 41.43 0.120
HOS 46.70 43.86 0.137 46.29 42.50 0.136
PHOB 47.05 53.12 0.526 47.18 43.03 0.078
PAR 42.72 41.86 0.514 44.18 41.10 0.257
PSY 44.35 42.95 0.348 45.64 41.97 0.305
GSI 44.81 42.21 0.178 45.64 41.00 0.132
PSDI 47.16 44.19 0.073 47.29 43.63 0.105
PST 43.63 40.40 0.155 44.54 38.77 0.115
TMD, temporomandibular disorder; VAS, visual analogue scale; Sub-sum6, the sum of the VAS of six questions to evaluate the degree of dry mouth; USFR, unstimulated salivary flow rate; SOM, somatization; O-C, obsessive-compulsive behavior; I-S, interpersonal sensitivity; DEP, depression; ANX, anxiety; HOS, hostility; PHOB, phobic anxiety; PAR, paranoid ideation; PSY, psychoticism; GSI, global severity index; PSDI, positive symptom distress index; PST, positive symptom total.
Values are presented as mean.
Statistical significant at significant level of p<0.05
a
See Table 1 for the explanation of the abbreviated form.
(p=0.047), Am-sal (p=0.025), Eff-life (p=0.016), sip liquid while swallowing dry foods (Sip-liq, p=0.038), and T-score of SOM (p=0.013) than the acute group. In ANOVA analy- sis of the diagnosis-based three groups (muscle, joint and mixed problem groups), there was a tendency that mixed problem group has higher TMD pain VAS, stress VAS and Sub-sum6 but it was not statistically significant. However, the patients who had muscle components (muscle group and mixed group) had significantly higher scores of SOM (p=0.039) than joint group. There was no significant rela- tionship between the diagnosis of TMDs and the xerostomia related data (Table 5).
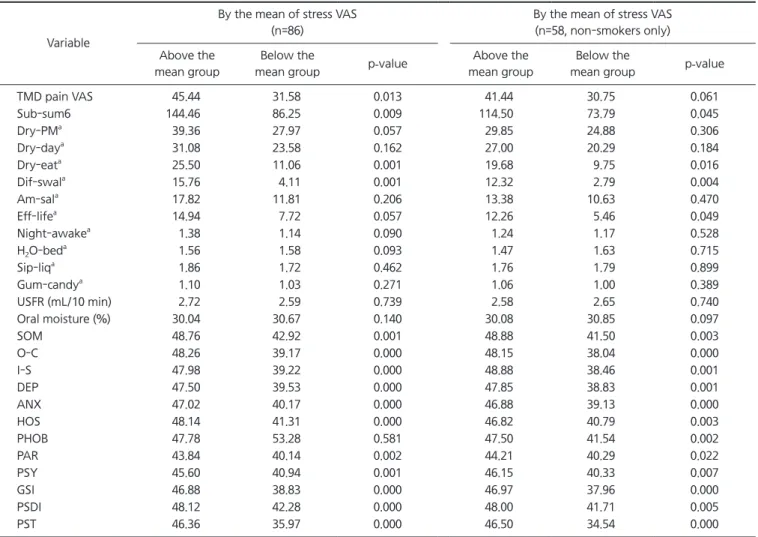
4. Relationship between the Stress VAS, SCL-90R and the Other Factors
We divided the participants into two groups by the mean of each items of SCL-90R and the stress VAS. The patients who had above the mean of the stress VAS had signifi- cantly higher scores on the TMD Pain VAS (p=0.013), Sub- sum6 (p=0.009), Dry-eat (p=0.001), Dif-swal (p=0.001), SOM (p=0.001), O-C (p=0.000), I-S (p=0.000), DEP (p=0.000), ANX (p=0.000), HOS (p=0.000), PAR (p=0.002), PSY (p=0.001), GSI (p=0.000), PSDI (p=0.000), and PST (p=0.000).
Within the non-smoking group, the patients who had above the mean of the stress VAS had significantly higher
Table 5. Relationship between the duration of the pain, the diagnostic profiles and the other factors
Variable
By the duration of the pain By the diagnostic profiles (two groups)
By the diagnostic profiles (three groups) Acute
group
Chronic
group p-value Joint group
Muscle/mixed
group p-value Joint group
Muscle group
Mixed
group p-value
TMD pain VAS 34.05 50.62 0.002 33.17 43.11 0.088 33.17 35.75 44.33 0.160
Stress VAS 48.21 51.52 0.474 47.73 50.18 0.625 47.73 48.00 50.54 0.849
Sub-sum6 98.56 162.41 0.010 102.23 129.66 0.270 102.23 64.38 140.54 0.101
Dry-PM
a29.96 43.69 0.027 29.47 37.34 0.206 29.47 21.88 39.92 0.100
Dry-day
a24.89 33.93 0.105 24.63 29.71 0.361 24.63 19.75 31.38 0.305
Dry-eat
a16.51 25.24 0.079 17.97 20.25 0.646 17.97 11.88 21.65 0.456
Dif-swal
a7.77 17.00 0.047 9.00 11.89 0.488 9.00 5.75 12.92 0.468
Am-sal
a11.37 23.03 0.025 11.47 17.36 0.215 11.47 2.38 19.85 0.050
Eff-life
a8.05 19.52 0.016 9.70 13.11 0.425 9.70 2.75 14.83 0.175
Night-awake
a1.28 1.28 0.977 1.33 1.25 0.617 1.33 1.13 1.27 0.772
H
2O-bed
a1.40 1.90 0.072 1.40 1.66 0.341 1.40 1.50 1.69 0.587
Sip-liq
a1.67 2.07 0.038 1.73 1.84 0.585 1.73 1.63 1.88 0.645
Gum-candy
a1.07 1.07 0.986 1.03 1.09 0.411 1.03 1.00 1.10 0.473
USFR (mL/10 min) 2.57 2.93 0.496 2.83 2.58 0.529 2.83 2.95 2.52 0.672
Oral moisture (%) 30.34 30.23 0.745 30.00 30.46 0.368 30.00 30.96 30.38 0.428
SOM 44.70 49.48 0.013 44.10 47.50 0.039 44.10 45.50 47.83 0.165
O-C 44.53 44.31 0.925 43.70 44.86 0.611 43.70 43.25 45.13 0.781
I-S 43.46 46.00 0.262 43.37 44.82 0.519 43.37 41.13 45.44 0.426
DEP 44.07 44.34 0.904 43.00 44.79 0.374 43.00 41.63 45.31 0.457
ANX 43.51 45.41 0.341 43.10 44.71 0.416 43.10 43.38 44.94 0.646
HOS 45.11 45.62 0.799 44.37 45.77 0.413 44.37 43.25 46.19 0.540
PHOB 51.79 46.72 0.626 44.50 53.07 0.405 44.50 43.50 54.67 0.576
PAR 41.98 42.90 0.512 42.17 42.36 0.891 42.17 39.50 42.83 0.356
PSY 43.05 44.83 0.259 43.00 44.00 0.522 43.00 41.38 44.44 0.415
GSI 42.86 44.79 0.346 42.27 44.18 0.347 42.27 41.63 44.60 0.442
PSDI 45.79 45.45 0.847 44.23 46.45 0.206 44.23 44.75 46.73 0.360
PST 40.68 44.62 0.127 41.03 42.54 0.497 41.03 39.75 43.00 0.596
TMD, temporomandibular disorder; VAS, visual analogue scale; Sub-sum6, the sum of the VAS of six questions to evaluate the degree of dry mouth; USFR, unstimulated salivary flow rate; SOM, somatization; O-C, obsessive-compulsive behavior; I-S, interpersonal sensitivity; DEP, depression; ANX, anxiety; HOS, hostility; PHOB, phobic anxiety; PAR, paranoid ideation; PSY, psychoticism; GSI, global severity index; PSDI, positive symptom distress index; PST, positive symptom total.
Values are presented as mean.
Statistical significant at significant level of p<0.05.
a
See Table 1 for the explanation of the abbreviated form.
scores on Sub-sum6 (p=0.045), Dry-eat (p=0.016), Dif-swal (p=0.004), Eff-life (p=0.049), and all SCL-90R scores (Table 6).
Among SCL-90R items, SOM (p=0.017), O-C (p=0.046), and PSDI (p=0.037) were significantly related to the TMD pain VAS. The patients who had above the mean of O-C (p=0.020), I-S (p=0.025), DEP (p=0.025), ANX (p=0.011), HOS (p=0.008), PAR (p=0.023), GSI (p=0.029), and PSDI (p=0.008) were sig- nificantly higher scores on Sub-sum6. All SCL-90R items were significantly correlated with the stress VAS and p-val- ues were <0.01 (Table 7).
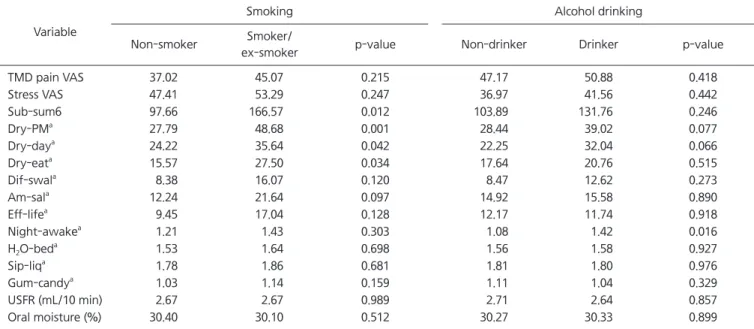
5. Relationship between Smoking, Drinking and the Other Factors
The patients who were non-smokers had significant- ly lower Dry-PM (p=0.001), Dry-day (p=0.042), Dry-eat (p=0.034), and Sub-sum6 (p=0.012) than smokers and pre- vious smokers. Alcohol consumers had significantly higher frequencies on Night-awake (p=0.016) and other factors are not statistically relevant (Table 8).
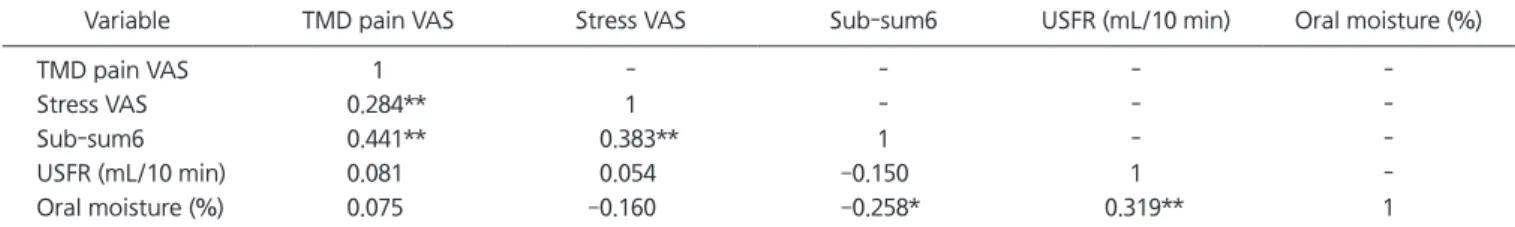
6. Correlation between the Subjective Dry Mouth Symptoms and the Objective Factors of Xerostomia (USFR and Oral Moisture)
Pearson’s correlation coefficient between Sub-sum6 and
Table 6. Relationship between stress VAS and the other factors
Variable
By the mean of stress VAS (n=86)
By the mean of stress VAS (n=58, non-smokers only) Above the
mean group
Below the
mean group p-value Above the
mean group
Below the
mean group p-value
TMD pain VAS 45.44 31.58 0.013 41.44 30.75 0.061
Sub-sum6 144.46 86.25 0.009 114.50 73.79 0.045
Dry-PM
a39.36 27.97 0.057 29.85 24.88 0.306
Dry-day
a31.08 23.58 0.162 27.00 20.29 0.184
Dry-eat
a25.50 11.06 0.001 19.68 9.75 0.016
Dif-swal
a15.76 4.11 0.001 12.32 2.79 0.004
Am-sal
a17.82 11.81 0.206 13.38 10.63 0.470
Eff-life
a14.94 7.72 0.057 12.26 5.46 0.049
Night-awake
a1.38 1.14 0.090 1.24 1.17 0.528
H
2O-bed
a1.56 1.58 0.093 1.47 1.63 0.715
Sip-liq
a1.86 1.72 0.462 1.76 1.79 0.899
Gum-candy
a1.10 1.03 0.271 1.06 1.00 0.389
USFR (mL/10 min) 2.72 2.59 0.739 2.58 2.65 0.740
Oral moisture (%) 30.04 30.67 0.140 30.08 30.85 0.097
SOM 48.76 42.92 0.001 48.88 41.50 0.003
O-C 48.26 39.17 0.000 48.15 38.04 0.000
I-S 47.98 39.22 0.000 48.88 38.46 0.001
DEP 47.50 39.53 0.000 47.85 38.83 0.001
ANX 47.02 40.17 0.000 46.88 39.13 0.000
HOS 48.14 41.31 0.000 46.82 40.79 0.003
PHOB 47.78 53.28 0.581 47.50 41.54 0.002
PAR 43.84 40.14 0.002 44.21 40.29 0.022
PSY 45.60 40.94 0.001 46.15 40.33 0.007
GSI 46.88 38.83 0.000 46.97 37.96 0.000
PSDI 48.12 42.28 0.000 48.00 41.71 0.005
PST 46.36 35.97 0.000 46.50 34.54 0.000
VAS, visual analogue scale; TMD, temporomandibular disorder; Sub-sum6, the sum of the VAS of six questions to evaluate the degree of dry mouth; USFR, unstimulated salivary flow rate; SOM, somatization; O-C, obsessive-compulsive behavior; I-S, interpersonal sensitivity; DEP, depression; ANX, anxiety; HOS, hostility; PHOB, phobic anxiety; PAR, paranoid ideation; PSY, psychoticism; GSI, global severity index; PSDI, positive symptom distress index; PST, positive symptom total.
Values are presented as mean.
Statistical significant at significant level of p<0.05.
a
See Table 1 for the explanation of the abbreviated form.
USFR was very low (–0.150) and not statistically significant (p=0.168). Pearson’s correlation coefficient between USFR and oral moisture was 0.319 and that between Sub-sum6
and oral moisture was –0.258 which means somewhat cor- related (Table 9).
Table 7. Relationship between SCL-90R and the other factors
Variable p-values (differences between above the mean group and below the mean group)
SOM O-C I-S DEP ANX HOS PHOB PAR PSY GSI PSDI PST
TMD pain VAS 0.017 0.046 0.294 0.539 0.159 0.421 0.342 0.436 0.399 0.230 0.037 0.734
Stress VAS 0.002 0.000 0.000 0.000 0.000 0.000 0.001 0.000 0.000 0.000 0.000 0.000
Sub-sum6 0.058 0.020 0.025 0.025 0.011 0.008 0.056 0.023 0.102 0.029 0.008 0.099
Dry-PM
a0.258 0.059 0.194 0.171 0.121 0.015 0.322 0.066 0.292 0.204 0.012 0.470
Dry-day
a0.078 0.098 0.205 0.090 0.042 0.045 0.085 0.286 0.409 0.128 0.004 0.436
Dry-eat
a0.062 0.019 0.010 0.016 0.006 0.018 0.011 0.005 0.075 0.013 0.002 0.053
Dif-swal
a0.106 0.031 0.012 0.016 0.018 0.009 0.046 0.013 0.145 0.021 0.107 0.033
Am-sal
a0.165 0.047 0.036 0.026 0.011 0.014 0.161 0.058 0.154 0.051 0.063 0.115
Eff-life
a0.129 0.055 0.063 0.137 0.044 0.045 0.100 0.136 0.202 0.088 0.132 0.110
Night-awake
a0.068 0.293 0.656 0.950 0.977 0.341 0.236 0.245 0.336 0.716 0.243 0.778
H
2O-bed
a0.235 0.930 0.278 0.608 0.635 0.922 0.263 0.808 0.051 0.326 0.946 0.381
Sip-liq
a0.012 0.117 0.082 0.089 0.018 0.038 0.000 0.052 0.415 0.012 0.045 0.028
Gum-candy
a0.103 0.329 0.298 0.607 0.238 0.238 0.067 0.449 0.449 0.284 0.298 0.271
USFR (mL/10 min) 0.497 0.886 0.684 0.963 0.389 0.924 0.156 0.872 0.178 0.865 0.537 0.705 Oral moisture (%) 0.969 0.378 0.265 0.086 0.204 0.391 0.442 0.475 0.493 0.345 0.609 0.875 SCL-90R, Symptom Checklist-90-Revised; SOM, somatization; O-C, obsessive-compulsive behavior; I-S, interpersonal sensitivity; DEP, depression; ANX, anxiety; HOS, hostility; PHOB, phobic anxiety; PAR, paranoid ideation; PSY, psychoticism; GSI, global severity index; PSDI, positive symptom distress index; PST, positive symptom total; TMD, temporomandibular disorder; VAS, visual analogue scale; Sub-sum6, the sum of the VAS of six questions to evaluate the degree of dry mouth; USFR, unstimulated salivary flow rate.
Statistical significant at significant level of p<0.05.
a
See Table 1 for the explanation of the abbreviated form.
Table 8. Relationship between smoking, alcohol drinking and the other factors
Variable
Smoking Alcohol drinking
Non-smoker Smoker/
ex-smoker p-value Non-drinker Drinker p-value
TMD pain VAS 37.02 45.07 0.215 47.17 50.88 0.418
Stress VAS 47.41 53.29 0.247 36.97 41.56 0.442
Sub-sum6 97.66 166.57 0.012 103.89 131.76 0.246
Dry-PM
a27.79 48.68 0.001 28.44 39.02 0.077
Dry-day
a24.22 35.64 0.042 22.25 32.04 0.066
Dry-eat
a15.57 27.50 0.034 17.64 20.76 0.515
Dif-swal
a8.38 16.07 0.120 8.47 12.62 0.273
Am-sal
a12.24 21.64 0.097 14.92 15.58 0.890
Eff-life
a9.45 17.04 0.128 12.17 11.74 0.918
Night-awake
a1.21 1.43 0.303 1.08 1.42 0.016
H
2O-bed
a1.53 1.64 0.698 1.56 1.58 0.927
Sip-liq
a1.78 1.86 0.681 1.81 1.80 0.976
Gum-candy
a1.03 1.14 0.159 1.11 1.04 0.329
USFR (mL/10 min) 2.67 2.67 0.989 2.71 2.64 0.857
Oral moisture (%) 30.40 30.10 0.512 30.27 30.33 0.899
TMD, temporomandibular disorder; VAS, visual analogue scale; Sub-sum6, the sum of the VAS of six questions to evaluate the degree of dry mouth; USFR, unstimulated salivary flow rate.
Values are presented as mean.
Statistical significant at significant level of p<0.05.
a
See Table 1 for the explanation of the abbreviated form.
DISCUSSION
This study showed that the patients who had higher TMD pain VAS had significantly higher stress VAS, T-score of SOM. In particular, the patients who had chronic TMD pain had higher TMD pain VAS and SOM than the acute group.
The pain intensity can affect the quality of life and can be a stressor itself. In a study with cancer patients, the pain was greater among patients with greater life stress.
20)Moreover, there is a report that depression and SOM in patients with myofascial pain and arthralgia, which have the chronic na- ture of disease, were higher than patients with only disk displacement.
21)In this study, the patients of the higher pain intensity and chronic pain had higher stress and higher SOM and we can assume that the results are consistent with the previous studies.
The patients who had higher TMD pain VAS and chronic TMD pain showed significantly higher subjective dry mouth symptoms, On the other hand, the intensity of TMD pain and the duration of TMD were not significantly correlat- ed with objective data such as USFR and oral moisture. It means that there are discrepancy between objective dry- ness and subjective dry feeling. Regarding the term xero- stomia, Sreebny and Vissink
22)described that dry mouth, or xerostomia is subjective complaints instead of statistical ones and some may complain of oral dryness yet have a normal flow rate, and others may have an abnormally low flow rate of whole saliva and not complain of oral dryness.
Xerostomia may associate not only with objective factors such as salivary flow or oral moisture, but also with psy- chological or neurologic factors. We focused on the find- ings that the duration and the intensity of pain is positively correlated with subjective dry symptoms. In regard to this
result, we found several previous studies suggested the pos- sibilities of association between chronic pain and sensory dysfunction.
23-25)Based on these reports, we could hypoth- esize that continuous chronic pain input may alter the pro- cessing of sensation from the oral mucosa, which might be related to enhanced dry sensation of patients. The concept of central sensitization is widely accepted in the field of pain. Central sensitization is the result of complex processes in the peripheral and central nervous systems. Suggested mechanisms of central sensitization are wind-up, classic heterosynaptic central sensitization, homosynaptic poten- tiation, pre- and post-synaptic transcription changes, and reduction in tonic and phasic inhibition.
26)Among these mechanisms, we assumed that the concept of reduction in tonic and phasic inhibition could be a possible explanation for the relationship between pain severity or duration and subjective oral dryness. If chronic nociceptive input con- tinuously stimulates the peripheral nervous system, it can negatively regulate the central inhibition in the central ner- vous system. The feeling of dryness is a result of processed mechanical sensory input which is modulated in the central nervous system. The patients with chronic pain input such as chronic TMD pain might have dysregulated inhibitory function, which could be a plausible explanation for these findings.
We showed that USFR and oral moisture could not mirror the subjective dry mouth symptoms and they are not sig- nificantly related with the TMD pain VAS, duration of TMD, the stress VAS and SCL-90R in this study. Clinically, USFR is one of the most widely used simple methods diagnos- ing xerostomia. However, discordance between USFR and subjective xerostomia makes diagnostic difficulty. Several studies reported that the salivary fluid thickness, residual
Table 9. Correlation coefficients among the variables
Variable TMD pain VAS Stress VAS Sub-sum6 USFR (mL/10 min) Oral moisture (%)
TMD pain VAS 1 - - - -
Stress VAS 0.284** 1 - - -
Sub-sum6 0.441** 0.383** 1 - -
USFR (mL/10 min) 0.081 0.054 –0.150 1 -
Oral moisture (%) 0.075 –0.160 –0.258* 0.319** 1
TMD, temporomandibular disorder; VAS, visual analogue scale; Sub-sum6, the sum of the VAS of six questions to evaluate the degree of dry mouth; USFR, unstimulated salivary flow rate.
Values are presented as Pearson's correlation coefficient (r). r>0.4 (significantly correlated). 0.2<r<0.4 (somewhat correlated).
*p<0.05, **p<0.01.
saliva, salivary composition, evaporation of saliva, swal- lowing, water flux across the oral mucosa and ion transport properties, besides salivation, can contribute to the sensa- tion of dry mouth.
27-29)In this study, we used oral moisture checking device in addition to USFR as an objective tool.
Oral moisture was positively correlated with USFR and had higher correlation coefficient with the subjective xerosto- mia symptoms than USFR (Table 9). Even if one has enough salivation but there is much more evaporation, then oral moisture could be lowered and it may affect the subjective dry mouth symptoms.
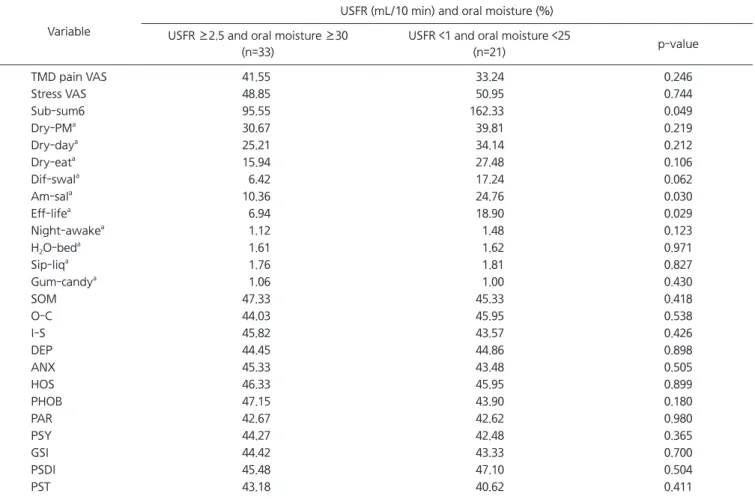
18)Interestingly, the subjects who were shown USFR <1 mL/10 min and oral moisture <25% had significantly higher Sub-sum6 (p=0.049), Am-sal (p=0.030), Eff-life (p=0.029) than the subjects who were shown USFR
≥2.5 mL/10 min and oral moisture ≥30% in this study (Table 10). When we evaluate one’s xerostomia symptoms, the use of at least two objective measurements would be more accurate.
There was a study about the correlation of orofacial pain and xerostomia
12)and it showed the patients who had oro- facial pain had lower salivary flow rate and had more complaints of xerostomia than the normal control group.
However, the diagnosis of orofacial pain was wide-ranged and the medication factor was not excluded, so direct rela- tionship between TMDs and xerostomia was hardly inferred.
In this study, only TMD patients were participated and the medication factor which was considered to be highly re- lated to xerostomia symptoms was all excluded. It showed
Table 10. Relationship salivary flow/oral moisture and the other factors (n=54)
Variable
USFR (mL/10 min) and oral moisture (%) USFR ≥2.5 and oral moisture ≥30
(n=33)
USFR <1 and oral moisture <25
(n=21) p-value
TMD pain VAS 41.55 33.24 0.246
Stress VAS 48.85 50.95 0.744
Sub-sum6 95.55 162.33 0.049
Dry-PM
a30.67 39.81 0.219
Dry-day
a25.21 34.14 0.212
Dry-eat
a15.94 27.48 0.106
Dif-swal
a6.42 17.24 0.062
Am-sal
a10.36 24.76 0.030
Eff-life
a6.94 18.90 0.029
Night-awake
a1.12 1.48 0.123
H
2O-bed
a1.61 1.62 0.971
Sip-liq
a1.76 1.81 0.827
Gum-candy
a1.06 1.00 0.430
SOM 47.33 45.33 0.418
O-C 44.03 45.95 0.538
I-S 45.82 43.57 0.426
DEP 44.45 44.86 0.898
ANX 45.33 43.48 0.505
HOS 46.33 45.95 0.899
PHOB 47.15 43.90 0.180
PAR 42.67 42.62 0.980
PSY 44.27 42.48 0.365
GSI 44.42 43.33 0.700
PSDI 45.48 47.10 0.504
PST 43.18 40.62 0.411
USFR, unstimulated salivary flow rate; TMD, temporomandibular disorder; VAS, visual analogue scale; Sub-sum6, the sum of the VAS of six questions to evaluate the degree of dry mouth; SOM, somatization; O-C, obsessive-compulsive behavior; I-S, interpersonal sensitivity; DEP, depression; ANX, anxiety; HOS, hostility; PHOB, phobic anxiety; PAR, paranoid ideation; PSY, psychoticism; GSI, global severity index; PSDI, positive symptom distress index; PST, positive symptom total.
Values are presented as mean.
Statistical significant at significant level of p<0.05.
a