• 검색 결과가 없습니다.

The Revised Version of the Minnesota Multiphasic Personality Inventory in Korean College Students with Symptoms of Temporomandibular Disorders JOMP

N/A
N/A
Protected

Academic year: 2021

Share "The Revised Version of the Minnesota Multiphasic Personality Inventory in Korean College Students with Symptoms of Temporomandibular Disorders JOMP"

Copied!
9
0
0

로드 중.... (전체 텍스트 보기)

전체 글

(1)

pISSN 2288-9272 eISSN 2383-8493 J Oral Med Pain 2019;44(1):16-24 https://doi.org/10.14476/jomp.2019.44.1.16

The Revised Version of the Minnesota Multiphasic Personality Inventory in Korean College Students with Symptoms of Temporomandibular Disorders

Hye Sook Park

Department of Dental Technology, Shingu College, Seongnam, Korea

Received February 11, 2019 Revised March 19, 2019 Accepted March 19, 2019

Purpose: The purpose of this study was to assess the association of personality characteris- tics with temporomandibular disorders (TMDs).

Methods: Four hundred and fifty one college students in Gyeonggi-do completed the re- vised version of the Minnesota Multiphasic Personality Inventory (MMPI-2) and a question- naire and collected data were analyzed by IBM SPSS Statistics ver. 25.0 software (IBM Co., Armonk, NY, USA).

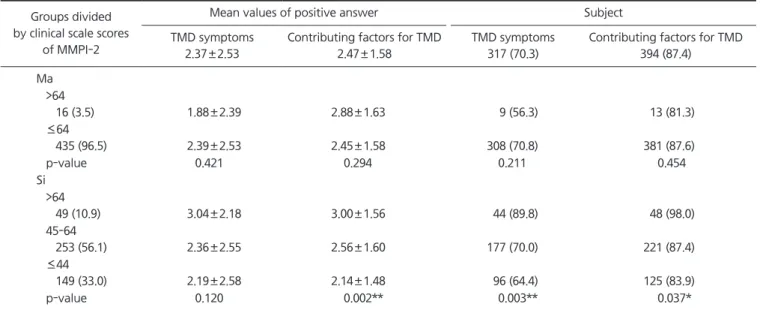
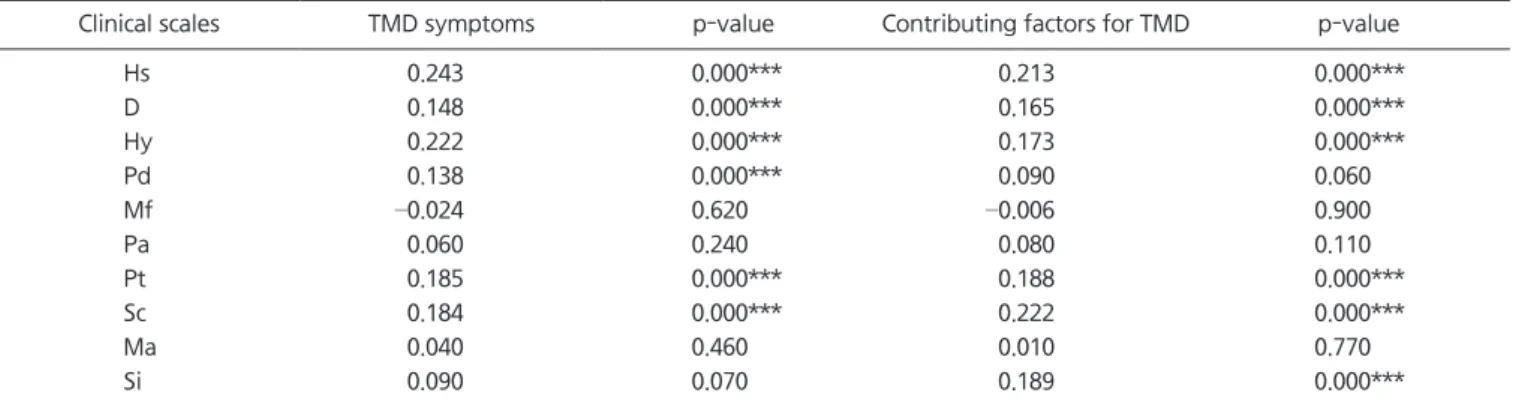
Results: Mean values of the number of positive answers of TMD symptoms were signifi- cantly higher in higher scorers on hypochondriasis (Hs), depression (D), paranoia (Pa) (Hs>60, D>64, Pa>59) (p<0.01). Higher scorers on Hs, hysteria (Hy), schizophrenia (Sc), Pa, psychas- thenia (Pt) (Hy>64, Sc>64, Pt>64) exhibited significantly higher mean values of the number of positive answers of contributing factors for TMD (p<0.01, p<0.001). Low scorers on social introversion (Si≤44) exhibited significantly lower mean value of the number of positive answers of contributing factors for TMD than high or moderate scorers on Si (Si>64, 45- 64) (p<0.01, p<0.05). The percentage of subjects who responded that they had at least one TMD symptom was significantly higher in higher scorers on Hs, Pt, D (p<0.05, p<0.01). The significantly higher percentage of higher scorers on D, Pa reported at least one contributing factor for TMD (p<0.05). The percentage of subjects who responded that they had at least one TMD symptom or one contributing factor for TMD was significantly different among three groups divided by T-score on Si (p<0.01, p<0.05). T-scores of Hs, D, Hy, Pt and Sc showed significant correlation with the numbers of TMD symptoms and contributing factors for TMD, respectively (p<0.001). A correlation was found between T-score of Pd and the number of TMD symptoms (p<0.001). T-score of Si correlated to the number of contributing factors for TMD (p<0.001).

Conclusions: Most clinical scales of MMPI-2 were found to be related to TMD. Psychologi- cal assessment including MMPI-2 may play a role in predicting treatment outcome and planning treatment of TMD.

Key Words: Contributing factor for temporomandibular disorder; Minnesota Multiphasic Personality Inventory-2; Personality; Temporomandibular disorder symptom

Correspondence to:

Hye Sook Park

Department of Dental Technology, Shingu College, 377 Gwangmyeong-ro, Seongnam 13174, Korea

Tel: +82-31-740-1575 Fax: +82-31-740-1589 E-mail: [email protected]

https://orcid.org/0000-0002-2981-3908 This study was supported by SCK

(Specialized College of Korea) of the Ministry of Education in 2018.

JOMP

Journal of Oral Medicine and Pain

Copyright Ⓒ 2019 Korean Academy of Orofacial Pain and Oral Medicine. All rights reserved.

CC This is an open-access article distributed under the terms of the Creative Commons Attribution Non-Commercial License (http://creativecommons.org/licenses/by-nc/4.0/), which permits unrestricted non-commercial use, distribution, and reproduction in any medium, provided the original work is properly cited.

INTRODUCTION

Temporomandibular disorders (TMDs) exhibit various symptoms encompassing pain of temporomandibular joint

(TMJ) and muscles of head and neck, joint sound during

mandibular movement, limitation of mandibular movement

[1,2]. Although TMD symptoms spread throughout in all

ages, they occur mostly in the 20 to 40 years old population

(2)

[3-5].

TMD have been associated with major etiologic factors, such as occlusal condition, trauma, parafunctional activities, deep pain input and emotional stress [6]. Parafunctional activities and factors that contribute to the initiation and progress of TMD symptoms are as follows: teeth clench- ing, teeth grinding, a habit of biting lips, cheeks, nails or pencils, a habit of resting the cheek on one hand, unilateral chewing, gum chewing, and insomnia, etc [7].

Psychological profiles have been largely evaluated to as- sess the multifactorial nature of TMD [8]. Although stud- ies have indicated that patients with TMD demonstrate increased somatization, stress, anxiety, and depression relative to healthy controls, conflicting evidence still ex- ists [9-11]. Several psychometric instruments, such as the Minnesota Multiphasic Personality Inventory (MMPI), the Symptom Checklist-90-Revised (SCL-90-R) and the Social Readjustment Rating Scale have been used to assess the psychological status of patients with TMD. MMPI in its re- vised form (MMPI-2) is one of the most widely used self- report inventories [12]. Michelotti et al. [8] analysed psy- chological profiles of fifty chronic TMD patients by means of MMPI test. The comparison of the personality profile be- tween chronic migraine and chronic tension-type headache was made using MMPI-2 [13]. Fishbain et al. [14] showed that some elevated MMPI scale scores reduced after suc- cessful treatments in patients with headache and craniofa- cial pain.

Hence, current study has been performed aiming to ana- lyze results of MMPI-2 of college students with TMD symp- toms and to assess the association of personality character- istics with TMD.

MATERIALS AND METHODS

This study is approved by the Institutional Review Board of Shingu College (IRB no. 2018-101) and informed consent was obtained.

1. Subjects

Data were collected from four hundred and fifty one col- lege students in Gyeonggi-do, including eighty three men and three hundred and sixty eight women. Mean age of the

subjects was 19.98±3.51 years (Table 1).

2. Psychological Evaluation

The Korean MMPI-2 version includes 567 true/false questions with normative data calibrated with a Korean reference population. It has three validity scales (L=lie, F=infrequency, K=correction) and ten clinical scales. Every clinical scale concerns a particular psychological aspect:

hypochondriasis (Hs), depression (D), hysteria (Hy), psycho- pathic deviation (Pd), masculinity-femininity (Mf), paranoia (Pa), psychasthenia (Pt), schizophrenia (Sc), hypomania (Ma), social introversion (Si) [8,12].

3. Data Collection

Data were obtained from May to December of 2018. A questionnaire (Appendix 1) consisted of 18 items, among which 10 items (from item number 1 to item number 10) in- dicated TMD symptoms and 8 items (from item number 11 to item number 18) related to contributing factors for TMD.

It was formed referring to a questionnaire [15] recommend- ed by the American Academy of Orofacial Pain and a meth- od devised by Nilner [16]. Visiting a classroom, an exam- iner explained each item of the questionnaire and asked the students to answer it by self-evaluation and retrieved the completed answers at their classroom. Moreover, a psychol- ogist administered MMPI-2 to the students and calculated T-scores. Collected response data were recorded in an Excel file.

4. Statistical Analyses

All the statistical analyses were performed by IBM SPSS Statistics ver. 25.0 software (IBM Co., Armonk, NY, USA).

Student’s t-test was performed to compare mean values of the number of positive answers of TMD symptoms and con- tributing factors for TMD according to the range of T-scores on Hs, D, Hy, Pd, Pa, Pt, Sc and Ma clinical scales. One way

Table 1. Demographics of the subjects

Gender Subject Age (y)

Men 83 (18.4) 22.48±4.11

Women 368 (81.6) 19.42±3.09

Total 451 (100.0) 19.98±3.51

(3)

Table 2. Prevalence and mean values of positive answers of TMD symptoms and contributing factors for TMD according to the range of T-score on ten clinical scales of MMPI-2 (n=451)

Groups divided by clinical scale scores

of MMPI-2

Mean values of positive answer Subject

TMD symptoms 2.37±2.53

Contributing factors for TMD 2.47±1.58

TMD symptoms 317 (70.3)

Contributing factors for TMD 394 (87.4)

Hs >60

31 (6.9) 3.71±2.55 3.29±1.83 28 (90.3) 30 (96.8)

≤60

420 (93.1) 2.28±2.50 2.41±1.54 289 (68.8) 364 (86.7)

p-value 0.002** 0.003** 0.011* 0.102

D >64

29 (6.4) 3.90±2.41 3.00±1.46 28 (96.6) 29 (100.0)

≤64

422 (93.6) 2.27±2.50 2.43±1.58 289 (68.5) 365 (86.5)

p-value 0.001** 0.060 0.001** 0.034*

Hy >64

15 (3.3) 3.2±2.65 3.60±1.50 13 (86.7) 14 (93.3)

≤64

436 (96.7) 2.35±2.52 2.43±1.57 304 (69.7) 380 (87.2)

p-value 0.199 0.005** 0.158 0.479

Pd >64

8 (1.8) 2.50±2.07 3.25±1.58 7 (87.5) 7 (87.5)

≤64

443 (98.2) 2.37±2.54 2.45±1.58 310 (70.0) 387 (87.4)

p-value 0.888 0.157 0.282 0.991

Mf >64

27 (6.0) 2.41±2.47 2.44±1.31 19 (70.4) 24 (88.9)

45-64

216 (47.9) 2.40±2.58 2.45±1.63 152 (70.4) 188 (87.0)

≤44

208 (46.1) 2.35±2.49 2.49±1.56 146 (70.2) 182 (87.5)

p-value 0.976 0.976 0.999 0.960

Pa >59

51 (11.3) 3.37±2.88 3.55±1.53 39 (76.5) 50 (98.0)

≤59

400 (88.7) 2.25±2.45 2.33±1.53 278 (69.5) 344 (86.0)

p-value 0.003** 0.000*** 0.305 0.015*

Pt >64

42 (9.3) 3.02±2.32 3.40±1.80 36 (85.7) 39 (92.9)

≤64

409 (90.7) 2.31±2.54 2.37±1.52 281 (68.7) 355 (86.8)

p-value 0.080 0.000*** 0.022* 0.260

Sc >64

19 (4.2) 2.84±2.71 3.68±1.46 15 (78.9) 18 (94.7)

≤64

432 (95.8) 2.35±2.52 2.41±1.56 302 (69.9) 376 (87.0)

p-value 0.411 0.001** 0.399 0.323

(4)

ANOVA and Tukey post hoc analysis were implemented to compare mean values of the number of positive answers of TMD symptoms and contributing factors for TMD accord- ing to the range of T-scores on Mf and Si clinical scales.

The Pearson’s Chi-square test was applied to compare self- reporting prevalence rate of TMD symptoms and contribut- ing factors for TMD according to the range of T-scores on ten clinical scales of MMPI-2. Pearson’s correlations were employed to evaluate the relation between T-scores on ten clinical scales of MMPI-2 and the numbers of TMD symp- toms and contributing factors for TMD, The significance level was set to 5% (p<0.05).

RESULTS

The mean value of the number of symptoms to which subjects answered positively among 10 items (from item number 1 to item number 10) indicating TMD symptoms on the questionnaire (Appendix 1) was 2.37±2.53. The mean value of the number of factors to which subjects re- sponded positively among 8 items (from item number 11 to item number 18) related to contributing factors for TMD

was 2.47±1.58. Mean values of the number of positive an- swers of TMD symptoms were significantly higher in the group with high T-score on Hs, D and Pa scales (Hs>60, D>64, Pa>59) than in the group with low T-score on Hs, D and Pa scales (Hs≤60, D≤64, Pa≤59) (p<0.01). Subjects with high T-score on Hs, Hy, Sc, Pa and Pt scales (Hy>64, Sc>64, Pt>64) exhibited significantly higher mean values of the number of positive answers of contributing factors for TMD than subjects with low T-score on Hs, Hy, Sc, Pa and Pt scales (Hy≤64, Sc≤64, Pt≤64) (p<0.01, p<0.001) (Table 2). Subjects with low T-score on Si scale (Si≤44) exhibited significantly lower mean value of the number of positive answers of contributing factors for TMD than subjects with high or moderate T-score on Si scale (Si>64, 45-64) (p<0.01, p<0.05) (Table 3).

Three hundred and seventeen subjects (317, 70.3%) in this study showed at least one of TMD symptoms and three hundred and ninety four subjects (394, 87.4%) had at least one of contributing factors for TMD. The percent- age of subjects who responded that they had at least one TMD symptom was significantly higher in the group with high T-score than with low T-score on Hs, Pt and D scales

Table 2. Continued Groups divided by clinical scale scores

of MMPI-2

Mean values of positive answer Subject

TMD symptoms 2.37±2.53

Contributing factors for TMD 2.47±1.58

TMD symptoms 317 (70.3)

Contributing factors for TMD 394 (87.4)

Ma >64

16 (3.5) 1.88±2.39 2.88±1.63 9 (56.3) 13 (81.3)

≤64

435 (96.5) 2.39±2.53 2.45±1.58 308 (70.8) 381 (87.6)

p-value 0.421 0.294 0.211 0.454

Si >64

49 (10.9) 3.04±2.18 3.00±1.56 44 (89.8) 48 (98.0)

45-64

253 (56.1) 2.36±2.55 2.56±1.60 177 (70.0) 221 (87.4)

≤44

149 (33.0) 2.19±2.58 2.14±1.48 96 (64.4) 125 (83.9)

p-value 0.120 0.002** 0.003** 0.037*

TMD, temporomandibular disorder; MMPI-2, the revised version of the Minnesota Multiphasic Personality Inventory; Hs, hypochondriasis;

D, depression; Hy, hysteria; Pd, psychopathic deviation; Mf, masculinity-femininity; Pa, paranoia; Pt, psychasthenia; Sc, schizophrenia; Ma, hypomania; Si, social introversion.

Values are presented as number (%) or mean±standard deviation.

The p-values were completed by chi-square test for prevalence. The p-values were completed by Student’ s t-test for mean values on Hs, D, Hy, Pd, Pa, Pt, Sc, and Ma clinical scales. The p-values were completed by one way ANOVA for mean values on Mf and Si clinical scales.

*p<0.05, **p<0.01, ***p<0.001.

(5)

(p<0.05, p<0.01) (Table 2). The significantly higher percent- age of subjects in the group with high T-score than with low T-score on D and Pa scales reported at least one con- tributing factor for TMD (p<0.05) (Table 2). The percentage of subjects who responded that they had at least one TMD symptom or one contributing factor for TMD was signifi- cantly different among three groups divided by T-score on Si scale (p<0.01, p<0.05) (Table 2).

Pearson’s correlation coefficients for ten clinical scales of MMPI-2 are given in Table 4. T-scores of Hs, D, Hy, Pt and Sc scales showed significant correlation with the num- bers of TMD symptoms and contributing factors for TMD, respectively (p<0.001). A correlation was found between T-score of Pd scale and the number of TMD symptoms (p<0.001). T-score of Si scale correlated to the number of

contributing factors for TMD (p<0.001).

DISCUSSION

The relationship between TMD and personality charac- teristics is controversial. Mongini et al. [17] showed that patients with TMJ intracapsular disorders had a normal personality profile by means of MMPI data. The personal- ity profile did not differ between the group of myofascial pain and the group of TMJ articular disorders in MMPI scales [8]. On the contrary, TMD patients scored significant- ly higher on Hs and Hy among MMPI scales when com- pared with the controls [18]. Patients with TMJ dysfunc- tion had significantly higher T-scores on Hs, D, Hy, Pt and Sc among MMPI scales than control group [19]. This report

Table 3. Tukey post hoc analysis on mean values of positive answers of contributing factors for TMD among three groups divided by T-score on Si scale (n=451)

I J Difference (I-J) STD p-value 95% CI

Upper limit Lower limit Si

>64 45-64 0.443 0.243 0.164 –0.13 1.01

≤44 0.859* 0.257 0.003** 0.26 1.46

45-64 >64 –0.443 0.243 0.164 –1.01 0.13

≤44 0.416* 0.161 0.027* 0.04 0.79

≤44 >64 –0.859* 0.257 0.003** –1.46 –0.26

45-64 –0.416* 0.161 0.027* –0.79 –0.04

TMD, temporomandibular disorder; Si, social introversion; STD, standard deviation; CI, confidence interval.

The p-values were completed by Tukey post hoc test.

*p<0.05, **p<0.01.

Table 4. Correlation between ten clinical scales of MMPI-2 and TMD symptoms and contributing factors for TMD (n=451)

Clinical scales TMD symptoms p-value Contributing factors for TMD p-value

Hs 0.243 0.000*** 0.213 0.000***

D 0.148 0.000*** 0.165 0.000***

Hy 0.222 0.000*** 0.173 0.000***

Pd 0.138 0.000*** 0.090 0.060

Mf –0.024 0.620 –0.006 0.900

Pa 0.060 0.240 0.080 0.110

Pt 0.185 0.000*** 0.188 0.000***

Sc 0.184 0.000*** 0.222 0.000***

Ma 0.040 0.460 0.010 0.770

Si 0.090 0.070 0.189 0.000***

MMPI-2, the revised version of the Minnesota Multiphasic Personality Inventory; TMD, temporomandibular disorder; Hs, hypochondriasis;

D, depression; Hy, hysteria; Pd, psychopathic deviation; Mf, masculinity-femininity; Pa, paranoia; Pt, psychasthenia; Sc, schizophrenia; Ma, hypomania; Si, social introversion.

The p-values were completed by Pearson’ s correlation analysis.

***p<0.001.

(6)

is consistent with the present result that T-scores on Hs, D, Hy, Pt and Sc showed significant correlation with the num- bers of TMD symptoms and contributing factors for TMD.

Using Eysenck Personality Questionnaire (EPQ), Southwell et al. [20] demonstrated that TMJ patients scored signifi- cantly higher on neuroticism scale when compared with controls. Elevated values of the neurotic triad scales (Hs, D, and Hy) in MMPI have been reported for TMD [21,22].

Similarly, in current study, mean values of the number of positive answers of TMD symptoms were significantly high- er in high scorers than low scorers on Hs and D scales. High scorers than low scorers on Hs and Hy scales exhibited sig- nificantly higher mean values of the number of positive an- swers of contributing factors for TMD. The neurotic person- ality shows a higher psychic tension and a low stress toler- ance [8].

Gerschman et al. [23] identified seventeen percent of TMD patients as having severe anxiety. Anxiety has been pro- posed as a cause of TMD through oral habits and increased muscle tension [24]. Bruxism group showed significantly higher T-scores on obsessive-compulsive (O-C) and anxi- ety (ANX) scales as compared with the control group using the SCL-90-R test [25]. High scorers on Pt scale in MMPI- 2 tend to be anxious, tense, fearful, and apprehensive [26].

These findings explain the present result that higher scor- ers on Pt scale exhibited significantly higher mean values of the number of positive answers of contributing factors for TMD and that the percentage of subjects who responded that they had at least one TMD symptom was significantly higher in higher scorers on Pt scale.

Chung et al. [27] reported that 45.3% of 203 patients with TMJ dysfunction thought their own character sensi- tive. Forty three TMD patients showed significantly higher scores on hostility (HOS) scale as compared to the controls by means of the SCL-90-R [18]. High scorers on Pa scale in MMPI-2 tend to be excessively sensitive and commonly exhibit HOS [26]. These studies are supportive of the result that mean values of the number of positive answers of TMD symptoms and contributing factors for TMD were signifi- cantly higher in higher scorers on Pa scale and that the sig- nificantly higher percentage of higher scorers on Pa scale reported at least one contributing factor for TMD.

Administering the SCL-90-R to 138 TMJ patients, Ko et

al. [28] suggested that they scored significantly higher on psychoticism (PSY) scale than healthy individuals. Women patients with facial pain disorders showed high tendency to PSY in MMPI-2 [29]. High scorers on Sc scale in MMPI- 2 may have a psychotic disorder and feel insecure, inferior and dissatisfied [26]. These findings are similar with the re- sult that higher scorers on Sc scale exhibited significantly higher number of positive answers of contributing factors for TMD.

It was reported that contributing factors for TMD includ- ing teeth clenching occurred more frequently in introverts than extroverts [30]. TMJ patients were significantly more introverted than conrtols in EPQ [20]. High scorers on Si scale in MMPI-2 are socially introverted and tend to worry, to be irritable, and to feel anxious [26]. These reports are in accord with the current result that lower scorers on Si scale exhibited significantly lower number of positive an- swers of contributing factors for TMD and that the percent- age of subjects who responded that they had at least one TMD symptom or one contributing factor for TMD was sig- nificantly different according to the range of T-score on Si scale.

In conclusion, most clinical scales of MMPI-2 were found to be related to TMD, Psychological assessment including MMPI-2 may play a role in predicting treatment outcome and planning treatment of TMD.

CONFLICT OF INTEREST

No potential conflict of interest relevant to this article was reported.

ORCID

Hye Sook Park

https://orcid.org/0000-0002-2981-3908

REFERENCES

1. Bell WE. Temporomandibular disorders: classification, diagnosis and management 3rd ed. Chicago: Year Book Medical Publishers;

1990. pp. 166-176.

2. Clark GT, Solberg WK. Perspectives in temporomandibular disor-

(7)

ders. Chicago: Quintessence; 1987. pp. 13.

3. De Kanter RJ, Truin GJ, Burgersdijk RC, et al. Prevalence in the Dutch adult population and a meta-analysis of signs and symp- toms of temporomandibular disorder. J Dent Res 1993;72:1509- 1518.

4. Von Korff M, Dworkin SF, Le Resche L, Kruger A. An epidemio- logic comparison of pain complaints. Pain 1988;32:173-183.

5. Dworkin SF, LeResche L, Von Korff MR. Diagnostic studies of temporomandibular disorders: challenges from an epidemiologic perspective. Anesth Prog 1990;37:147-154.

6. Okeson JP. Management of temporomandibular disorders and oc- clusion. 6th ed. Amsterdam: Elsevier Mosby; 2007. pp. 141-156.

7. Kim KS. Factors contributing to temporomandibular disorders. J Korean Dent Assoc 1991;29:354-358.

8. Michelotti A, Martina R, Russo M, Romeo R. Personality charac- teristics of temporomandibular disorder patients using M.M.P.I.

Cranio 1998;16:119-125.

9. Pankhurst CL. Controversies in the aetiology of temporoman- dibular disorders. Part 1. Temporomandibular disorders: all in the mind? Prim Dent Care 1997;4:25-30.

10. McKinney MW, Londeen TF, Turner SP, Levitt SR. Chronic TM disorder and non-TM disorder pain: a comparison of behavioral and psychological characteristics. Cranio 1990;8:40-46.

11. Robin O. Tooth clenching as a risk factor for temporomandibular disorders. Int J Stomatol Occlusion Med 2012;5:1-9.

12. Kim MJ, Lim MJ, Park WK, Kho HS. Comparison between the SCL-90-R and MMPI in TMD patients with psychological prob- lems. Oral Dis 2012;18:140-146.

13. Mongini F, Rota E, Deregibus A, Mura F, Francia Germani A, Mongini T. A comparative analysis of personality profile and muscle tenderness between chronic migraine and chronic ten- sion-type headache. Neurol Sci 2005;26:203-207.

14. Fishbain DA, Cole B, Cutler RB, Lewis J, Rosomoff HL, Rosomoff RS. Chronic pain and the measurement of personality: do states influence traits? Pain Med 2006;7:509-529.

15. McNeill C; American Academy of Orofacial Pain. Temporoman- dibular disorders: guidelines for classification, assessment, and management. 2nd ed. Chicago: Quintessence Publishing Co.;

1993. pp. 62.

16. Nilner M. Prevalence of functional disturbances and diseases of the stomatognathic system in 15-18 year olds. Swed Dent J 1981;5:189-197.

17. Mongini F, Ciccone G, Ibertis F, Negro C. Personality charac- teristics and accompanying symptoms in temporomandibular joint dysfunction, headache, and facial pain. J Orofac Pain 2000;14:52-58.

18. Mutlu N, Herken H, Guray E, Oz F, Kalayci A. Evaluation of the prevalence of temporomandibular joint disorder syndrome in dental school students with psychometric analysis. Turk J Med Sci 2002;32:345-350.

19. Ko MY, Kim YK. A study on personality traits of the patients with TMJ dysfunction through the MMPI. Korean J Oral Med 1985;10:17-31.

20. Southwell J, Deary IJ, Geissler P. Personality and anxiety in temporomandibular joint syndrome patients. J Oral Rehabil 1990;17:239-243.

21. Lupton DE. Psychological aspects of temporomandibular joint dysfunction. J Am Dent Assoc 1969;79:131-136.

22. Parker MW, Holmes EK, Terezhalmy GT. Personality characteris- tics of patients with temporomandibular disorders: diagnostic and therapeutic implications. J Orofac Pain 1993;7:337-344.

23. Gerschman JA, Wright JL, Hall WD, Reade PC, Burrows GD, Holwill BJ. Comparisons of psychological and social factors in patients with chronic oro-facial pain and dental phobic disorders.

Aust Dent J 1987;32:331-335.

24. Rugh JD, Woods BJ, Dahlström L. Temporomandibular disorders:

assessment of psychological factors. Adv Dent Res 1993;7:127- 136.

25. Jeung JO. (A) Study on psychological characteristics of T.M.J.

pain and dysfunction using SCL-90-R [Master’s Thesis]. Gwangju:

Chosun University; 1986.

26. Graham JR. MMPI-2 : assessing personality and psychopathol- ogy. 5th ed. New York: Oxford University Press; 2011. pp. 63-91.

27. Chung SC, Ko MY, Kim YJ. A study on the background vari- able in the patients with TMJ dysfunction. Korean J Oral Med 1983;8:69-76.

28. Ko MY, Kim CJ, Lim YH. Personality characteristics of TMJ pa- tients through the SCL-90-R. Pusan Univ Dent J 1986;3:27-35.

29. Mongini F, Barbalonga E, Raviola F. The MMPI-2 in women with headache or facial pain. A comparative study. J Headache Pain 2000;2:105-110.

30. Park HS. Personality type test (MBTI) of Korean college students

with symptoms of temporomandibular disorders. Korean J Oral

Med 2011;36:25-37.

(8)

Appendix 1. Form and contents of questionnaire.

QUESTIONNAIRE

Name of College : Name of Department : Grade :

Name : Gender :

Please answer the following questions by checking the one answer which describes you.

1. Have you ever had pain in your jaw joint when you opened your mouth wide?

1) Yes 2) No

2. Has your jaw ever been caught or locked during certain jaw movements?

1) Yes 2) No

3. Have you ever felt pain or discomfort in your jaw during speech or chewing?

1) Yes 2) No

4. Do you hear sound in your jaw joint when you open or close your mouth?

1) Yes 2) No

5. Do you frequently feel stiffness or fatigue in your jaw?

1) Yes 2) No

6. Do you have pain in your ear, temple or cheek?

1) Yes 2) No

7. Do you suffer from frequent headache?

1) Yes 2) No

8. Has your jaw ever been stiff or painful when you woke up in the morning?

1) Yes 2) No

9. Do you find it uncomfortable to bite your teeth hard together?

1) Yes 2) No

10. Have you ever been treated for jaw problem?

1) Yes 2) No

11. Have you ever experienced trauma in head, neck or jaw?

1) Yes 2) No

(9)

12. Do you habitually clench your teeth ? 1) Yes 2) No

13. Have you ever ground your teeth during sleep or heard that you were a bruxer?

1) Yes 2) No

14. Do you usually chew food only on one side?

1) Yes 2) No

15. Do you use chewing gum frequently?

1) Yes 2) No

16. Do you habitually rest the cheek on your hand?

1) Yes 2) No

17. Are you in the habit of biting lips, cheeks, nails or pencils?

1) Yes 2) No

18. Have you difficulty initiating or maintaining sleep at night or nonrestorative sleep?

1) Yes 2) No

Thank you for your cooperation.

수치

Table 1. Demographics of the subjects
Table 2. Prevalence and mean values of positive answers of TMD symptoms and contributing factors for TMD according to the range of  T-score on ten clinical scales of MMPI-2 (n=451)
Table 2. Continued Groups divided  by clinical scale scores
Table 4. Correlation between ten clinical scales of MMPI-2 and TMD symptoms and contributing factors for TMD (n=451)

참조

관련 문서