pISSN 2288-9272 eISSN 2383-8493 J Oral Med Pain 2015;40(2):55-62 http://dx.doi.org/10.14476/jomp.2015.40.2.55
Age Differences in Signs and Symptoms of Patients with Temporomandibular Disorders
Jung Hwan Jo, Ji Woon Park, Ji Rak Kim, Hyong Duk Seo, Ji Hee Jang, Jin Woo Chung
Department of Oral Medicine and Oral Diagnosis, School of Dentistry and Dental Research Institute, Seoul National University, Seoul, Korea
Received March 10, 2015 Revised March 20, 2015 Accepted April 3, 2015
Purpose: The aims of this study were to evaluate the differences in subjective symptoms, clini- cal characteristics, distribution according to Research Diagnostic Criteria for Temporomandibu- lar Disorders (RDC/TMD) subgroup, psychological profile of TMD patients, and to identify the prevalence and trend according to age.
Methods: A total of 1,052 patients (261 men and 791 women; mean age, 34.40±15.73 years) who visited the Orofacial Pain Clinic of the Department of Oral Medicine, Seoul National Uni- versity Dental Hospital complaining of TMD symptoms of were evaluated. All patients were questioned for medical history, clinical symptoms and contributing factors. Clinical examina- tion and patient grouping based on RDC/TMD was conducted. Radiographies were taken. The Korean version of RDC/TMD axis II and Symptom Checklist-90-Revision (SCL-90-R) were ad- ministered to evaluate pain-related disability level and psychological status of the patients.
Results: Prevalence peaked in the 20-year-old age group. There were more women than men in all groups. The highest T-score among SCL-90-R dimensions was somatization in each group, except for teenagers who showed the highest T-score in interpersonal sensitivity. The 30-year- old age group showed the highest distribution of high disability based on the graded chronic pain scale. Age was positively associated with pain intensity (r=0.100), number of positive muscles on palpation (r=0.137) and negatively associated with maximum mouth opening (r=-0.168).
Conclusions: Subjective symptoms and clinical characteristics of TMD patients show distinct tendencies according to different age groups. Treatment should be customized and personalized according to age for efficient symptom resolution and patient satisfaction.
Key Words: Age; Graded chronic pain; Research Diagnostic Criteria for Temporomanibular Disorders; Symptom Checklist-90-Revision; Temporomandibular joint disorders
Correspondence to:
Jin Woo Chung
Orofacial Pain Clinic, Department of Oral Medicine and Oral Diagnosis, School of Dentistry and Dental Research Institute, Seoul National University, 101 Daehak-ro, Jongno- gu, Seoul 110-749, Korea Tel: +82-2-2072-3021 Fax: +82-2-744-9135 E-mail: [email protected]
JOMP
Journal of Oral Medicine and PainCopyright Ⓒ 2015 Korean Academy of Orofacial Pain and Oral Medicine. All rights reserved.
CC This is an open-access article distributed under the terms of the Creative Commons Attribution Non-Commercial License (http://creativecommons.org/licenses/by-nc/4.0/),
INTRODUCTION
Temporomandibular disorders (TMD) are considered the most common chronic pain syndrome of the orofacial re- gion. TMD are characterized by temporomandibular joint (TMJ) pain, sounds and disturbance of jaw movement. TMD symptoms are commonly accompanied by comorbidities such as headache, neck and shoulder pain, and otologic
symptoms.
1-3)Early epidemiologic studies have shown that 1% to 75%
of the general population had at least one objective TMD sign, and that 5% to 33% reported subjective symptoms of TMD.
4)To reach an accurate diagnosis and increase the reli-
ability of research based on common forms of muscle and
joint originating TMD symptoms, the Research Diagnostic
Criteria for Temporomandibular Disorders (RDC/TMD) was newly developed in 1992 by Dworkin and LeResche.
5)This system applies a dual axis diagnostic approach which are based on clinical conditions (axis I) and pain-related dis- ability level and psychological status (axis II) for diagnosing and classifying TMD patients. A recent systematic review reported that the prevalence of TMD diagnosed according to RDC/TMD was 6% to 13.3% for group I (muscle disor- der), 8.9% to 11.4% for group II (joint disorder), and up to 8.9% for group III (arthritis/arthrosis) diagnoses in the gen- eral population.
6)TMD is generally regarded as a multifactorial disorder.
The etiology of TMD is complex and social, psychological and physical factors may contribute to the initiation and prolongation of the disease. However the precise mecha- nism and pathophysiology still remains unclear. The com- ponents and function of the TMJ are known to change with natural aging.
7)As the community is transforming into an aging society the commonly accepted signs and symptoms of TMD are meant to change and are becoming more com- plex. This change can be sought in both younger and older patient groups.
In adolescents between 12 and 18 years of age, joint sounds were recorded in 11% of the subjects, with mandibu- lar fatigue and stiffness in 3%.
8)Joint sounds were observed in only 7% of the young patients, orofacial pain in 7%, TMJ pain in 16%, and muscle pain in 25% while elderly patients recorded joint sounds in 38% of the cases and muscle pain in 12%.
9)Such previous studies suggest that the signs and symptoms of TMD truly differ according to age.
When people age not only the physical (soft and hard tis- sues and the oral mucosa) and physiological (lubrication, secretion, and regeneration) aspects but also psychological and social status undergoes change. It is widely accepted that psychological factors may be involved in the initiation, continuation and aggravation of TMD symptoms. For the successful treatment of TMD, it is essential to evaluate the psychological status of the patient. Somatization and de- pression are two aspects that draw special interest.
10,11)RDC/
TMD axis II for psychosocial evaluation can be adopted for such purposes.
12)The Symptom Checklist-90-Revision (SCL- 90-R) is a simple, self-report psychometric questionnaire that has been widely accepted for the self-assessment of
psychological status and has been used in investigating per- sonality differences between subgroups of TMD patients.
13)The aims of this study were to evaluate the differences in subjective symptoms, clinical characteristics, distribution according to RDC/TMD diagnosis and its subgroup, psycho- logical profile of TMD patients, and to identify the preva- lence and trend according to age. Such data may further contribute to identifying the pathophysiology of TMD and providing a guideline for its management.
MATERIALS AND METHODS
1. Subjects
A total of 1,052 patients (261 men and 791 women; mean age, 34.40±15.73 years) who visited at the Orofacial Pain Clinic of the Department of Oral Medicine, Seoul National University Dental Hospital (Seoul, Korea) complaining of TMD symtpoms from September 2013 to March 2015 were evaluated.
Patients with history of surgery of the orofacial area, presence of systemic disease and/or localized maxillofacial disease and mental illness were excluded from the study.
This study was approved by the institutional review board of Seoul National University Dental Hospital (CRI 15006).
2. Clinical and Radiographic Examination
Patients were initially questioned of the following demo- graphic and medical features; age, gender, marital status, occupation, education level, trauma history, general condi- tion (hypertension, diabetes mellitus, and medication us- age), contributing factors of TMD (bruxism, clenching, in- somnia, tinnitus, and headache), and subjective symptoms (symptom quality, duration, and intensity).
A clinical examination was performed on all the subjects according to the RDC/TMD including palpation of mastica- tory and cervical muscles and TMJ capsule, intraoral ex- amination (number of teeth, occlusion type and presence of prosthesis), and assessment of the TMJ (amount of mouth opening, presence of joint sound, deviation of the opening path). Pain level of the TMJ and masticatory muscles at rest and during function was scored by the patient on a visual analog scale.
Degenerative bone change was diagnosed by that the
mandibular condyle showed morphologic changes or corti- cal alterations (sclerosis, erosion, flattening and osteophyte) on the any of the three radiographies taken (panorama, TMJ-panorama, and transcranial view).
3. Diagnosis and Subgrouping
The patients were diagnosed by the RDC/TMD
5)and pa- tients were divided into seven groups based on their age; 10 to 19 years, 20 to 29 years, 30 to 39 years, 40 to 49 years, 50 to 59 years, 60 to 69 years, and 70 and over years of age.
4. Psychological Profile
The Korean version of RDC/TMD axis II
12)and SCL-90-R were administered to evaluate the pain-related disability level and psychological status of the patients. The graded chronic pain scale (GCPS) reflects pain intensity and dis- ability days due to pain.
14)The GCPS consists of six items on pain intensity with a 10-point scale and one item on the number of disability days due to orofacial pain. The final score is categorized into five grades (0, no disability; 1, low disability, low pain intensity; 2, low disability, high pain in- tensity; 3, high disability, moderately limiting; 4, high dis- ability, severely limiting). SCL-90-R is a 90-item self-report symptom inventory and is composed of nine symptom di- mensions, including somatization (SOM), obsessive-com- pulsive (O-C), interpersonal sensitivity (I-S), anxiety (ANX), depression (DEP), hostility (HOS), phobic anxiety (PHOB), paranoid ideation (PAR), and psychoticism (PSY), and three global indices of functioning, including global severity in- dex (GSI), positive symptom distress index (PSDI), and posi- tive symptom total (PST).
15)5. Statistical Analysis
Age differences in T-score of each dimension of SCL- 90-R were analyzed by Kruskal-Wallis test. Age differences
in percentage of patients with T-score above 50, the preva- lence of bruxism, tinnitus, headache and osteoarthritis and distribution according to GCPS in each age group were an- alyzed by chi-square test. Correlations of each dimension of SCL-90-R and TMD clinical parameters with age were ana- lyzed by Spearman’s correlation coefficient. The data were tested for normality before applying the adequate paramet- ric or non-parametric tests. The results were considered sta- tistically significant when the p-value was <0.05. All statis- tical analyses were performed with the IBM SPSS Statistics version 21.0 (IBM Co., Armonk, NY, USA).
RESULTS
1. Demographic Features
A total of 1,052 patients were recruited for this study.
There were 261 men (24.8%) and 791 women (75.2%), age ranged from 12 to 81 years (mean age, 34.40±15.73 years).
There were more women than men in all groups. The dis- tribution of the patients showed a peak in prevalence in the 20-year-old of age group and tended to decrease thereafter.
The results are shown in Table 1.
2. Age Differences in SCL-90-R Dimensions and RDC/TMD Axis II Profiles
Tables 2 and 3 show the descriptive results of age differ- ences in SCL-90-R dimension T-scores. Dimension SOM, O-C, DEP, ANX, PAR, and PSY T-scores showed statistical- ly significant differences according to age group. All three global indices (GSI, PSDI, and PST) showed statistically significant differences according to age group. The high- est T-score dimension was SOM in each group, except for teenagers who showed the highest T-score in I-S. The pa- tients over 70 years of age showed higher scores in SOM, DEP, PAR, and PSY dimensions compared to patients of
Table 1. Demographic features of the patients visited in Seoul National University Dental Hospital
Gender Age group (y)
Total
10-19 20-29 30-39 40-49 50-59 60-69 ≥70
Women 106 (62.0) 250 (70.2) 163 (78.4) 94 (85.5) 104 (89.7) 55 (90.2) 19 (63.3) 791 (75.2)
Men 65 (38.0) 106 (29.8) 45 (21.6) 16 (14.5) 12 (10.3) 6 (9.8) 11 (36.7) 261 (24.8)
Total 171 356 208 110 116 61 30 1,052
Values are presented as number (%).
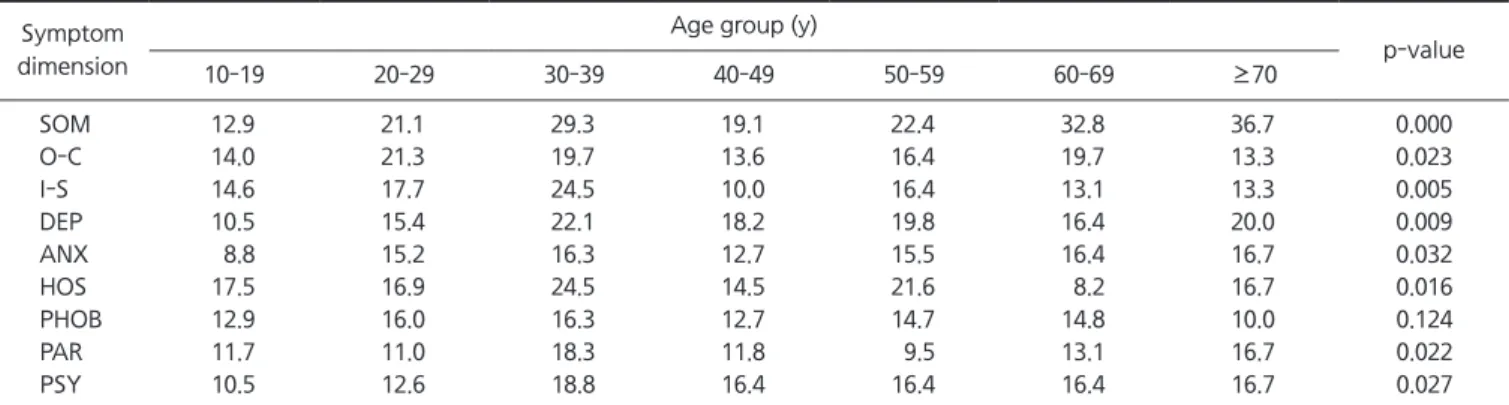
the 20-year-old age group. The highest percentage of pa- tients with T-score above 50 from each SCL-90-R dimen- sion was found in HOS in the 10-year-old age group, O-C in the 20-year-old age group, and SOM in other age groups.
Percentage of patients with T-score above 50 of all dimen- sions showed a statistically significant difference accord- ing to age group except for PHOB. The SOM score showed a tendency to increase with age. The 70 and over age group had the highest percentage of patients with T-score above 50 for SOM.
The T-score of PHOB and the percentage of patients with T-score above 50 in O-C dimension showed a peak in the
20-year-old age group, while no other dimensions showed any peak in the 20-year-old age group.
The T-scores of several dimensions (SOM, DEP, ANX, PAR, and PSY) of SCL-90-R tended to be higher, and the T-score of PHOB tended to be lower for older patients com- pared to younger patients. The T-score of all SCL-90-R di- mensions showed significant correlation with age except for PHOB. Especially SOM (r=0.141), O-C (r=0.088), DEP (r=0.210), ANX (r=0.116), PAR (r=0.167), and PSY (r=0.147) showed high correlation with age (Table 4).
According to the GCPS, the percentage of patient with low and high disability significantly differed according to
Table 2. Age differences in T-score of each dimension of Symptom Checklist-90-Revision (SCL-90-R)
SCL-90-R Age group (y)
p-value
10-19 20-29 30-39 40-49 50-59 60-69 ≥70
Symptom dimension
SOM 43.7±7.8 45.9±8.3 47.1±9.8 45.9±7.5 45.8±8.1 48.9±10.2 49.4±8.6 0.000
O-C 42.8±29.5 43.9±9.9 44.0±9.6 43.1±8.2 43.1±7.6 44.3±8.0 43.2±7.3 0.007
I-S 44.0±26.2 43.6±9.4 44.4±9.0 43.0±6.9 42.7±6.9 42.7±7.3 43.2±13.2 0.104
DEP 40.1±7.7 42.6±9.2 44.2±10.5 43.6±7.6 44.8±9.4 45.9±7.5 43.8±7.3 0.000
ANX 41.3±6.4 43.6±8.8 44.3±9.9 43.4±7.0 43.3±7.2 44.0±7.3 43.1±5.7 0.003
HOS 43.6±7.1 44.9±8.0 46.0±9.3 44.1±6.6 44.7±6.7 44.3±6.4 43.7±5.7 0.066
PHOB 43.8±6.5 45.3±8.1 44.8±9.5 44.8±6.3 44.1±7.6 44.7±6.6 44.6±4.5 0.203
PAR 42.1±7.0 42.5±8.3 44.0±9.1 42.2±5.0 42.6±6.4 43.5±6.9 44.5±6.6 0.000
PSY 42.4±5.6 42.8±7.6 43.9±8.3 43.2±5.2 44.4±6.8 44.3±6.5 44.5±5.3 0.002
Global index
GSI 40.4±6.9 42.9±8.9 44.1±10.3 42.7±6.9 43.4±7.9 44.4±7.7 44.4±6.6 0.000
PSDI 43.2±6.9 45.2±8.0 44.5±8.5 43.3±7.3 43.0±8.4 45.2±6.9 50.2±13.6 0.000
PST 37.6±10.0 40.9±10.5 43.8±11.2 42.8±8.8 43.8±10.3 45.3±9.8 44.0±9.6 0.000
SOM, somatization; O-C, obsessive-compulsive; I-S, interpersonal-sensitivity; DEP, depression; ANX, anxiety; HOS, hostility; PHOB, phobic anxiety;
PAR, paranoid ideation; PSY, psychoticism; GSI, global severity index; PSDI, positive symptom distress index; PST, positive symptom total.
Values are presented as mean±standard deviation.
Statistical significance was evaluated using the Kruskal-Wallis test.
Table 3. Age differences in percentage of patients with T-score above 50 in each dimension of Symptom Checklist-90-Revision Symptom
dimension
Age group (y)
p-value
10-19 20-29 30-39 40-49 50-59 60-69 ≥70
SOM 12.9 21.1 29.3 19.1 22.4 32.8 36.7 0.000
O-C 14.0 21.3 19.7 13.6 16.4 19.7 13.3 0.023
I-S 14.6 17.7 24.5 10.0 16.4 13.1 13.3 0.005
DEP 10.5 15.4 22.1 18.2 19.8 16.4 20.0 0.009
ANX 8.8 15.2 16.3 12.7 15.5 16.4 16.7 0.032
HOS 17.5 16.9 24.5 14.5 21.6 8.2 16.7 0.016
PHOB 12.9 16.0 16.3 12.7 14.7 14.8 10.0 0.124
PAR 11.7 11.0 18.3 11.8 9.5 13.1 16.7 0.022
PSY 10.5 12.6 18.8 16.4 16.4 16.4 16.7 0.027
SOM, somatization; O-C, obsessive-compulsive; I-S, interpersonal-sensitivity; DEP, depression; ANX, anxiety; HOS, hostility; PHOB, phobic anxiety; PAR, paranoid ideation; PSY, psychoticism.
Statistical significance was evaluated using the chi-square test.
age group. The highest distribution of patients with low dis- ability was in the 10-year-old age group, while there were more patients with high disability in the 30-year-old age group (Table 5).
3. The Prevalence of Bruxism, Tinnitus, Headache and Osteoarthritis
The prevalence of bruxism and headache showed
statistically significant differences according to age group.
Bruxism showed broad peak in prevalence in the 20- and 30-year-old age group and tended to decrease with age.
Headache showed a peak in prevalence in the 40-year- old age group but was proved to be a common comorbid- ity as it appeared with high prevalence in every age group.
Tinnitus symptoms showed a peak in the 60-year-old age group and prevalence over 30% in all age groups but the difference according to age group was not statistically sig- nificant. The prevalence of osteoarthritis was highest in the 50-year-old age group, but there was no statistically signif- icant difference among groups (Table 6).
4. Impacts of Age on TMD Sign and Symptom
Age were positively associated with pain intensity (r=0.100) and number of positive muscles on palpation (r=0.137) while being negatively associated with maximum mouth opening (r=-0.168) (Table 7).
DISCUSSION
In this retrospective cross sectional study the differences in subjective symptoms, clinical characteristics, distribution
Table 4. Correlation of age and each dimension of Symptom Checklist-90-Revision
Symptom dimension Age
aSOM 0.141**
O-C 0.088**
I-S 0.075*
DEP 0.210**
ANX 0.116**
HOS 0.074*
PHOB -0.041
PAR 0.167**
PSY 0.147**
SOM, somatization; O-C, obsessive-compulsive; I-S, interpersonal- sensitivity; DEP, depression; ANX, anxiety; HOS, hostility; PHOB, phobic anxiety; PAR, paranoid ideation; PSY, psychoticism.
a
Spearman’ s correlation coefficient.
*p<0.05. **p<0.01.
Table 5. Percentage distributions of temporomandibular disorders patients according to the graded chronic pain
Graded chronic pain Age group (y)
10-19 20-29 30-39 40-49 50-59 60-69 ≥70
Low disability
Low intensity (Ⅰ) 48.5 43.2 31.4 30.1 32.2 33.3 42.9
High intensity (Ⅱ) 22.3 17.6 15.4 19.4 25.6 23.5 9.5
High disability
Moderate limiting (Ⅲ) 17.7 22.3 32.6 32.3 24.4 23.5 19.0
Severely limiting (Ⅳ) 11.5 16.9 20.6 18.3 17.8 19.6 28.6
p-value 0.025
Statistical significance was evaluated using the chi-square test.
Table 6. Prevalence of bruxism, tinnitus, headache, and osteoarthritis in each age group
Symptom Age group (y)
p-value
10-19 20-29 30-39 40-49 50-59 60-69 ≥70
Bruxism 22.4 26.9 29.5 20.0 15.5 6.6 0.0 0.000
Tinnitus 34.3 44.6 38.5 38.2 33.7 46.0 40.9 0.241
Headache 46.6 62.5 68.7 75.2 49.5 63.0 40.9 0.000
Osteoarthritis 33.3 34.6 37.5 36.4 50.0 42.6 43.3 0.074
Values are presented as %.
Statistical significance was evaluated using the chi-square test.
according to RDC/TMD axis II diagnosis and its subgroup, psychological profile of TMD patients were evaluated ac- cording to age to identify the prevalence and trend ac- cording to age group. The results showed that women were more common in TMD patients regardless of age. Such findings are in line with numerous studies of TMD preva- lence.
16)However, a previous study reported that between 10 to 16 years of age both genders showed similar TMD preva- lence
8)and another study reported no difference in TMD pain intensity from both genders.
17)Such diverse results support the fact that not only well known gender but also age has an major impact on TMD type and severity and furthermore on the effect of gender itself on TMD. Age may deflect the effect of gender since change in age is accom- panied by hormonal changes that may directly affect pain processing.
18,19)All psychological evaluation methods applied in this study tell us that the psychological profile of TMD pa- tients differ according to age. Patients over 70 years of age showed higher scores in SOM, DEP, PAR, and PSY dimen- sions compared to patients of the 20-year-old age group with the highest prevalence peak. The problem of high prev- alence of mental disorders in the elderly group is a well- known issue.
20)And depression has been reported as the factor that has the greatest influence on healthy aging in Korean adults.
21)Pain intensity and frequency have been re- peatedly reported to be significantly associated with depres- sion and this was also shown to be true in older adults.
22)The results show that the prevalence of signs and symptoms of TMD decrease with age. There were more patients with high disability in the 30-year-old age group. This may be due to the lessened sensitivity to pain compared to young groups.
9)But TMD of the elderly may progress into different directions than younger patients due to psychological mat- ters and this must be considered in the treatment of elderly TMD patients. Somatization is also a major contributing
factor to pain. The highest T-score dimension was SOM in each group, except for teenagers. TMD patients of a longer duration and multiple diagnoses showed higher rates of de- pression and somatization.
23)Teenagers showed the highest T-score in I-S. Interpersonal factors may prolong and main- tain depresson.
24)It is also known that negative emotional experience in the early stage of life may cause pain syn- dromes.
25)Based on such facts the psychological problems that appear in the teenage TMD patient group must not be disregarded.
Bruxism showed broad peak in prevalence in the 20- and 30-year-old age group and tended to decrease with age.
Such results corroborate previous findings.
26)Headaches are known as one of the most common comorbidities of TMD.
27)The underlying etiology of headaches in TMD is still elusive but it is true that each may contribute to the enhancement of each other’s pain level so should be considered in their management process.
1)Tinnitus symptoms showed a peak in the 60-year-old age group and prevalence over 30% in all age groups but the difference according to age group.
TMD is known to be related to otologic symptoms includ- ing tinnitus and vertigo.
28)Although the prevalence did not show a statistically significant difference, the problem of tinnitus should especially be evaluated and managed in the elderly TMD population.
29)The fact that osteoarthritis of the TMJ did not consistently increase with age is another in- teresting finding. Unlike other joints that show an increase of osteoarthritis occurrence with aging the TMJ seems to be unique in this aspect.
30)This suggests that active radio- graphic evaluation and follow-up of the TMJ must be done regardless of age. The fact that maximum mouth opening was negatively associated with age also draws attention.
Limited mouth opening may have an adverse influence on eating and this may lead to deterioration of health in the elderly population.
31)So mouth opening limitation problems must be handled seriously to improve the overall health of
Table 7. Correlation of age and pain intensity, number of positive muscle palpation, and maximum mouth opening (MMO)
Pain intensity Number of positive muscle palpation MMO
Age
a0.100** 0.137** -0.168**
a