www.cdc.go.kr
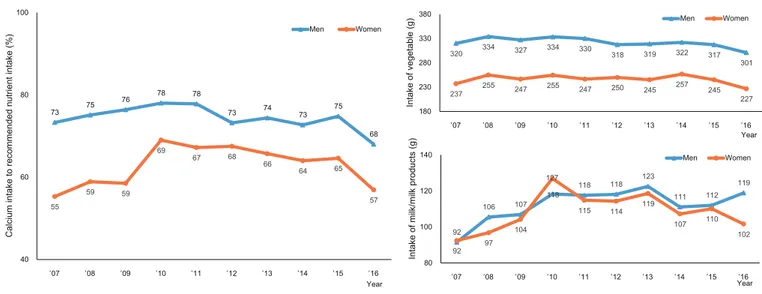
1099 주간 건강과 질병•제11권 제33호 통계단신, QuickStats 남자의 칼슘 섭취수준은 권장섭취량의 68%, 여자는 57%로(2016년), 남녀 모두 상당히 낮고 여자가 더 심각. 채소류와 우유류는 칼슘의 주요 급원 식품군으로, 우유 섭취 증가와 함께 칼슘 섭취 문제가 해소될 것으로 기대했으나 2010년 이후 답보 수준이며, 채소류 섭취량이 감소할 것으로 예상되어 칼슘 부족 우려됨(그림 A, 자세한 결과는 「2016 국민건강통계」참조).
Calcium deficiency is the traditional nutrition problem in Korea. In both of men and women, the ratios of calcium intake compared to the recommended nutrient intake were lower than 70%. Because the consumption of vegetable and milk, the major sources of calcium intake, was not improved, calcium deficiency could be more severe (Figure A).
Source: Korea Health Statistics 2016: Korea National Health and Nutrition Examination Survey (KNHANES Ⅶ-1), http://knhanes.cdc.go.kr/ Reported by: Division of Health and Nutrition Survey, Korea Centers for Disease Control and Prevention
73 75 76 78 78 73 74 73 75 68 55 59 59 69 67 68 66 64 65 57 40 60 80 100 ’07 ’08 ’09 ’10 ’11 ’12 ’13 ’14 ’15 ’16
Calcium intake to recommended nutrient intake (%)
Year Men Women 320 334 327 334 330 318 319 322 317 301 237 255 247 255 247 250 245 257 245 227 180 230 280 330 380 ’07 ’08 ’09 ’10 ’11 ’12 ’13 ’14 ’15 ’16 Intake of vegetable (g) Year Men Women 92 106 107 118 118 118 123 111 112 119 92 97 104 127 115 114 119 107 110 102 80 100 120 140 ’07 ’08 ’09 ’10 ’11 ’12 ’13 ’14 ’15 ’16
Intake of milk/milk products (g)
Year Men Women
Figure A. Change in intakes of calcium, vegetable and milk, 2007-2016 * Source: Korea National Health and Nutrition Examination Survey
* The ages of subjects were 1 year or over.
* Percentage of calcium intake to recommended nutrient intake (RNI) is the ratio of calcium intake compared to the recommended intake of respective sex and age group.
* RNI was from the Dietary Reference Intakes for Koreans, 2015 by the Ministry of Health and Welfare.
* The mean and standard error was calculated using direct standardization method based on ‘05 population projection.
칼슘 섭취 현황
Trends in calcium intake and major food sources, 2007-2016
[정의] 칼슘 권장섭취량 대비 섭취 비율 : 칼슘 권장섭취량에 대한 섭취량 비율의 평균 권장섭취량 : 2015 한국인 영양소 섭취기준(보건복지부, 2015)