저작자표시-비영리-변경금지 2.0 대한민국 이용자는 아래의 조건을 따르는 경우에 한하여 자유롭게 l 이 저작물을 복제, 배포, 전송, 전시, 공연 및 방송할 수 있습니다. 다음과 같은 조건을 따라야 합니다: l 귀하는, 이 저작물의 재이용이나 배포의 경우, 이 저작물에 적용된 이용허락조건 을 명확하게 나타내어야 합니다. l 저작권자로부터 별도의 허가를 받으면 이러한 조건들은 적용되지 않습니다. 저작권법에 따른 이용자의 권리는 위의 내용에 의하여 영향을 받지 않습니다. 이것은 이용허락규약(Legal Code)을 이해하기 쉽게 요약한 것입니다. Disclaimer 저작자표시. 귀하는 원저작자를 표시하여야 합니다. 비영리. 귀하는 이 저작물을 영리 목적으로 이용할 수 없습니다. 변경금지. 귀하는 이 저작물을 개작, 변형 또는 가공할 수 없습니다.
Trade Competitions among the Top Exporting
Partners in the ASEAN Market:
Focusing on Agro-food Commodities
아세안 시장에서 주요 수출국 간 무역 경쟁:
농식품 분야를 중심으로
BY
TIN TIN AUNG
DEPARTMENT OF AGRICULTURAL ECONOMICS AND
RURAL DEVELOPMENT
GRADUATE SCHOOL
SEOUL NATIONAL UNIVERSITY
Dedicated to the five
noble benefactors:
*Buddha
*Dhamma
*Sangha
*Teacher
*Parents
Agreement on Original Contents Provision
Concerning my thesis, I agree that Seoul National University will provide it for the purpose of the following:
1. Matters Agreed Upon
① I agree on duplication of my thesis for the purpose of its preservation or online provision only if the contents are maintained as the original ones.
② I agree on digitalizing my thesis and reproducing/distributing, for internet or other communication networks, part of or the entire of the thesis for free of charge. 2. Author’s Obligation
I will immediately notify the Graduate School of Seoul National University of a request for suspension or cancellation of public use of my thesis once any changes in the agreement are needed (such as transfer of copyright to a third party or approval of publication of my thesis).
3. Obligation of Seoul National University
① Seoul National University will use the copyright protection tool (DRM) in case that the university provides the thesis to external users.
② Seoul National University will take immediate follow-up actions once the author requests for a suspension or cancellation of public use of the thesis.
Thesis Title: Trade Competitions among the Top Exporting Partners in the ASEAN Market: Focusing on Agro-food Commodities
Category of Degree: Doctoral Thesis
Department: Department of Agricultural Economics and Rural Development
Student ID.: 2009-31277 Contact Number:
Author: Tin Tin Aung (Seal)
i
ABSTRACT
Since ASEAN is playing a significant role in the networking of bilateral trade agreements in the East Asia region, Free Trade Agreements (FTAs) become now the most prominent and rapidly expanding feature of the multilateral trading system.
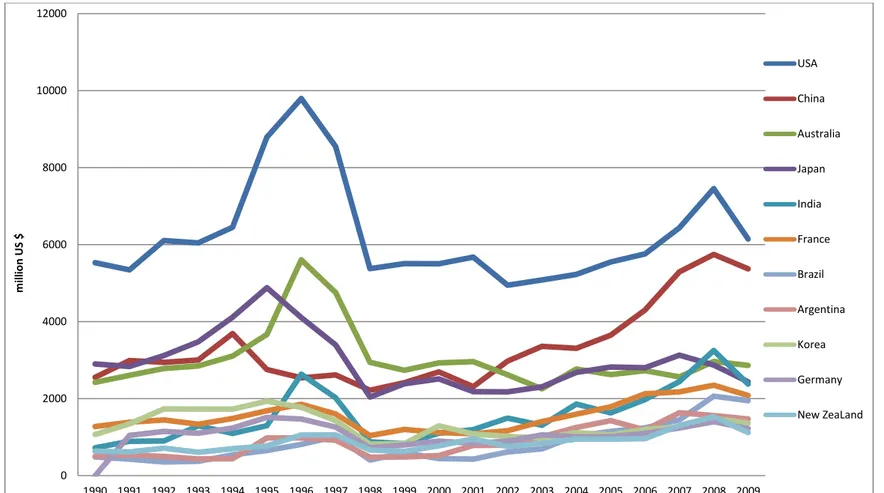
Although ASEAN is a net exporting region for agricultural trade, due to rising per capita income, the diets and preferences of consumers on the different kinds of value added products, the demands of an increasingly concentrated food industry, globalization and the spreading presence of the fast-food industry in developing countries, most of its agriculture and some non-agriculture imports become large and growing during these periods until the total import amount 257,943 million US$ from the world in 2005-2009 periods. Among the top 20 exporters to ASEAN market, USA, China, Australia, India and Japan were five largest trade partners in ASEAN import market.
By using the un-centered correlation distance approach and the concept of competitive threat framework, the results show that USA, Japan and Australia were facing serious competition with China as well as India in ASEAN import market. Japan also faced trade competition with Korea. The relative geographic proximity of China and India to ASEAN markets seems to favor them several advantages in their competitions with other countries.
Among total 323 four-digit HS commodities of ASEAN import, USA’s exports (316 commodities), Japan’s exports (318 commodities) and Australia’s exports (304 commodities) were affected by China’s export threat. Among those affected items, USA (63%), Japan (63%) and Australia (63%) were subjected to “Direct threat and Partial
ii threat” of China’s exports.
After more detail analysis of six-digit items, China directly threatened to USA and Australia in major edible fruits such as “fresh apples”, “fresh and dried grapes”, “fresh or dried oranges”, “fresh pears and quinces”, and “fresh mandarin, clementine & citrus” in ASEAN market. USA and Japan were suffering China’s direct threat in some items like “Sauces nes, mixed condiment, mixed seasoning”, “Soups and broths and preparations thereof”, “Homogenised composite food preparations”, “Mustard flour or meal and prepared mustard”, “Food preparation nes” and “Tobacco, unmanufactured, stemmed or stripped”. Moreover these three countries were subjected to China’ direct threat in “Woven cotton nes, >85% <200g/m2, printed”, “Woven cotton nes, >85% >200g/m2, dyed, nes”, and “Woven cotton nes, >85% <200g/m2, unbleached”.
With the relatively higher similarity index, exports of USA, Japan and Australia were subjected to compete with not only China’s exports but also India’s exports in ASEAN import market. Japan’s exports 243 items, USA’s export 225 items and Australia’s exports 218 items were directly or partially challenged by India’s exports. The major agriculture export commodities directly affected by India’s export were “Maize except seed corn”, “Maize (corn) seed”, Millet, Canary seed, “Ground-nuts shelled, not roasted or cooked”, “Sesamum seeds”, “Plants & parts, pharmacy, perfume, insecticide use nes”, “Seed, fruits and spores for sowing, nes”, “Seed, forage plants, for sowing nes”, “Seed, vegetable, nes for sowing”, “Vegetable products nes for human consumption” and “different kinds of Cotton” for both USA and Australia. Moreover Australia’s “Dairy products” and USA’s “Residues and waste from the food industries” were also threatened by India’s exports.
iii
Japan’s major products like “Sauces nes, mixed condiments, mixed seasoning”, “Soups and broths and preparations thereof”, “Homogenised composite food preparations”, “Adhesives based on rubber or plastic, package >1 kg”, “Glues or adhesives, prepared nes, package > 1kg”, “Enzymes nes, prepared enzymes nes, except rennet”, “Dextrins and other modified starches” and “major cotton products” were subjected to Direct Threat by India’s export products. In addition to, Japan’s major products directly threatened by Korea were “Flour or meal, pellet, fish, etc., for animal feed”, “Animal feed preparations nes”, “Plain weave cotton, >85% >200g/m2, unbleached”, “Woven cotton nes, >85% <200g/m2, unbleached”, “Woven cotton nes, >85% <200g/m2, dyed” and “other different kinds of cotton” in ASEAN import market.
For non-agriculture products, Herbicides, Insecticides, Pesticides, “Finishing agents, dye carriers” , “Activated carbon”, “prepared rubber accelerators”, Isocyanates, Ethylene, Antibiotics, Organo-sulphur compounds, Heterocyclic compounds, and “Penicillins and their derivatives” of USA, Japan and Australia were subjected to Direct Threat of each reference country in all trade competitions in ASEAN market.
By applying gravity model, the effect of “the importers’ GDP”, “the importers’ GDP per capita” and “exporters’ GDP” shows positive and highly significant. It means that trade rises with GDP of importers, GDP per capita of importers and GDP of exporters in ASEAN import market. The significant coefficient of dummy variable, FTAijt is (2.39) and the intra-ASEAN Free Trade Agreement increased trade between its
members by 991%. Therefore, Free Trade Agreements play an important role in the trade of top exporters in ASEAN import market.
iv
Even import amounts and value of the major crops increased significantly, increasing of import did not effect on their domestic productions of ASEAN countries. Importing products or commodities could be used for domestic consumption as complementary goods and could be also used as raw materials from value-added industries for domestic consumption as well as export in ASEAN countries.
Key words: trade competition, ASEAN import market, Free Trade Agreement (FTA), gravity model, agriculture products
v
Contents
Abstract………..i
List of Tables (in the body of text) ... ix
List of Figures (in the body of text) ... xiii
List of the Acronyms ... xvi
I. INTRODUCTION ... 1
1.1 Background of the study ... 1
1.2 Significance of the study ... 5
1.3 Objectives of the study ... 12
1.4 Organization of the study ... 13
II. LITERATURE REVIEWS ... 14
2.1 ASEAN Regional Trade ... 14
2.2 ASEAN Free Trade Agreements ... 16
2.3 Trade Competitions... 20
2.3.1 Trade Competition between China and USA ... 20
2.3.2 Trade Competition between China and India... 24
2.3.3 Trade Competition between China and Japan ... 26
2.3.4 Trade Competition between India and USA ... 30
2.3.5 Trade Competition between Korea and Japan ... 31
III. DESCRIPTION OF THE STUDY AREA ... 33
3.1 Association of South East Asian Nations (ASEAN) ... 33
vi
3.3 ASEAN Free Trade Agreements ... 52
3.4 ASEAN Relation with Top Trading Partners ... 55
3.4.1 ASEAN relation with USA ... 55
3.4.2 ASEAN relation with China ... 58
3.4.3 ASEAN relation with Japan ... 64
3.4.4 ASEAN relation with India ... 66
3.4.5 ASEAN relation with Australia ... 69
3.4.6 ASEAN relation with Korea ... 71
IV. RESEARCH METHODOLOGY ... 73
4.1 Trade Competitions in ASEAN import market ... 73
4.1.1 Data and Sampling ... 73
4.1.2 Analytical Framework... 75
4.2 Effect of Free Trade Agreement (FTA) in ASEAN import market ... 80
4.2.1 The Gravity Model ... 80
4.2.2 Data and Methodology ... 82
V. RESULTS AND DISCUSSIONS ... 84
5.1 ASEAN agriculture and non-agriculture trade with the top partners ... 84
5.2 ASEAN agriculture and non-agriculture trade with United States ... 96
5.2.1 USA agriculture and non-agriculture exports to world ... 96
5.2.2 USA agriculture and non-agriculture exports to ASEAN ... 98
5.3 ASEAN agriculture and non-agriculture trade with China ... 101
5.3.1 China agriculture and non-agriculture exports to world ... 101
vii
5.4 ASEAN agriculture and non-agriculture trade with Japan ... 109
5.4.1 Japan agriculture and non-agriculture exports to world ... 109
5.4.2 Japan agriculture and non-agriculture exports to ASEAN ... 112
5.5 ASEAN agriculture and non-agriculture trade with India ... 115
5.5.1 India agriculture and non-agriculture exports to world ... 115
5.5.2 India agriculture and non-agriculture exports to ASEAN ... 119
5.6 ASEAN agriculture and non-agriculture trade with Australia ... 122
5.6.1 Australia agriculture and non-agriculture exports to world ... 122
5.6.2 Australia agriculture and non-agriculture exports to ASEAN .. 126
5.7 ASEAN agriculture and non-agriculture trade with Korea ... 129
5.7.1 Korea agriculture and non-agriculture exports to world ... 129
5.7.2 Korea agriculture and non-agriculture exports to ASEAN ... 132
5.8 Trade competitions among the emerging markets and declining markets ………...136
5.8.1 Trade competition between China and United States ... 137
5.8.2 Trade competition between China and Japan ... 154
5.8.3 Trade competition between China and Australia ... 159
5.8.4 Trade competition between India and United States... 165
5.8.5 Trade competition between India and Japan ... 175
5.8.6 Trade competition between India and Australia ... 180
5.8.7 Trade competition between Korea and Japan ... 185
5.9 Effect of Free Trade Agreement (FTA) ... 195
5.10 Production, export and import of some major crops in ASEAN ... 198
viii
6.1 Conclusions ... 208
6.2 Policy implications ... 218
REFERENCES ... 225
APPENDICES ... 236
ABSTRACT (in Korean) ... 247
ix
List of Tables (in the body of text)
T. No. Title Page no.
Table 1 Macro economic factors of ASEAN countries (2009) ... 36
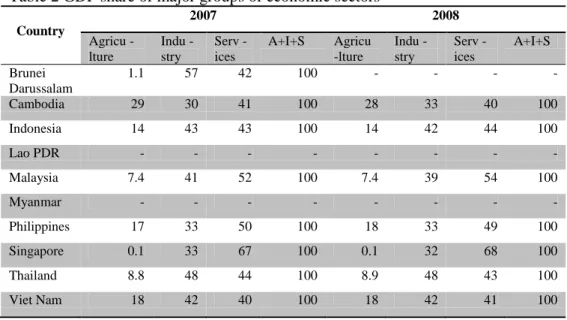
Table 2 GDP share of major groups of economic sectors ... 37
Table 3 Name and code numbers of the ASEAN agriculture and non-agriculture import commodities ... 74
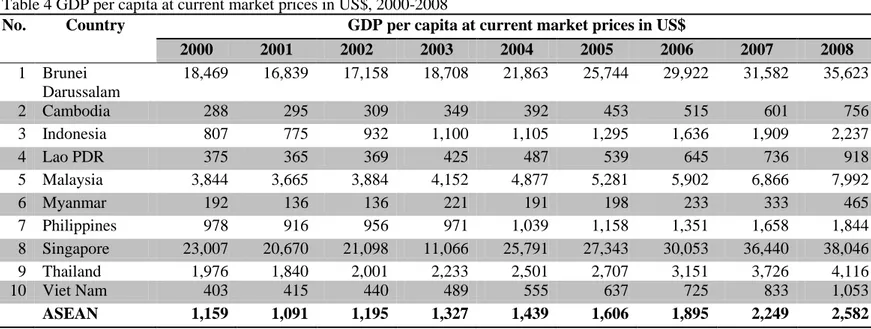
Table 4 GDP per capita at current market prices in US$, 2000-2008 ... 85
Table 5 ASEAN agriculture and non-agriculture import values ... 86
Table 6 ASEAN countrywide agriculture and non-agriculture import values ... 88
Table 7 Top twenty exporters to ASEAN Market ... 91
Table 8 USA agriculture and non-agriculture exports to world ... 97
Table 9 USA agriculture and non-agriculture exports to ASEAN ... 99
Table 10 China agriculture and non-agriculture exports to world ... 102
Table 11 China agriculture and non-agriculture exports to ASEAN ... 106
Table 12 Japan agriculture and non-agriculture exports to world ... 110
Table 13 Japan agriculture and non-agriculture exports to ASEAN ... 113
Table 14 India agriculture and non-agriculture exports to world ... 116
Table 15 India agriculture and non-agriculture exports to ASEAN... 120
Table 16 Australia agriculture and non-agriculture exports to world ... 123
Table 17 Australia agriculture and non-agriculture exports to ASEAN ... 127
x
Table 19 Korea agriculture and non-agriculture exports to ASEAN ... 133 Table 20 Geographical Proximity (Kilometer, km) ... 136 Table 21 Changes in major exporters' share and average annual growth rate in ASEAN market ... 139 Table 22 Similarity Index of agriculture and non-agriculture export structure compared with China ... 144 Table 23 Competitive Threat of China to top-20 exporters in ASEAN by Periods147 Table 24 Number of Products by Types of China Threat (Four-digit HS Code, 1990-2009) ... 148 Table 25 Competitive Threat of China in USA's major agriculture exports to ASEAN (1990-2009) ... 150 Table 26 Competitive Threat of China in USA's major non-agriculture exports in ASEAN (1990-2009) ... 152 Table 27 Competitive Threat of China in Japan's major agriculture exports to ASEAN (1990-2009) ... 155 Table 28 Competitive Threat of China in Japan's major non-agriculture exports in ASEAN (1990-2009) ... 157 Table 29 Competitive Threat of China in Australia's major agriculture exports to ASEAN (1990-2009) ... 160 Table 30 Competitive Threat of China in Australia's major non-agriculture exports in ASEAN (1990-2009) ... 163 Table 31 Similarity Index of agriculture and non-agriculture export structure compared with India ... 165
xi
Table 32 Competitive Threat of India to top-20 exporters in ASEAN by Periods 167 Table 33 Number of Products by Types of India Threat (Four-digit HS Code, 1990-2009) ... 168 Table 34 Competitive Threat of India to USA's major agriculture exports to ASEAN (1990-2009)... 171 Table 35 Competitive Threat of India in USA's major non-agriculture exports to ASEAN (1990-2009) ... 173 Table 36 Competitive Threat of India in Japan's major agriculture exports to ASEAN (1990-2009) ... 176 Table 37 Competitive Threat of India in Japan's major non-agriculture exports to ASEAN (1990-2009) ... 178 Table 38 Competitive Threat of India in Australia's major agriculture exports to ASEAN (1990-2009) ... 181 Table 39 Competitive Threat of India in Australia's non-agriculture exports to ASEAN (1990-2009) ... 183 Table 40 Similarity Index of agriculture and non-agriculture export structure compared with Korea ... 185 Table 41 Competitive Threat of Korea to top-20 exporters in ASEAN by Periods ... 187 Table 42 Number of Products by Types of Korea Threat (Four-digit HS Code, 1990-2009) ... 190 Table 43 Competitive Threat of Korea in Japan's major agriculture exports to ASEAN (1990-2009) ... 192
xii
Table 44 Competitive Threat of Korea in Japan's major non-agriculture exports in
ASEAN (1990-2009) ... 193
Table 45 Gravity Model Estimation Results ... 195
Table 46 ASEAN agriculture and non-agriculture export values ... 205
Table 47 Similarity Index Matrix for Export Structure by Periods ... 236
Table 48 Competitive interaction with China (1990-2009) ... 242
Table 49 Competitive interaction with India (1990-2009) ... 243
xiii
List of Figures (in the body of text)
No. Title Page no.
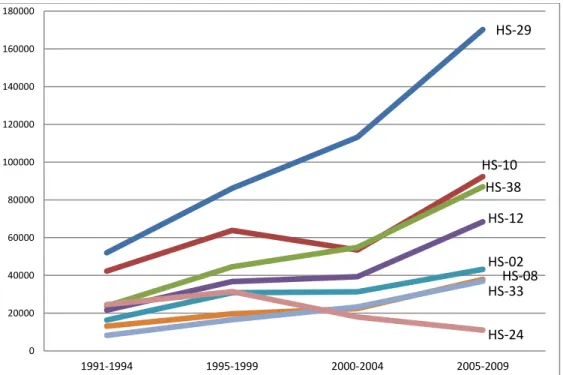
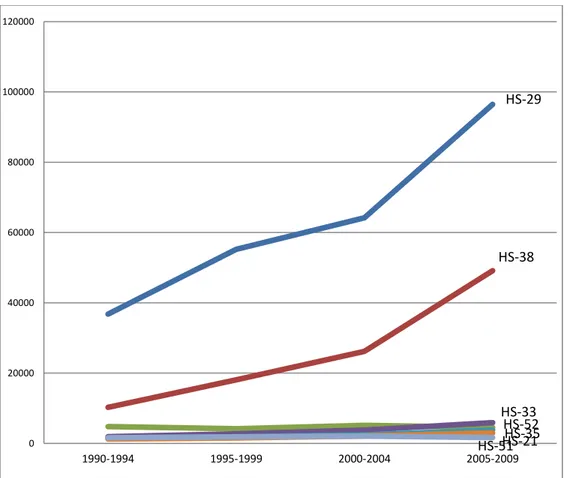
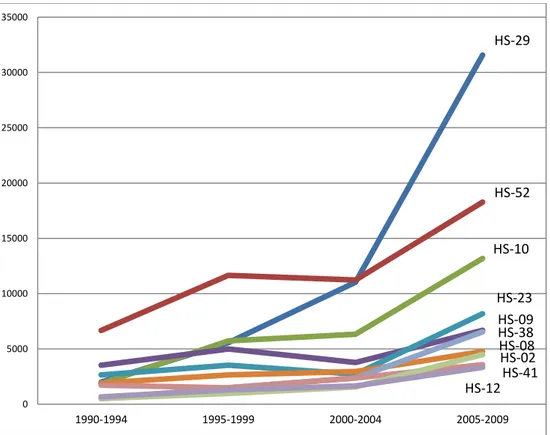
Figure 1 Association of South East Asian Nations (ASEAN) Plus 3 ... 33 Figure 2 Trend of ASEAN agriculture and non-agriculture import from the world (million US$) ... 90 Figure 3 Trend of ASEAN agriculture and non-agriculture import from top trading partners (million US$) ... 92 Figure 4 ASEAN’s total import share by major exporters during 1990 to 2009 ... 93 Figure 5 Changes in exporters' share% in ASEAN market... 94 Figure 6 Trend of USA agriculture and non-agriculture export values to world (million US$) ... 98 Figure 7 Trend of ASEAN agriculture and non-agriculture import values from USA (million US$) ... 101 Figure 8 Trend of China agriculture and non-agriculture export values to world (million US$) ... 104 Figure 9 Trend of ASEAN agriculture and non-agriculture import values from China (million US$) ... 108 Figure 10 Trend of Japan agriculture and non-agriculture export values to world (million US$) ... 112 Figure 11 Trend of ASEAN agriculture and non-agriculture import values from Japan (million US$) ... 115
xiv
Figure 12 Trend of India agriculture and non-agriculture export values to world (million US$) ... 118 Figure 13 Trend of ASEAN agriculture and non-agriculture import values from India (million US$) ... 122 Figure 14 Trend of Australia agriculture and non-agriculture export values to world (million US$) ... 125 Figure 15 Trend of ASEAN agriculture and non-agriculture import values from Australia (million US$) ... 129 Figure 16 Trend of Korea agriculture and non-agriculture export values to world (million US$) ... 132 Figure 17 Trend of ASEAN agriculture and non-agriculture import values from Korea (million US$) ... 135 Figure 18 Structure of China's agriculture and non-agriculture export items in ASEAN market ... 141 Figure 19 Export structures of China and U.S. to ASEAN agriculture and non-agriculture market (1990-2009) ... 142 Figure 20 Trend of the similarity index of export structure compared with China 145 Figure 21 Trend of the similarity of export structure compared with India ... 166 Figure 22 Structure of India's agriculture and non-agriculture export items in ASEAN market ... 170 Figure 23 Trend of the similarity index of the export structure compared with Korea ... 186
xv
Figure 24 Export Structure of Korea and Japan in ASEAN agriculture and
non-agriculture market (1990-2009) ... 188
Figure 25 Structure of Korea’s agriculture and non-agriculture export items in ASEAN market ... 189
Figure 26 Production, export and import amount of fruits (total) in ASEAN ... 198
Figure 27 Production, export and import amount of tobacco in ASEAN ... 199
Figure 28 Production, export and import amount of wheat in ASEAN ... 200
Figure 29 Production, export and import amount of cereals in ASEAN ... 201
Figure 30 Production, export and import amount of oilseed crops in ASEAN ... 201
Figure 31 Production, export and import amount of cotton in ASEAN ... 202
Figure 32 Production, export and import amount of six major crops in ASEAN .. 203
Figure 33 Trend of ASEAN export and import values (1990-2009) ... 204
Figure 34 Trend of ASEAN export and import values with China ... 245
Figure 35 Trend of ASEAN export and import values with India ... 245
Figure 36 Trend of ASEAN export and import values with Japan ... 246
xvi
List of the Acronyms
ACFTA: ASAEN China Free Trade Agreement
ACIA: ASEAN Comprehensive Investment Agreement AEC: ASEAN Economic Community
AIBC: ASEAN-India Business Council AIBF: ASEAN-India Business Fair
AIFTA: ASAEN India Free Trade Agreement
AJCEP: ASEAN-Japan Comprehensive Economic Partnership AJFTA: ASAEN Japan Free Trade Agreement
AKFTA: ASAEN Korea Free Trade Agreement APEC: Asia-Pacific Economic Cooperation ARF: ASEAN Regional Forum
ASEAN: Association of South East Asian Nations ATIGA: ASEAN Trade in Goods Agreement Cif: Cost, Insurance and Freight
CLMV: Cambodia, Laos, Myanmar and Vietnam EAFTA: East Asia Free Trade Area Agreement EPAs: Economic Partnership Agreements FDI: Foreign Direct Investment
GDP: Gross Domestic Product
OECD: The Organization for Economic Co-operation and Development SMEs: Small and Medium Enterprises
1
I. INTRODUCTION
1.1
Background of the study
The East Asian economies have been very active over the last decade by proposing to establish the East Asia Free Trade Area Agreement (EAFTA), which ideally would include all of ASEAN (the Association of Southeast Asian Nations), China, Japan and Korea. The Association of Southeast Asian Nations (ASEAN) is a geopolitical and economic organization spread over a wide and diverse region with a population of approximately 600 million.
Covering a total population of 1.7 billion people and a combined GDP of about US$2 trillion, ASEAN-China Free Trade Area (ACFTA), implemented in 2005, is billed as the largest free-trade zone by population (nearly 1.9 billion) and the third largest by volume (US$ 192 billion in 2008) in the world. China’s emergence as an avid pursuer of FTAs happened in spite of its latecomer status. China did not begin its premarket economic reform until 1978 and did not join the World Trade Organization (WTO) until the middle of 2001.
In the case of Southeast Asia, China’s FTA with the ASEAN is driven by a political logic that responds to challenges posed by competitive regionalisms in the world economy, to cement growing economic ties with Southeast Asian nations, to secure raw materials crucial to China’s economic development, and to ensure a peaceful and stable environment close to home. ASEAN nations are attracted by the
2
opportunities brought about by China’s economic expansion and trade liberalization; they also seek to leverage their FTA with China to additional FTAs with important trading partners within (e.g. Japan) or outside (e.g. the United States) the region.
Although there are economic benefits for pursuing FTAs, nations often pursue them for non-economic reasons. Regionalism (and FTAs in particular) plays a critical role in China’s current grand strategy - “peaceful rise.” The policy of “peaceful rise” is based on an embrace of globalization as part of the solution to China’s growth imperatives. It relies both on China’s domestic economy and the international marketplace to sustain and fuel economic growth. China’s economic diplomacy has presented opportunities and challenges for East Asia.
On the one hand, China has tried to “bind” ASEAN nations through regional institutions, such as ACFTA, ASEAN plus Three (APT), East Asia Summit (EAS) and ARF (Asian Regional Forum). Indeed, China’s FTA activism has spurred measures by Japan and India to strengthen their own economic diplomacy in Southeast Asia. For instance, since the ACFTA was enacted, Japan has signed FTAs with Singapore, Malaysia, Indonesia, Thailand, and the Philippines. In contrast, the interest of the United States in the region, as shown through the lens of economic diplomacy, pales in comparison. Since 2004, China has replaced the United States as the largest trading partner of Japan, South Korea, Taiwan, India, Australia, Brazil, and Chile. Admittedly this is mainly due to the rise of China as a world trader, but it is also an indicator of America’s relative declining influence. The United States has only signed FTAs with Singapore and South Korea. The United States’ hope of engaging in a FTA with the entire membership of APEC
3
(Asia-Pacific Economic Cooperation) also looks less appealing or feasible than China’s bilateral FTAs, especially against the backdrop of the failed Doha Round of WTO multilateral talk.
The new ASEAN FTAs were most likely to affect U.S. exports of processed agricultural products, especially in the subcategory labeled in the trade data as “food preparations: composite mixtures”—a diverse category of products such as beverage bases, some snack foods, some fruit juice preparations, coffee whiteners, herbal tea mixes, and some gelatin preparations. U.S. exports of fruit and vegetables to ASEAN members and to China were projected to fall by over US$50 million per year and by about US$30 million per year, respectively. U.S. fresh and processed fruit exports, in particular, face considerable competition in the region.
Both United States and China export high volumes of fresh fruits. In the past, Chinese fresh fruit could not compete with that of the United States in global markets. This was mostly because of the poor quality of Chinese fruit, as scarce cold storage and poor rural infrastructure in China took its toll on perishable products traveling long distances for export. As China becomes better able to supply high-quality fruit at a low cost to nearby Asian markets, competition with the United States could intensify . The United States and China both export large quantities of apples to several Asian markets, including Indonesia, Malaysia, and India. Chinese apple exports to Vietnam, a low-cost apple market, averaged $53 million between 2008 and 2010, far outpacing average U.S. apple exports of $8 million to Vietnam during the same period . Both China and the United States also export large quantities of fresh and frozen vegetables. For onions and shallots,
4
Japan is the only market where competition takes place, with China exporting $117 million in 2010 and the United States $35 million . Competition is generally greater in frozen vegetables, which can be transported across long distances with little loss in quality.
China benefited from a competitive advantage relative to the United States in its proximity to ASEAN market, its lower labor and production costs, and its undervalued Yuan relative to the U.S. dollar. China also benefits from globalization and changing production pattern where production and assembly of higher valued-added products were moved from the United States and other developed countries to China .
Laos, Myanmar and Vietnam have long border area with China. Moreover, it is a fundamental fact of geography that India is in the immediate neighborhood of ASEAN. Both countries share land and maritime borders with Myanmar, Indonesia and Thailand. The vital commercial sea lanes between West Asia and South East Asia straddle the Indian mainland and its island territories.
Since, for both economic benefits and non-economic reasons, ASEAN and their dialog partners as well as top trading partners like China, India, Japan and Korea have done Free Trade Agreements (FTA), there would be some competitions among the top trading partners (FTA members and non-FTA members) as well as between FTA member countries in ASEAN market. Trade competition intensity may depend upon the structure and pattern of trade of emerging countries and declining countries. By doing Free Trade Agreements (FTA), it may lose or gain to their member countries.
5
1.2 Significance of the study
ASEAN did not attempt any significant economic cooperation initiatives until the new international political environment emerged at the end of the 1980s. Its first major initiative was ASEAN Free Trade Area (AFTA), which was established in 1992. At the 2002 ASEAN Summit in Phnom Penh, it was proposed that the region should consider the possibility of creating an ASEAN Economic Community (AEC) by 2020. In the 2007 “Cebu Declaration” the ASEAN leaders not only formalized this commitment but also actually pushed up the deadline to 2015. The primary goal of economic integration in ASEAN is to reduce transactions costs associated with economic interchange and to make the region more attractive to multinational corporations wishing to take advantage of its diversity and openness in rationalizing production networks.
One of the main factors that contributed to the development of ASEAN was
the geographical proximity of its member states. The region has great geographical variations, as it located between India and China. Agricultural trade is of large importance to ASEAN, as it has a large agricultural foundation and arable land mass encompassing over 60 million hectares. Within the last decade, ASEAN countries have rapidly increased production and consumption of agricultural products. Agriculture and food imports provide food security, which is also a high priority for ASEAN countries .
The Asian Financial Crisis of the late 1990s caused several countries in the ASEAN region to experience economic volatility. Since then, the affected ASEAN
6
members have made enormous progress towards economic integration and currency stabilization. One possible channel for reviving the region’s economic dynamism in the world economy is to invigorate intra-regional trade. Sound domestic demand and intra-regional trade will continue to be strong drivers for regional growth through the next couple of years with India and China propelling the region. While ASEAN is collectively sizable, it is dwarfed by the Big Three of East Asia—China, Japan, and the Republic of Korea. Therefore, an attractive strategic option for ASEAN is to expand trade with the Big Three. Since well before the global financial crisis, ASEAN countries have sought to promote trade with each other and with the Big Three. The primary motivation for such efforts lay in seeking new sources of dynamism and growth after the 1997/98 Asian financial crisis deprived the region of its momentum and self-confidence. Finally, the 1997/98 Asian crisis served as a catalyst for regional cooperation and integration in East Asia. The broader consequence was a generalized trend toward deeper integration of the regional economies. ASEAN countries have concluded recent bilateral agreements with two large emerging markets in the region, China and India. ASEAN countries trade more in agricultural goods with China and India than do other countries as a percentage of their total trade in agriculture .
According to official 2010 US trade statistics, ASEAN is ranked as the United States’ fourth-largest export market and fifth-largest supplier of imports. U.S. exports of fruits and vegetables to the ASEAN countries are decreasing by over $50 million per year. The pattern of US trade deficits with most individual ASEAN members has remained steady. For each year from 2001 to 2010, the United States
7
had trade deficits with at least seven of the ten ASEAN countries . The economic cooperation between ASEAN countries and Japan has been concentrated on trade, investment and official development assistance for several years. The relation with Japan has come to spectacular after the emergence of the People Republic of China as competitor and market destination of ASEAN. The triangle relationship has changed. Japan has diverted her investment from ASEAN towards China in order to restore her competitiveness of labor intensive industries.
The China–ASEAN Free Trade Area (ACFTA) is one of the largest free trade areas in terms of population, gross economic outputs and trade volume. China's motivations in offering ACFTA are both political and economic. Politically, China wishes to remain on friendly terms with its neighbors on its southern front. ACFTA is part of confidence building that includes China's participation in the ASEAN Regional Forum and China's accession to the ASEAN Treaty of Amity. China is also eyeing the ASEAN region for its various natural resources, especially oil and its market of 560 million consumers. Closer economic relations with ASEAN will enable China to build its geopolitical clout in Southeast Asia and counterbalance the influences of Japan and US. The swift progress of ACFTA has hastened Japan as well as the US, South Korea and India to propose economic cooperation arrangements with ASEAN as well ASEAN governments welcomed the China initiative for a number of reasons. China and ASEAN will be able to go further than the WTO in liberalizing agricultural trade, as China's temperate agriculture and ASEAN's tropical agriculture are complementary in many product areas .
8
Consistent with its natural resource endowments of abundant rural labor and limited agricultural land on a per capita basis, China’s agricultural exports are concentrated in labor-intensive products (compared with the United States and its other main trading partners), such as fresh and processed fruits and vegetables. If a comparison is made between labor/land resources and capital, China certainly has comparative advantages in agriculture. ASEAN is the only region that has a balanced agricultural trade with China. These two regions do not differ distinctly in relative factor endowments. Rather, climate makes a difference in determining bilateral agricultural trade patterns. China exports temperate horticultural products and grains (except rice), soya and cotton to ASEAN, and imports mostly tropical products and rice from ASEAN .
As Japanese market is not fully liberalized for primary industry especially agriculture and food processing products, Japan-ASEAN trade arrangement (FTA), if initiated, may aggravate trade deficit with Japan for most of members, except only the case of Singapore . The ASEAN-Japan Comprehensive Economic Partnership (AJCEP) will help continue the momentum for further invigoration of trade and investment in the region. ASEAN and Japan are important trading partners. After a decline of 25% in 2009 due to the global economic and financial crisis, total trade between ASEAN and Japan increased by 32.0 per cent in 2010, amounting to US$103.1billion from, US$78.1 billion in 2009. Total trade grew by 26.7 per cent, amounting to US$203.9 billion in 2010. Japan is ASEAN’s third largest trading partner in 2010 with 10.0 per cent share of ASEAN’s total trade.
9
India has a large and diverse agriculture and is one of the world’s leading producers. India is the third largest economy in Asia after Japan and China, as measured in terms of its Gross Domestic Product (GDP) and it is continuing to grow rapidly. India became a sectoral dialogue partner of ASEAN in 1992. Mutual interest in wider engagement led ASEAN to invite India to become a full dialogue partner of ASEAN during the Fifth ASEAN Summit in 1995 (ASEAN-Secretariat, 1995) and a member of the ASEAN Regional Forum (ARF) in July 1996. The ASEAN-India FTA is expected to encompass a strategic and political partnership, thus going well beyond a traditional FTA agreement . As a reflection of the interest of ASEAN and India to intensify their engagement, the ASEAN-India Partnership for Peace, Progress and Shared Prosperity, was signed at the 3rd ASEAN-India
Summit on 30 November 2004. A Plan of Action (2004-2010) was also developed to implement the Partnership. Subsequently, the new ASEAN-India Plan of Action for 2010-2015 was developed and adopted by the Leaders at the 8th ASEAN-India
Summit in October 2010.
India’s merchandise exports to ASEAN have more than tripled from about US$ 1.0 billion in 1991-92 (5.7 % of its world exports) to US$ 3.4 billion in 2001-02 (7.7 % of its world exports). The overall trend has been upwards, except during the East Asian crisis period of 1997-99 . The agricultural trade flows between India and ASEAN increased from US $19.8 billion in 2000 to US $75.5 billion in 2008. Bilaterally, there was more than two fold trade expansion for both India and ASEAN between 2000 and 2008. As a share of India’s total agricultural exports, ASEAN which accounted for 9.7 percent in 2000 increased to 15.2 percent in 2008
10
(Raju, 2010). The ASEAN-India Trade in Goods (AITIG) Agreement was signed on 13 August 2009. The entry into force of the Agreement starting 1 January 2010 paves the way for the creation of one of the world’s largest free trade areas - a market comprising 1.8 billion people with a combined gross domestic product of approximately US$2.74 trillion as of 2009. In 2010, the total trade between ASEAN and India was US$ 55.4 billion, a growth of 41.8 % from US$39.1 billion in 2009. This accounted for 2.7% of the total ASEAN trade in 2010. Despite impact of the global financial/economic crisis, India remained the seventh largest trading partner of ASEAN and the sixth largest investor in ASEAN in 2009. At the 8th
ASEAN-India Summit in October 2010, the Leaders reaffirmed their commitment to achieve bilateral trade target of US$ 70 billion by 2012.
Australia was a net exporter to ASEAN in 1997, but by 2005 imports from ASEAN exceeded exports by over 50 per cent. Over the past decade, Australian exports to ASEAN grew on average by 3 per cent per year. The 1997 Asian financial crisis pulled down growth rates briefly but had only a marginally dampening effect on long-term rates of growth in Australia’s ASEAN-bound exports. Australia’s export growth rates to ASEAN were influenced by other longer term trends, including the growth of Australia’s exports to China and other regions (Nandan, 2006b).
There had been a significant expansion of trade between ASEAN-6 and Korea. The bilateral trade between ASEAN-6 and Korea increased more than seven-fold during 1989-2006, from less than $8 billion in 1989 to over $56 billion in 2006. Even though trade volume declined during 1997-98 when both parties were
11
battered by the Asian financial crisis, it recovered after 1999. Its bilateral trade rebounded to nearly $25 billion at the end of 1999 and expanded to over $33 billion in 2001, higher than the pre-crisis level. Korea had recorded a consistent trade surplus during 1989-2006, with the exception of 2001-2005 periods.
The dramatic expansion of Korea-ASEAN trade in components was largely an intra-industry trade in Machinery and Transport Equipment. Korea exports to ASEAN are the products for which Korea has comparative advantage and vice versa. The Republic of Korea (Korea) is the second dialogue partner with whom ASEAN has forged a free trade agreement. In 2005, ASEAN and Korea signed the Framework Agreement on Comprehensive Economic Cooperation (Framework Agreement), and subsequently, signed four more agreements that form the legal instruments for establishing the ASEAN-Korea Free Trade Area (AKFTA).
The top 20 partner countries of ASEAN import market for all types of commodities in 2009 were China, Japan, USA, South Korea, Germany, Saudi Arabia, France, Australia, United Arab Emirate, India, Hong Kong, Great Britain, Taiwan, Qatar, Italy, Switzerland, Netherlands, Russia, Kuwait and Brazil (ASEAN statistics, 2010). The top 10 commodities imported from ASEAN in 2009 were “Electric machinery, equipment and parts; sound equipment; television equipment”, “Mineral fuels, mineral oils & products of their distillation; bitumen substances; mineral wax”, “Nuclear reactors, boilers, machinery and mechanical appliances; parts thereof”, “Iron and steel”, “Vehicles, (not railway, tramway, rolling stock); parts and accessories”, “Plastics and articles thereof”, “Articles of iron or steel”, “Optical, photographic, cinematographic, measuring, checking, precision, medical
12
or surgical instruments/ apparatus; parts & accessories”, “Organic chemicals” and “Natural or cultured pearls, precious or semiprecious stones, precious metals and metals clad therewith and articles thereof; imitation jewelry; coin” (ASEAN statistics, 2008). Since ASEAN is a net exporting region for agricultural trade, it is important to know the agriculture products which will play as the major commodities in each trade competition country pair in ASEAN import market. In this regards, the present study will provide top partners in ASEAN agricultural import market and the major agricultural commodities which would play as major crops in their trade competitions.
1.3 Objectives of the study
The specific objectives of the study are:
(1) To find out the top 20 partners of agriculture and non-agriculture import products in the ASEAN import market,
(2) To investigate the nature and extend of competition among the major exporters in the ASEAN import market,
(3) To know the pattern of competitive threat from one specific country to other exporters
(4) To identify the nature of trade substitution among the major trading partners, with insights on the factors contributing to competitiveness,
(5) To find major products which play significant role in trade competitions in ASEAN import market, and
13
(6) To analyze the effect of ASEAN Free Trade Agreement (AFTA) on ASEAN import market.
1.4 Organization of the study
The first chapter of the study gives introduction to the present investigation. A brief review of the pertinent literature concerning the problem under investigation has been presented in the second chapter. The description of the study area has been given in the third chapter. The fourth chapter deals with the methodology and analytical framework used in the study. Besides, this chapter also describes the data requirements to achieve the intended objectives. The results of the empirical analysis are presented and discussed in the fifth chapter. In the sixth chapter, conclusion has been presented along with appropriate policy implications.
14
II. LITERATURE REVIEWS
2.1 ASEAN Regional Trade
Consequences of the ASEAN Economic Community (AEC) were investigated using a dynamic computable general equilibrium (CGE) model. When the removal of trade barriers were combined with reductions in administrative and technical barriers and lowering the trade and transport margins under the assumption of endogenously determined productivity, the estimated welfare gains for the year of 2015 range from 1.1% in Indonesia to 9.4% in Thailand. The results suggested that streamlining customs procedures and other reductions in administrative and technical barriers, as well as increased competition and improvements in infrastructure, were significant in enlarging the benefits of the AEC (Hiro Lee , et al. 2011).
Minda C. mangabat and Antonette P. Natividad (2007) highlighted that ASEAN’s stated goal is economic integration, with more prosperous, more efficient and highly competitive economies, making ASEAN a single market and production base of the world market with free flow of goods, services, investment and freer flow of capital. This in itself was a big challenge for ASEAN that requires. Another challenge that faces ASEAN was the expansion of its realm by including Japan, South Korea, and China to increase complementarity and make the region a more potential and stronger force in international trade .
15
Schwarz and Villinger (2004) studied that ASEAN was aware of the need to further diversify its engines of growth from the traditional growth engines of the US, Japan and more recently, China, to India as well. Diversification of growth engines and greater integration among the members are imperative if the region is to reduce its susceptibility to boom and bust cycles that it has faced since the mid-1990s.
David Arase (2010) has explained why, for reasons specific to China and ASEAN, they consider non-traditional security (NTS) to be a critical concern. China-ASEAN NTS cooperation defends exclusive state sovereignty, and shared norms govern an institutionalized process of regularized consultation leading flexibly to various formal agreements. Viewed alone, NTS cooperation creates political partnership and a sub-regional security complex. When viewed in tandem with ACFTA, the NTS cooperation process might be seen as part of the most advanced and comprehensive working model of regionalism in East Asia. In comparative perspective, it embodied an approach to security that, compared to the West, was functionally distinct, institutionalized in process more than in form, and reflective of the norms of authoritarian developmentalism.
Yao Chao Cheng (2005) highlighted that Asian economic unification was indeed taking shape. In the course of the process of unification, there would inevitably be disputes and conflicts with clashing economic interests amongst Asian nations. The regional economic unification process in Asia as part of economic globalization should no doubt produce a pan-Asian economic community. Asians should have their own unified currency in the future, perhaps in 50 years’ time or
16
even longer, as experienced by the Europeans. Of course, China's role in the process of Asian economic unification could never be neglected. Not only would it greatly influence the unification process, but it would also exert a significant influence on the nature of the world in the 21st century. The largest impact of a rising China on Asia and the world should finally lie in the outcomes of the country's internal reforms .
2.2 ASEAN Free Trade Agreements
Gemma Estrada et al. (2011) indicated that the natural policy implication for ASEAN policymakers is to concentrate their efforts on bilateral FTAs. They have already made a lot of progress in this regard, having concluded bilateral FTAs with the PRC and the Republic of Korea. Since AJFTA will deliver substantial benefits for ASEAN, policymakers should also prioritize AJFTA. AJFTA was also beneficial to Japan which was conducive for ASEAN’s pursuit of AJFTA. Finally, their analysis of ASEAN’s FTAs with the Big Three were predicated on the premise that ASEAN’s pursuit of closer trade links with its large neighbors should not compromise its vital trade links with the outside world.
Sunitha Raju (2010) presented that the bilateral trade flows between India & ASEAN have expanded by fivefold during 2000 and 2008. The proposed India‐ASEAN FTA has aimed at enhancing these trade gains and provides potential trade opportunities for both India and ASEAN. With respect to agricultural trade balance, ASEAN has maintained a trade surplus which has increased until 2006 and
17
then declined over the last few years. India’s concern, in this regard, would be to examine if this trend entails a severe import threat under a lower tariff regime. The structure of agricultural trade between India and ASEAN is skewed. ASEAN has emerged as an important trading partner for India in agricultural products.
Kenichi Kawasaki (2003) discussed a quantitative simulation analysis on the impact of Japan’s FTAs in Asia using a CGE model of global trade. It has been argued that a regional FTA would be a step toward global trade liberalization rather than a final goal. In fact, it was shown that changes in sectoral trade balance and production would vary according to the partners in Japan’s FTAs in Asia deviating from those expected in global trade liberalization. Moreover, the terms of trade effects would be relatively significant in determining the overall welfare impacts in partial trade liberalization. On the other hand, capital formation mechanisms were shown to be particularly important for macroeconomic gains in several ASEAN countries. It was suggested that liberalization and facilitation of not just the trade of goods but also investment would be essential for economic partnerships in Asia .
Scott Mcdonald et al. (2008) has considered the empirical implications, particularly for developing countries, of the continuation of two strong trends in the global economy: (1) the continued integration of the E&SE (East and South East) Asia trading bloc, and (2) the continued rapid growth of important countries in Asia, with increasing pressure on world markets for manufactures and primary commodities. The results for the integration scenarios indicated that a) an effective E&SE Asia FTA would increase welfare in the region and generate small losses for countries outside the bloc; b) an effective E&SE Asia and India FTA would lead to
18
welfare gains for India, while generating substantial additional gains for the E&SE Asia members; and c) continued integration involves significant changes in the structure of production in, and trade by, the E&SE Asia and India bloc while Advanced Asian regions redirect exports from the European Union and the United States toward countries within the bloc, while other members increase their exports to the European Union and United States .
Hiro Lee et al. (2004) observed China’s accelerated global emergence has changed trade patterns in the Asia-Pacific region and exerted important influence on its trilateral relationship with Japan and the United States. They evaluated the effects of multilateral and regional trade policy scenarios that are particularly relevant to China, Japan, and the United States using a dynamic global computable general equilibrium (CGE) model. The results suggested that the three countries would gain substantially from a trilateral free trade agreement and could realize large fractions of the residual gains from global trade liberalization. They contrasted this with prospective free trade agreements (FTAs) in East Asia, and they found that these FTAs largely benefit smaller member economies (e.g., ASEAN countries) .
2.2.1 Effect of Free Trade Agreements (FTA)
Konstantinos Kepaptsoglou et al. (2010) found that the gravity model has been extensively used in international trade research for the last 40 years because of its considerable empirical robustness and explanatory power. They critically reviewed and analyzed recent empirical studies exploiting the gravity model in trade
19
flow. Based on its robust performance, the gravity model has been particularly successful and popular among researchers, despite past criticism on its theoretical background. Over 75 papers in the last decade have either used it for analyzing trade policies and their implications or improved its performance; most of the policies examined focused on the effects of FTA agreements .
Matthieu Bussiere and Bernd Schnatz (2006) analysed the rapid trade integration that took place in the past decade between China and the rest of the world. It is argued that the rise in trade flows between China and its trading partners should not, per se, come as a surprise, but rather reflects China’s shift towards more marketed policies together with robust economic growth. They used a gravity model, which captures well the evolution of trade flows over time and across countries, to develop and quantify a new benchmark for trade intensity .
Innwon Park (2000) found that AFTA will enhance intra-ASEAN trade and accelerate the economic growth of ASEAN member nations. The author concluded that economies with higher pre-FTA tariff barriers and larger intra-regional trade volume such as Philippines and Thailand share larger gains from freer trade .
Ismail et al. (2007) found that GDP, population, relative endowment, distance and common language are the main determinants of bilateral trade in ASEAN. The ASEAN dummies used to measure the intra ASEAN trade prove that there was trade creation among the five ASEAN members .
Ce` line Carre`re (2004) used a gravity model to assess ex-post regional trade agreements. The model includes 130 countries and is estimated with panel data over the period 1962–1996. The introduction of the correct number of dummy
20
variables allows for identification of Vinerian trade creation and trade diversion effects, while the estimation method takes into account the unobservable characteristics of each pairs of trade partner countries, the endogeneity of some of the explanatory variables as well as a potential selection bias. In contrast to previous estimates, results show that regional agreements have generated a significant increase in trade between members, often at the expense of the rest of the world .
Bhavish Jugurnath et al (2007) used a gravity model to examine bilateral trade involving five trading blocs, with data from 26 countries from 1980 to 2000. The estimated coefficients from the basic gravity model show that GDP, population, distance between trading partners, as well as cultural similarity (a common language) and physical area explain much cross country trade .
2.3 Trade Competitions
2.3.1 Trade Competition between China and USA
Alston and Bird LLP (2011) observed that as the third-largest buyer and the fastest- growing export market for U.S. exports, China would remain at the center of the discussions in international trade. The Obama administration and U.S. businesses will continue to push for a more balanced trade relationship with China. In this regard, the administration plans to pursue a multilateral approach, which, at best, appears to be without a central mission or vision. With this backdrop, it was
21
unlikely that the United States can convince China to make major commitments towards creating a more balanced trade relationship .
John Wainio et al. (2011) found that U.S exports of dairy and poultry products to ASEAN, especially to the Philippines, were projected to decline an estimated $43 million per year, while wheat exports to ASEAN could drop by about 6 percent or $40 million annually. Total U.S. agricultural exports to ASEAN members were projected to fall by almost $350 million, or 5 to 6 percent of actual 2009 exports to the region. Globally, U.S. agricultural exports were projected to decline by $170 million after implementation of the ASEAN FTAs. The strong competitive position of the United States and relatively low tariffs facing U.S. exports in the two ASEAN FTAs reduced the adverse impact of these agreements on U.S. agricultural sales in the world marketplace.
Chuanmin Shuai (2011) found that China should adopt positive measures to further increase the international competitiveness of its agricultural products. Despite the fact that China’s agri-exports have grown faster than ever after its WTO accession, the international competitiveness of the China’s exporting agricultural products is on a downward trend. Therefore, China should continue to expand its agri-exports on the one hand, and take positive measures to enhance the international competitiveness of its agri-exports on the other. These measures include: continuing to strengthen the support for agriculture, encouraging agri-exports by adopting export facilitating policies, strengthening agri-product quality supervision from the field to the table, fostering brands for export products, and
22
advocating intensive agri-business on a moderate scale to achieve the economy of scale in agricultural production, processing and trade .
Hanho Kim et al. (2008) employed the un-centered correlation distance method to investigate the similarities in the export structure of major exporters to the Korean market. Results showed that the similar export structures of China and the United States have made the latter vulnerable to competition. The concept of competitive threat is used to determine which country faces a possible decline in food exports to Korea. They found that China posed a threat to the United States in virtually every agricultural product exported to Korea.
William Greene (2006) studied that China has made tremendous strides in gaining market share in India’s import market in commoditized -mass produced products, the United States continued to command a presence in those areas demanding innovation and those incorporating the newest features or the latest technologies. Although the United States and China competed head-to-head in a variety of industry segments, competition was most intense in high value-added technology market that includes machinery, electrical machinery, computers, and telecommunications equipment. China leapfrogged the United States in a number of
product areas particularly computers and components and various
telecommunications equipment segments. By the end of 2004 China surpassed the United States as India most important single import source and in its importance in the India computer and telecommunications equipment markets .
Hu Xiaoping et al. (2004) presented that with the progress of reform in taxes and charges in rural area of China, the non-cost expenses paid by peasant
23
would decrease gradually to a low level and thus Chinese wheat would become more competitive compared with the USA. In the situation that USA has no obvious advantage in wheat production costs over China, it was difficult for its wheat to enter the Chinese market with a Competitive price unless the U.S. government gives the farmers an export subsidy. Although the wheat production cost in China was a bit lower than that in the USA, it was impossible for China to grow more wheat to compete in the international market because of the limitation of its shortage of arable land. It would still be difficult for foreign wheat to enter the Chinese market in the coming three to five years, and this phenomenon did not come from the protection of Chinese government but from the relative competitiveness of Chinese wheat in its domestic market .
John Weiss (2004) examined differences in trade structure between China and its trading partners, finding that China’s current structure was closest to that in Korea and Taipei, China in 1990. It also considered changes in market share and found that China exports were eroding the market share of its regional neighbors in the US and Japan, particularly in products in which trading partners were most specialized. There is no evidence of FDI diversion from elsewhere in the region to China. He surveyed the projections of models that demonstrate the gains in greater trade and income for the region from closer trade links with China. The broad conclusion that emerges was that whilst there might be risks to individual sectors in all countries concerned, the pattern of regional trade and investment that is emerging was mutually beneficial, provided enterprises and governments in China’s regional partners respond effectively to the adjustments required .
24
Zhi Wang (2003) explained that the major gains from WTO accession would accrue to China itself, but the rest of the world, especially developed countries and Asian newly industrialized economies, as well as least developed countries, would also benefit due to the expansion of world trade and improvement of their international terms of trade. Only certain developing countries with an endowment structure similar to China, like those in South America and Southeast Asia, may experience keener competition in labor-intensive exports and lower prices for their products .
2.3.2 Trade Competition between China and India
Bottelier (2003) pointed out that in exports of commercial services; India lagged less behind China, being the 19th largest exporter, with a share of 1.5%.
Although growth of China’s service and merchandise exports far outpace average growth of world exports, its merchandise exports grew much faster than service exports, so that the share of service exports in total exports has fallen to one of the lowest such ratios for any major country. He noted that, in contrast, India’s service exports were growing at about double the rate of its merchandise exports, and if current trends continue, the share of service exports in total exports would exceed 50% in a decade .
Betina Dimaranan (2007) presented that there was scope for China and India to strengthen their trade ties and expand their exports and imports significantly without hurting each other’s development prospects or those of other
25
economies. However, improved growth in China and India would intensify competition in global markets for manufactures, and the manufacturing industries in many countries would be affected negatively. Improvement in the range and quality of exports from both countries had the potential to create substantial welfare benefits to the world, and to each other, and to act as a powerful offset to the terms-of-trade losses otherwise associated with rapid export growth .
Inferences from the trade indices computed for understanding the trade structure between India and ASEAN revealed that there were complementary sectors and products available for enhancing trade cooperation between the trading partners. While India can export food grains to small and developed countries of ASEAN, it could import edible and other agricultural products from other ASEAN countries. India enjoyed advantage in minerals whereas they could import crude oil from ASEAN. India had advantage in some manufactured items like chemicals, Iron and Steel, Gems and Jewellery and could export them to many ASEAN countries. ASEAN has comparative advantage in Electrical and Electronic components and India can import them from ASEAN (Chandran, 2010).
Tang Yihong and Wang Weiwei (2006) analyzed trade potential between China and ASEAN within China-ASEAN Free Trade Area. It was undeniable that there exists uncertain factors weakening the trade effect on China of China-ASEAN FTA such as barriers except for tariff; competition in the substitutes between China and ASEAN members, competition from other countries signing FTA agreements with ASEAN members in ASEAN market. The uncertain factors should not be ignored. They calculated the export similarity index of competitors in ASEAN
26
market, concluded that there exists fierce competition in ASEAN market for China either on gross trade volume level or on product level, China should optimize its export structure so as not to lose existing market share in ASEAN market .
Smitha Francis (2011) argued that the recent trends in India’s export and import structures pointed to its increasing participation in FDI-driven production networks centered on ASEAN. The implications of India’s tariff reduction commitments under the AIFTA for India’s agricultural and non-agricultural sectors were analyzed against this backdrop. It was established that ASEAN countries would gain significantly increased market access in India in several semi-processed or processed agricultural products. Both the reduced demand for local agricultural products because of this and the increased imports of close substitutes could lead to a fall in the prices of local crops and thus adversely affecting the domestic agricultural sector. India would also be competing with China and South Korea in the ASEAN market, which have already signed FTAs with ASEAN. Thus Indian SMEs would find it difficult to compete with these countries in such sectors.
2.3.3 Trade Competition between China and Japan
Chia Siow Yue (2003) investigated that the future of ASEAN-Japan economic relations needs to be assessed in the context of three factors. First, one should consider the background of how economic relations have developed between Japan and ASEAN countries since the 1960s in the areas of trade in goods and services, FDI, and the development of production networks, and technical and
27
development assistance in broad-ranging areas. Second, one should look at the current challenges posed by the economic rise of China. Competition from China was a growing reality for Japan and ASEAN. Unbridled economic rivalry would be disastrous for regional peace, stability, and prosperity, so Japan and ASEAN would have to manage their economic relations and competitiveness vis-á-vis China in such a way as will result in a win-win outcome. Third, future ASEAN-Japan economic relations should have to be considered in the context of East Asian regionalism. The rise of East Asian economic regionalism was both an opportunity and a challenge for ASEAN. In terms of opportunity, ASEAN countries would belong to a larger economic grouping and enjoy not only wider market access, but greater international clout, as well as greater regional peace and order.
Kitti Limskul (2004) discussed that trade creation of Intra-ASEAN was becoming significant. Nevertheless, the skewed trade relationship between ASEAN and Japan has caused trade deficit for ASEAN. This cannot be solved simply relying on FDI. The bilateral trade arrangement or FTA could not solve problem at hand as Japan was reluctant to open its market for agriculture product and processed food from ASEAN. The ‘multi-functionality of agriculture’ was key excuse for protection. The international trade and investment relationship has changed since the emergence of China. The trade creation of trade in Japan-ASEAN-China was sufficient condition of welfare optimization, adding on top of the flow of FDI and ODA as necessary condition. The ‘Initiative for Japan-ASEAN Comprehensive Economic Partnership’ could be materialized only if the trade creation could be
28
significantly achieved among Japan-ASEAN-China, step-by-step along every stage of comparative advantage.
Jacob Townsend and Amy King (2007) examined Sino-Japanese competition for influence in Central Asia. Both countries view the region as an important source of energy reserves and have used trade, foreign aid, and diplomacy and security cooperation to exert their influence over the Central Asian republics. The article analyzed the parallel strategies undertaken by Japan and China in Central Asia. It demonstrated that, compared with China, Japan's relationship with the region was both superficial and declining. As a result of China's deep and growing economic, political and military ties, this article concluded that Japan is losing the Central Asian "game" and that China will have far greater success in obtaining Central Asian energy resources .
Ji-hyun Park (2002) reviewed that amid changes in trade following China’s entry into the WTO, trade of farm products between Korea, China and Japan was expected to raise further, heating up competition between the three countries. Korea was positioned as an importer of farm products from China and exporter to Japan, as the three countries become more dependent on each other for trade. Currently China’s export of field-grown vegetables such as onions, carrots and radishes were mostly destined for Japan, but export to Korea was also steadily rising. Korea was increasingly importing more condiment vegetables from China while the export of greenhouse vegetables such as tomatoes, cucumbers and eggplants was mostly concentrated on Japan, and was expected to further rise with lower production, yet higher demand in Japan. While exporting vegetable seeds to Korea and China,