Silver superlens using antisymmetric
surface plasmon modes
Wook-Jae Lee,1,3Jae-Eun Kim,1Hae Yong Park,1and Myung-Hyun Lee2,4
1Department of Physics, KAIST, Daejeon 305-701, Korea
2School of Information and Communication Engineering, Sungkyunkwan University, Suwon 440-746, Korea
3[email protected] 4[email protected]
Abstract: Silver lenses having super-resolution are analyzed in terms of antisymmetric modes of surface plasmon which have the ability to amplify evanescent waves in UV region. Antisymmetric surface plasmon modes excited by subwavelength grating enhances the resolution and contrast of silver superlens. By using a 20 nm-thick silver superlens, the
half-pitch resolution of ∼λ0/8 can be achieved with good contrast at a
free space wavelength of 435 nm. The resolution of silver superlens can also be improved using shorter illumination wavelength. We show that the thinner the lens, the better the imaging ability of the silver superlens due to the excitation of antisymmetric surface plasmon modes of higher propagation wave vectors. The thickness of lens is varied from 20 to 40
nm in a three layer system, SiO2-Ag-SiO2. Obtained results illustrate that
practical application for patterning periodic structures with good contrast and penetration depth can be achieved by using antisymmetric surface plasmon modes.
© 2010 Optical Society of America
OCIS codes: (050.6624) Subwavelength structures; (080.3620) Lens system design; (100.6640) Superresolution; (110.5220) Photolithography; (240.6680) Surface Plasmons.
References and links
1. J. B. Pendry, “Negative refraction makes a perfect lens,” Phys. Rev. Lett. 85, 3966–3969 (2000).
2. V. G. Veselago, “The electrodynamics of substances with simultaneously negative values ofεandμ,” Sov. Phys. Usp. 10, 509–514 (1968).
3. D. O. S. Melville and R. J. Blaikie, “Super-resolution imaging through a planar silver layer,” Opt. Express 13, 2127–2134 (2005).
4. N. Fang, H. Lee, C. Sun, and X. Zhang, “Sub-diffraction-limited optical imaging with a silver superlens,” Science 308, 534–537 (2005).
5. Z. Liu, N. Fang, T. J. Yen, and X. Zhang, “Rapid growth of evanescent wave by a silver superlens,” Appl. Phys. Lett. 83, 5184–5186 (2003).
6. N. Fang, Z. Liu, T. J. Yen, and X. Zhang, “Regenerating evanescent waves from a silver superlens,” Opt. Express 11, 682–687 (2003).
7. D. Sarid, “Long-range surface-plasma waves on very thin metal films,” Phys. Rev. Lett. 47, 1927–1930 (1981). 8. G. I. Stegeman, J. J. Burke, and D. G. Hall, “Surface-polaritonlike waves guided by thin, lossy metal films,” Opt.
Lett. 8, 383–385 (1983).
9. X. Luo and T. Ishihara, “Surface plasmon resonant interference nanolithography technique,” Appl. Phys. Lett. 84, 4780–4782 (2004).
10. X. Luo and T. Ishihara, “Subwavelength photolithography based on surface-plasmon polariton resonance,” Opt. Express 12, 3055–3065 (2004).
11. R. J. Blaikie and S. J. McNab, “Evanescent interferometric lithography,” Appl. Opt. 40, 1692–1698 (2001). 12. W. Srituravanich, N. Fang, C. Sun, Q. Luo, and X. Zhang, “Plasmonic nanolithography,” Nano Lett. 4, 1085–1088
(2004).
13. Z. W. Liu, Q. H. Wei, and X. Zhang, “Surface plasmon interference nanolithography,” Nano Lett. 5, 957–961 (2005).
14. A. D. Raki´c, A. B. Djriˇsi´c, J. M. Elazar, and M. L. Majewski, “Optical properties of metallic films for vertical-cavity optoelectronic devices,” Appl. Opt. 37, 5271–5283 (1998).
15. Handbook of Optical Constants of Solids, edited by E. Palik (Academic Press, New York, 1985).
16. J. A. Dionne, L. A. Sweatlock, H. A. Atwater, and A. Polman, “Planar metal plasmon waveguides: frequency-dependent dispersion, propagation, localization, and loss beyond the free electron model,” Phys. Rev. B 72, 075405 (2005).
17. C. Reale, “Optical constants of vacuum deposited thin metal films in the near infrared,” Infrared Phys. 10, 175– 181 (1970).
18. M. Yano, M. Fukui, M. Haraguchi, and Y. Shintani, “In situ and real-time observation of optical constants of metal films during growth,” Surf. Sci. 227, 129–137 (1990).
19. W.-J. Lee, J.-E. Kim, H. Y. Park, S. Park, M.-s. Kim, J. T. Kim, and J. J. Ju, “Optical constants of evaporated gold films measured by surface plasmon resonance at telecommunication wavelengths,” J. Appl. Phys. 103, 073713 (2008).
20. D. R. Smith, D. Schurig, M. Rosenbluth, S. Schultz, S. A. Ramakrishna, and J. B. Pendry, “Limitations on subdiffraction imaging with a negative refractive index slab,” Appl. Phys. Lett. 82, 1506–1508 (2003). 21. N. Fang and X. Zhang,“Imaging properties of a metamaterial superlens,” Appl. Phys. Lett. 82, 161–163 (2003). 22. C. M. Moore, M. D. Arnold, P. J. Bones, and R. J. Blaikie, “Image fidelity for single- and multi-layer silver
superlenses,” J. Opt. Soc. Am. A 25, 911–918 (2008).
23. S. A. Ramakrishna, “Physics of negative refractive index materials,” Rep. Prog. Phys. 68, 449–521 (2005). 24. http://ab-initio.mit.edu/meep
25. R. J. Blaikie and S. J. McNab, “Simulation study of ‘perfect lenses’ for near-field optical nanolithography,” Microelectron. Eng. 61–62, 97–103 (2002).
26. H. Raether, Surface Plasmons on Smooth and Rough Surfaces and on Gratings (Springer, Berlin, 1988).
1. Introduction
Conventional lenses create images by capturing propagating waves from an object. They, how-ever, cannot control evanescent waves that contain a lot of information about the object. The absence of evanescent waves results in the diffraction-limited image of the object which is about
a half of a free space wavelength (λ0). In 2000, an interesting theory about a perfect lens was
proposed by Pendry [1]. He theoretically showed that a slab of negative index material (NIM) can be used to produce optical images with resolution below the diffraction limit through ampli-fication of evanescent waves as well as focusing propagating waves. The key of Pendry’s theory, which was based on a 30-year-old theory by Veselago [2], was that the evanescent waves could be enhanced through the excitation of a collective movement of surface waves and refocused by a slab of NIM. Hence the perfect lens can create a perfect image by completely recovering both the propagating and evanescent waves. Furthermore, Pendry suggested that the dependence on
the magnetic permeabilityμof the perfect lens is eliminated at the electrostatic limit and only
the dielectric constantεneeds to be negative to support resonant surface waves for one specific
polarization. For example, a silver slab under UV light can act as a perfect lens. In the case of a silver slab, however, the term “superlens” is used instead of “perfect lens” because the
imag-inary part of the dielectric constantεof silver slab obstructs perfect focusing. Optical imaging
with super-resolution below the diffraction limit was experimentally demonstrated using a thin slab of silver at optical frequencies [3, 4].
Previous studies [4–6] on silver lenses reported that the enhancement of evanescent waves strongly depends on the thickness of silver and bound layers. The super-resolution confirmed by experimental studies is up toλ0/6 using the optimized thickness of silver and bound layers in
order to maximize the enhancement of evanescent waves [4]. This resolution has been accepted rightfully to be the best possible value in UV region as the fact that the material loss in a metal becomes dominant is taken into consideration.
For the realization of optical superlensing with sub-diffraction-limit resolution, it is neces-sary for the surface plasmon (SP) waves to be excited at the silver surface to achieve the en-hancement of the evanescent field through a silver slab. However, there is not just one SP mode for silver lenses [7, 8]. A lossy metal film such as a silver slab bounded by dielectric media can always support a total of four SP modes consisting of a symmetric, an antisymmetric, and leaky modes. Thus, a silver slab can enhance the magnitude of certain spatial frequency, which means that the propagation wave vector of corresponding SP mode becomes amplified. In this paper, we present theoretical analysis of silver lens in terms of SP modes and demonstrate that the antisymmetric SP (ASP) modes enables one to improve the resolution of silver superlens as the thickness of silver lens and/or the free space wavelength decreases.
2. Symmetric and antisymmetric surface plasmon modes
In order to obtain good near-field image, there have been many studies on the use of SP modes on silver or other metal films for lithography [9–13]. We employed SP modes analysis in a
three layer system, SiO2-Ag-SiO2. As shown in Refs. 7 and 8, the SP mode in a thin metal film
splits into a symmetric and an antisymmetric mode as the metal thickness decreases , and the symmetry is classified by the field distribution of the magnetic field parallel to the silver slab (Hy) as shown in Fig. 1(a).
z Ez(z) z z Ag z z z Symmetric mode Antisymmetric mode
(a)
(b)
z x SiO2 SiO2 SiO2 SiO2 Ag Ez(z) Ex(z) Ex(z) Hy(z) Hy(z)Fig. 1. (a) Field profiles of symmetric and antisymmetric SP modes in the structure of a thin metal layer sandwiched between two dielectric media. (b) Dispersion relation of SPs on a silver film surrounded by SiO2as a function of the thickness of silver slab. Solid and broken lines are for the antisymmetric and symmetric SP modes, respectively. Black dotted line indicates the surface plasmon resonance frequency. Leaky modes are not shown.
This introduces the ASP mode to silver lens. According to Ref. 8, Fig. 1(b) illustrates the
dispersion relation for the SPs on a silver layer bounded by SiO2 for different thicknesses
of silver film. The leaky modes are not considered here. The optical constants of silver are
modeled using the Drude-Lorentz model [14] and those of SiO2are adopted from Palik data
[15,16], respectively. In the figure, the black horizontal dotted line indicates the surface plasmon resonance (SPR) frequency of about 3.3 eV. It is observed that the real part of the propagation wave vector for the ASP mode increases as the thickness of silver film decreases. Whereas, the propagation wave vector for the symmetric SP mode below the SPR frequency increases as the thickness of silver film increases and the amount of increment is much smaller than that of the ASP mode with decreasing film thickness. Therefore, it is quite clear that the ASP mode can amplify corresponding higher spatial frequency as the thickness of metal film decreases.
We, however, consider only the cases in which the thickness of silver slab is thick enough to maintain the value of optical constants in bulk silver, which is above 20 nm [17–19].
3. Results and discussion
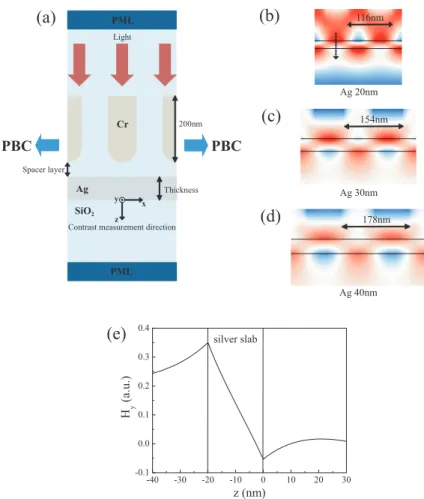
Performance of silver superlenses using the ASP mode has been investigated with a grating structure depicted in Fig. 2(a). Many studies have been carried out analyzing the performance of silver superlenses [20–23]. We employed the finite-difference time-domain (FDTD) method using a freely available software package MEEP [24] to show the excitation of the ASP mode
in a SiO2-silver-SiO2 system. The considered structure consists of a chrome grating placed
between SiO2and 20 nm-thick spacer layer, a silver film of 20, 30, and 40 nm thickness each,
and SiO2as the background material as shown in Fig. 2(a). The trenches of the chrome grating
have a 50% duty-cycle and the grating period corresponds to the propagation wave vector of the ASP mode. The edges of the gratings are rounded off because the field enhancement at the edges create new light sources. In the x-direction the periodic boundary conditions (PBC) are employed and the perfectly matched layer (PML) absorbing boundary condition is applied in the y-direction. The grid size of the FDTD calculation was 0.5 nm.
Figures 2(b), 2(c), and 2(d) show the magnitudes of magnetic field, Hy. SPs are excited
by a plane wave ofλ0of 435 nm and the gratings as a result of interference. The periods of
three gratings used are 116, 154, and 178 nm and each period corresponds to the propagation wave vector for the ASP mode of 20, 30, and 40 nm thickness of the silver slab, respectively.
Displayed in Fig. 2(e) is the Hy mode profile along the broken arrow line in the z-direction
shown in Fig. 2(b). The field distribution apparently describes the profile of the ASP mode. In order to determine the resolution of the imaging process, we estimated the ratio of the maximum to minimum of the field intensity which is called the image contrast [3]. However, the SP field fluctuates perpendicularly to the silver surface as a function of time. Thus, the time averaged total electric and magnetic energy density has to be employed. The image contrast is defined in Ref. 3 as
V =EDmax− EDmin EDmax+ EDmin ,
where EDmaxand EDminare the maximum and minimum energy density, respectively.
Comparison of the contrast as a function of the distance from the silver surface is shown in Fig. 3(a). The image contrast steadily increases until a certain distance in the z-direction because the SP excitation gives rise to the enhancement of both the maximum and minimum energy densities near the surface of silver slab. The maximum contrast occurs at about z = 30, 50 and 70 nm for 20, 30, and 40 nm-thick silver lenses, respectively. Similar results were reported using the vector electromagnetic field modelling [25]. As the SP wavelength becomes large (thicker silver lens), the spatial distribution of SP field perpendicular to the silver surface
extends far into SiO2 and the penetration depth of the SP field becomes larger than in the
thinner silver lens [8, 26]. We also obtained the image constrasts for the three different silver films with the same grating period of 116 nm as shown in Fig. 3(b). The silver superlens of only 20 nm-thick leads to the field enhancement due to the ASP mode and the image contrast at deeper depths maintains larger values than in the other thicker silver lenses. The line traces of the energy density profile along the x-axis which is measured at 10 nm below each silver slab are shown in the inset of Fig. 3(b). The amplification of both the maximum and minimum energy densities originated in the ASP mode is obviously observed in the 20 nm-thick silver lens. These results show that the ASP mode can improve the resolution of the silver superlens and the resolution can be controlled by the thickness of the silver film. The ASP mode excited
at the 20 nm-thick silver lens results in the half-pitch resolution with good contrast of∼λ0/8
Ag 20nm Ag 30nm
(b)
(c)
Ag 40nm(d)
Light PML PML Cr PBC PBC Thickness SiO2 Ag x z Spacer layer 200nm(a)
(e)
Contrast measurement direction
116nm
154nm
178nm
y
Fig. 2. (a) Cross-section of the considered superlens structure. In the x-direction, the pe-riodic boundary conditions and in the z-direction, the perfectly matched layer absorbing boundary condition are employed, respectively. Spatial distributions of the SP field (Hy) at
the excitation wavelength of 435 nm for (b) 20 nm-thick Ag film with grating period of 116 nm, (c) 30 nm-thick Ag film with grating period of 154 nm and (d) 40 nm-thick Ag film with grating period of 178 nm. (e) Hymode profile along the dotted arrow line drawn in
figure (b) as a function of the distance in the z-direction. Excited Hymodes profile clearly
show the antisymmetric SP mode distribution.
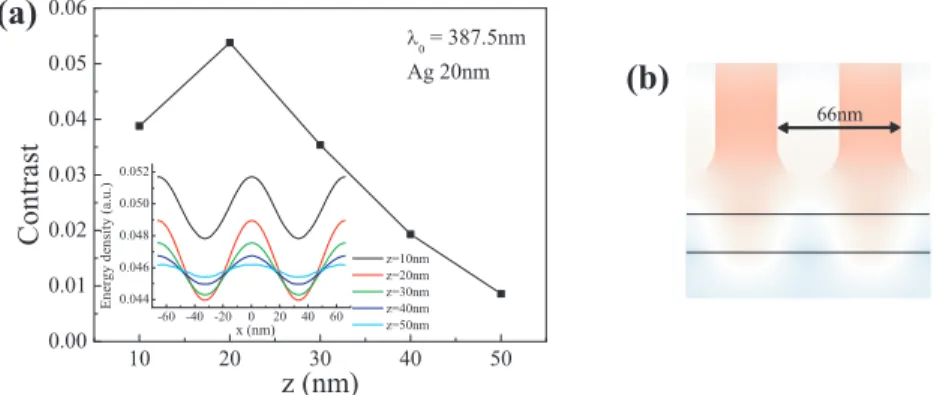
Further analysis reveals that the resolution can be improved by using the light of shorter wavelength. Figure 4(a) describes the image contrast as a function of the distance from the surface of the 20 nm-thick silver lens at a free space wavelength of 387.5 nm. The grating
period corresponding to the propagation wave vector for the ASP mode is 66 nm (∼λ0/12
half-pitch resolution). The contrast is about ten times smaller compared with the case ofλ0=
435 nm with its maximum value at around z = 20 nm. The line traces of the energy density profile which are measured as a function of the distance z from the silver surface are shown in the inset. The maximum and minimum energy densities near the surface are strong and become weaker as the distance from the surface increases. The penetration depth of the SP field for thin silver film gets reduced with smaller mode size because the propagation wave vector of the ASP mode is larger [26] and the smaller mode size also leads to higher loss because of larger mode overlap with the silver slab. In Fig. 4(b), the electric field parallel to the silver slab (Ex)
(a)
(b)
Fig. 3. Image contrasts of the three silver superlenses as a function of the distance z from the silver surface. (a) Grating periods are 116, 154, and 178 nm, which respectively correspond to the propagation wave vector for the ASP mode of silver layers of 20, 30, and 40nm-thick. (b) The same 116-nm period gratings are employed for three silver layers of different thickness. Shown in the inset are the line traces of the energy density profile along the x-axis obtained with the same 116-nm period gratings which are extracted at z = 10 nm below each silver surface.
(a)
(b)
66nm
Fig. 4. (a) Image contrast obtained with the grating period of 66 nm, corresponding to the propagation wave vector for the ASP mode of 20 nm-thick silver lens, at the excitation wavelength of 387.5 nm. The line traces of the energy density profile as a function of z are shown in the inset. (b) Spatial distribution of the SP field Ex. Exdepicts the profile of the
ASP mode as those shown in Fig. 1(b).
is displayed instead due to the weak intensity of the Hyfield, and it exhibits the profile of the
ASP mode as can be seen in Fig. 1(a). Although the image contrast is as low as less than 0.06, it is obvious from these results that the ASP mode plays a key role in improving the resolution of the silver superlens.
4. Conclusion
In conclusion, we studied the improvement of resolution of silver superlens as a function of the thickness of the silver film in terms of the ASP mode. The SP mode excited at the interface between silver slabs of various thicknesses and dielectric media splits into a symmetric and an antisymmetric mode. As the thickness of the silver lens decreases, the resolution of superlens can indeed be enhanced significantly because the propagation wave vector of the ASP mode
contrast at 435 nm illumination wavelength and the resolution can be further improved by using
the excitation wavelength of 387.5 nm to∼λ0/12. This technique offers design parameters
for patterning periodic nanostructures because for a light source of fixed wavelength, desired resolution can easily be realized using a silver superlens sandwiched between properly chosen dielectric layers, and vice versa.
Acknowledgments