INTRODUCTION
Intensity modulated radiation therapy (IMRT) is a new approach to the planning and delivery of radiation (1, 2). Unlike 2-dimensional radiotherapy (2D-RT) and 3-dimen-sional radiotherapy (3D-CRT), IMRT allows more confor-mal dose coverage of the clinical target volume (CTV) in three dimensions, thereby sparing the surrounding normal tissues. Highly conformal treatment plans may reduce the risk of radiation toxicities and provide a means of potential-ly escalating the dose to target in selected patients, thus im-proving tumor control.
Head and neck cancers, especially nasopharyngeal cancer, are good candidates for IMRT because of their horseshoe-shaped CTVs and many critical normal organs that surround
the CTV (3). Improving the conformity of the radiation dose to targets in the head and neck using IMRT promises reduced toxicity and, in some cases, improved loco-regional tumor control (3-7). Recently published phase III studies confirmed that IMRT provides superior treatment results with lower morbidity than conventional 2D- or 3D-CRT (8, 9).
IMRT may actually be disadvantageous in some situations, however, because it is relatively difficult to plan and admin-ister. The planning process for IMRT is greatly influenced by physician-dependent factors such as segmentation of the target volume and non-tumor tissues on the planning CT, and specifying the dose to the target and the surrounding normal organs. Although many hospitals are now equipped with IMRT capabilities, the excellence of next level practice achieved by the use of IMRT could differ among hospitals
248
Sung Ho Park, Hee Chul Park*, Suk Won Park�
, Do Hoon Oh� , Youngmin Choi�
, Jeung Kee Kim� , Yong Chan Ahn*, Won Park*, Hyun Sook Suh‖
, Rena Lee‖ , and Hoonsik Bae
Department of Radiation Oncology, Asan Medical Center, College of Medicine, University of Ulsan, Seoul; Department of Radiation Oncology*, Samsung Medical Center, Sungkyunkwan University School of Medicine, Seoul; Department of Radiation Oncology�
, College of Medicine, Chung-Ang University, Seoul; Department of Radiation Oncology�
, Kangdong Sacred Heart Hospital, College of Medicine, Hallym University, Seoul; Department of Radiation Oncology�
, Dong-A University Medical Center, Busan; Department of Radiation Oncology‖
, Ewha Womans University Mokdong Hospital, Seoul; Department of Radiation Oncology¶, Hallym University Sacred Heart Hospital, College of Medicine, Hallym University, Anyang, Korea
Address for correspondence Hee Chul Park, M.D.
Department of Radiation Oncology, Samsung Medical Center, 50 Ilwon-dong, Gangnam-gu, Seoul 135-710, Korea
Tel : +82.2-3410-2612, Fax : +82.2-3410-2619 E-mail : [email protected]
*This work was supported by Korea Food and Drug Administration grant in 2006 (No. 06112-305). DOI: 10.3346/jkms.2009.24.2.248
Multi-institutional Comparison of Intensity Modulated Radiation
Therapy (IMRT) Planning Strategies and Planning Results for
Nasopharyngeal Cancer
The intensity-modulated radiation therapy (IMRT) planning strategies for nasopha-ryngeal cancer among Korean radiation oncology facilities were investigated. Five institutions with IMRT planning capacity using the same planning system were invit-ed to participate in this study. The institutions were requestinvit-ed to produce the best plan possible for 2 cases that would deliver 70 Gy to the planning target volume of gross tumor (PTV1), 59.4 Gy to the PTV2, and 51.5 Gy to the PTV3 in which elec-tive irradiation was required. The advised fractionation number was 33. The plan-ning parameters, resultant dose distributions, and biological indices were compared. We found 2-3-fold variations in the volume of treatment targets. Similar degree of variation was found in the delineation of normal tissue. The physician-related fac-tors in IMRT planning had more influence on the plan quality. The inhomogeneity index of PTV dose ranged from 4 to 49% in Case 1, and from 5 to 46% in Case 2. Variation in tumor control probabilities for the primary lesion and involved LNs was less marked. Normal tissue complication probabilities for parotid glands and skin showed marked variation. Results from this study suggest that greater efforts in providing training and continuing education in terms of IMRT planning parameters usually set by physician are necessary for the successful implementation of IMRT.
Key Words : Radiotherapy; Intensity-Modulated; Radiotherapy Planning Computer-Assisted; Quality
Assur-ance; Nasopharyngeal Neoplasms
Received : 1 April 2008 Accepted : 26 June 2008
depending on the clinical situation and the treatment team. Preparedness in performing IMRT is a crucial factor in its implementation.
In Korea, IMRT practices were established in several cen-ters in 2001, and it is now being rapidly adopted. Accord-ing to a 2006 survey conducted by the Korean Society for Therapeutic Radiology and Oncology (KOSTRO), 22 of 61 (35%) radiotherapy facilities nationwide possessed the hard-ware capacity necessary to implement IMRT practice (10). Although several Korean facilities have undertaken planning studies and explored the feasibility of IMRT in their clinic, it appears that a lack of preparedness exists in terms of fully implementing IMRT as a clinical routine (3, 4, 11-13).
The purpose of the present study was to investigate IMRT planning strategies for nasopharyngeal cancer among Kore-an radiation oncology facilities. We compared the plKore-anning parameters, resultant dose distributions, and values of bio-logical indices, including normal tissue complication proba-bilities (NTCP) and tumor control probaproba-bilities (TCP), with a treatment plan generated in five different institutions using the same radiation treatment planning system (RTPS) for the same clinical cases. We also discussed the measures need-ed to improve the degree of clinical excellence in implement-ing IMRT as an advanced treatment technology.
MATERIALS AND METHODS Study schemes
In May 2006, five institutions, all with the same RTPS with IMRT planning capacity, were invited to participate in this study. As planning images, contrast-enhanced comput-ed tomography (CT) scans were providcomput-ed for Case 1. For Case 2, both contrast-enhanced CT scans and positron emission tomography (PET) images were provided. Planning images for the study cases were obtained on a Discovery ST PET-CT scanner (GE Healthcare, Milwaukee, WI, U.S.A.), using a slice thickness of 0.37 cm, and with the patients immobilized in the supine position using a Type S thermoplastic mask (Medtec, Orange City, IA, U.S.A.). Planning images were de-identified prior to use in the study. The employed IMRT planning platform was the p3-IMRT inverse planning mod-ule of Pinnacle3(Philips, Fitchburg, WI, U.S.A.) commer-cial RTPS. Back-up CD disks were prepared with the treat-ment plans for the study cases; these plans had no added re-gions of interests (ROIs), beams, or inverse planning param-eters. The beam commissioning data for a standard linear accelerator was added to these plans and used for dose calcu-lations. We used the beam data of a Primus linear accelera-tor (Siemens, Munich, Germany) housed at a participating institution.
Each institution received the back-up CDs. The plans for the two clinical cases were restored in the RTPS of each
insti-tution. IMRT plans were performed in each institution accord-ing to the study guidelines, up to the step of generataccord-ing ideal intensity maps for the beams. The treatment plans from each institution were then compiled and restored in a planning computer as different trials of the treatment planning data; the data were then analyzed.
Treatment planning guidelines
The participating institutions were requested to produce the best plan possible that would deliver 70 Gy to the plan-ning target volume of gross tumor (PTV1), 59.4 Gy to the region of high-risk regional lymph nodes (PTV2), and 51.5 Gy to the lymph node area (PTV3) in which elective irradi-ation was required. The advised fractionirradi-ation number was 33. Delineation of the target volume and normal organs, the number and orientations of the beams, and the prescribed number and type of dose constraints were left to the discre-tion of the planning teams in each institudiscre-tion.
Clinical cases
Case 1 was a 50-yr-old male diagnosed with cT2aN1 poorly differentiated squamous cell carcinoma of the nasopharynx. The primary tumor involved the right side of the Rosen-mu_ller fossa and posterior wall of the nasopharynx, and ex-tended to the posterior oropharyngeal wall. There was lymph node (LN) metastasis to the right level 2 area.
Case 2 was a 24-yr-old female diagnosed with T2bN2 un-differentiated carcinoma of the nasopharynx. The primary tumor involved the left side of the nasopharynx and extend-ed to the parapharyngeal fatty tissues. There was tumor in-volvement in the left-sided retropharyngeal LNs and bilat-eral level 2 LNs.
Plan comparison
IMRT planning strategies were compared. Parameters compared in the planning process included the delineation of target volume and normal organs, the number and orien-tations of the beams, and the prescribed number and type of dose constraints for optimization of the inverse planning.
General features of the planning results were compared, including the prescribed monitor unit (MU), maximum dose and its location, inhomogeneity index of the dose distribution to individual institution’s PTV, and the deviation of D50from
the planning goal. The homogeneity index was defined as (D5
-D95)/(Dmean). Dvolumewas defined as the dose level where the
cumulative dose volume histogram (DVH) intersects with the given volume of the ROI. Dmeanwas defined as the mean
dose received by the ROI. The distributions of the isodose curve and DVHs for individual institution’s PTV were also compared.
clinical case were set as the standard ROIs. To avoid poten-tial difficulties in comparing plans that might have risen had ROIs been delineated separately by individual institutions, both standard ROIs and individual institution’s ROIs were used for the comparison of dose statistics and biological in-dices among institutions. TCP was calculated via the Oku-nieff model, using the values of the dose of 50% tumor con-trol (TCD50), slope50, and γ50(14). NTCP was calculated via
the Lyman-Kutcher-Burman model, using the Kutcher-Bur-man histogram reduction scheme, with n and m as deter-mined by Burmann et al. (15, 16).
RESULTS Contouring of the ROIs
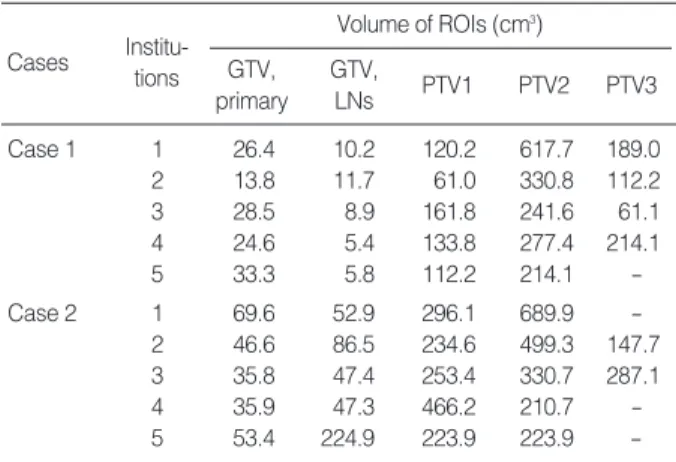
We found differences in the volumes contoured as the gross tumor volume (GTV) of the primary tumor and the involved
LNs (Table 1). GTV of the primary tumor was 13.8-28.5 cm3
in Case 1, and 35.8-69.6 cm3in Case 2. The volumes of PTV1,
PTV2, and PTV3 were also different: we found 2-fold vari-ation in the volume of PTV1, and a 3-fold varivari-ation in the volume of PTV2. One institution did not delineate PTV3 in Case 1, and three institutions did not delineate PTV3 in Case 2. This marked variation was due to difference in the level of lymph node areas treated as high risk area, and those treated as areas for elective nodal irradiation (Table 2). The major difference among institutions consisted of whether they decided to treat the level 1 and contralateral level 5 lymph node areas.
The variations encountered in contouring of the target vol-umes are presented on the same axial CT slice (Fig. 1). The contoured GTV for Case 2 was more consistent than that of Case 1. Although the degree of volumetric differences was the same in both cases, delineation of the GTV assisted by PET images appeared to cover the gross tumor more consis-tently, as in Case 2. For delineation of PTV2 and PTV3, al-most all of the institutions used geometrical extension from the margin of anatomical structures such as regional LN areas; however, in constructing PTV2, Institution 2 used the direct geometrical extension from PTV1 without consideration for the anatomical margin of the regional LN area.
A similar degree of variation was identified in the delin-eation of normal tissue. All institutions delineated the pa-rotid glands, eye balls, lens, optic nerve, and spinal cord. Not all institutions delineated the brainstem, pituitary gland, optic chiasm, oral cavity, trachea, esophagus, inner ear, vocal cord, brain, and temporal lobe of the brain. Some institutions excluded the deep lobe of the parotid gland from the struc-tures to be spared, especially in the involved side (Fig. 2). Only two institutions used the planning at risk volume (PRV), which is expanded with margins ranging from 2 to 3 mm from contoured normal tissues such as lens, brainstem, and spinal cord.
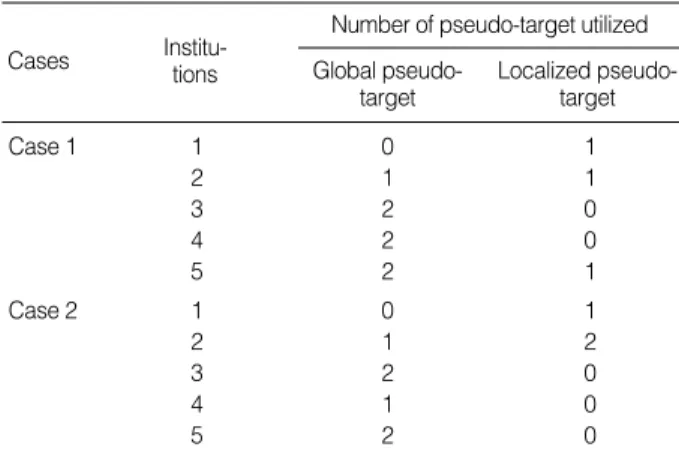
All institutions used the so-called ‘pseudo-target’ structure
ROI, region of interest; GTV, gross tumor volume; LN, lymph node; PTV, planning target volume.
Volume of ROIs (cm3) GTV, primary Institu-tions Cases Institutions Cases GTV, LNs PTV1 PTV2 PTV3 Case 1 1 26.4 10.2 120.2 617.7 189.0 2 13.8 11.7 61.0 330.8 112.2 3 28.5 8.9 161.8 241.6 61.1 4 24.6 5.4 133.8 277.4 214.1 5 33.3 5.8 112.2 214.1 -Case 2 1 69.6 52.9 296.1 689.9 -2 46.6 86.5 234.6 499.3 147.7 3 35.8 47.4 253.4 330.7 287.1 4 35.9 47.3 466.2 210.7 -5 53.4 224.9 223.9 223.9
-Table 1. Variation in contouring among participating institutions
LN, lymph node; PTV, planning target volume.
Ipsilateral LN level
Level of the neck nodal area
1 2 3 4 5 Contralateral LN level 1 2 3 4 5 Case 1 1 2 3 4 5 Case 2 1 2 3 4 5
Table 2. Variation in PTV delineation among participating institutions
- PTV1 PTV2 - PTV3 PTV2 PTV1 PTV3 - PTV3 PTV2 PTV1 PTV2 PTV3 PTV2 - PTV2 PTV3 - -PTV2 PTV1 PTV2 PTV3 PTV2 - PTV2 PTV3 - -- PTV1 PTV2 - PTV2 - PTV2 - - -PTV2 PTV1 PTV3 PTV2 PTV2 PTV1 PTV2 PTV3 - PTV1 PTV2 - PTV2 - -PTV2 PTV1 PTV2 PTV2 PTV1 PTV3 PTV1 PTV2 PTV1 PTV2 PTV2 PTV1 PTV2 PTV2 PTV1 PTV2
around the PTV to enhance dose conformity or normal tis-sue avoidance while performing optimization. Differing num-ber of variously shaped pseudo-targets were used: global, local, or both (Table 3, Fig. 3).
Planning parameters
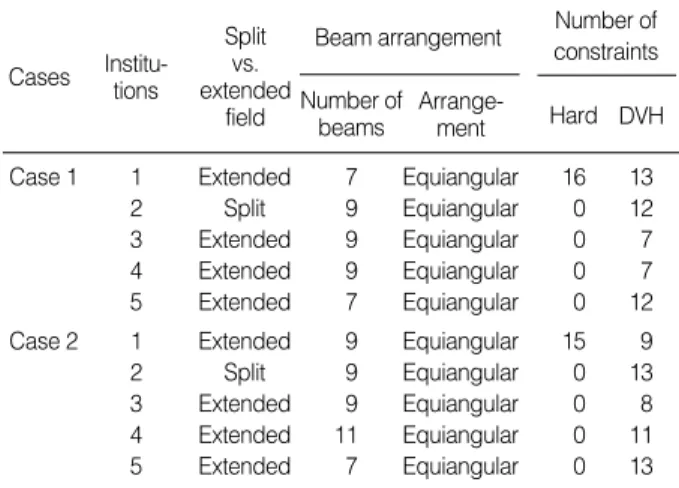
Wide variation also existed in the setting of planning para-meters (Table 4). Only one institution used the split-field IMRT technique, in which the low anterior neck is treated with an anterior field and matched with the IMRT portion. All of the others used extended whole-field IMRT, in which all of the target volumes are included within the IMRT field. The number of employed beams ranged from 7 to 11. All institutions used coplanar beams with equally spaced angles. The p3-IMRT inverse planning module of Pinnacle3 pro-vides two different methods for prescribing constraints for optimization. A hard constraint is the maximum or
mini-mum dose for a ROI to be met absolutely while optimizing beam intensity, whereas a DVH constraint is the dose pre-scribed to a certain percentage of ROI volume that can be bargained using a weighting factor for each constraint. Only one institution applied hard constraints. The number of pre-scribed constraints ranged from 7 to 29, with a variety of weighting factors applied for each constraint.
Dose statistics and biologic indices
The general features of the planning results are presented in Table 5. The number of MUs planned to be delivered showed wide variability: 466-1,134 in Case 1 and 490-2,269 in Case 2. MU was normalized for 90% of PTV1 to be covered with
Fig. 1. Variation in the delineation of GTV (A), PTV1 (B), PTV2 (C) among institutions.
Color key: red, institution 1; green, institution 2; blue, institution 3; yellow, institution 4; magenta, institution 5.
GTV, gross tumor volume; PTV, planning target volume. A C B PTV1, Case 1 PTV1, Case 2 GTV, Case 1 GTV, Case 2 PTV2, Case 1 PTV2, Case 2
Fig. 2. Variation in the parotid gland delineation among institutions. Color key: red, institution 1; green, institution 2; blue, institution 3; yellow, institution 4; magenta, institution 5.
Fig. 3. Types of delineated pseudo-targets.
Case 1 Case 2
Global type Local type
Number of pseudo-target utilized Global
pseudo-target
Cases Institu-tions Localized
pseudo-target Case 1 1 0 1 2 1 1 3 2 0 4 2 0 5 2 1 Case 2 1 0 1 2 1 2 3 2 0 4 1 0 5 2 0
Table 3. Variation in utilization of a pseudo-target among par-ticipating institutions
70 Gy in Institution 2, and for 50% in Institution 5. The other institutions did not normalize MU for target coverage. The maximum dose ranged from 72.7 to 90.1 Gy in Case 1 and from 74.7 to 167.8 Gy in Case 2. The skin was the loca-tion of maximum dose in half of the plans assessed. The in-homogeneity index of PTV dose ranged from 4 to 49% in Case 1, and from 5 to 46% in Case 2. The percentage devia-tion of D50 from the dose of the planning goal was greater in PTV2 and PTV3 than in PTV1.
Because the individual institution’s ROIs and the employed planning parameters were different for each institution, there was a striking range in the distribution of isodose curves and the DVH (Fig. 4, 5). The resulting plans by Institutions 1 and 2 showed excess dose deposit in the skin, oral cavity, and the soft tissues in the neck. The inferior border of the retro-pharyngeal lymph node was insufficiently covered in Insti-tution 5. DVH for PTV2 showed that some instiInsti-tutions failed to obtain a sharp dose fall-off at the border between DVH, dose volume histogram.
Beam arrangement Number of beams Arrange-ment Cases Institu-tions Split vs. extended field
Case 1 1 Extended 7 Equiangular 16 13
2 Split 9 Equiangular 0 12
3 Extended 9 Equiangular 0 7
4 Extended 9 Equiangular 0 7
5 Extended 7 Equiangular 0 12
Case 2 1 Extended 9 Equiangular 15 9
2 Split 9 Equiangular 0 13
3 Extended 9 Equiangular 0 8
4 Extended 11 Equiangular 0 11
5 Extended 7 Equiangular 0 13
Table 4. Variation in the planning parameters utilized among participating institutions
Number of constraints Hard DVH
ROI, region of interest; MU, monitor unit; Max., maximum; PTV, planning target volume; D50, the dose where the cumulative DVH intersects with 50%
of the volume; DVH, dose volume histogram.
Cases Institu-tions Total MU MU normalize Max. dose (Gy) Location of max. dose Deviation of D50
from planning goal (%)
PTV1 PTV2 PTV3 Homogeneity index PTV1 PTV2 PTV3 Case 1 1 893 No 82.3 PTV1 0.17 0.26 0.17 +4.0 +6.6 +3.9 2 1,134 Yes 90.1 Skin 0.07 0.24 0.49 +2.4 +7.6 +5.8 3 466 No 72.7 Muscle 0.08 0.12 0.04 -2.1 -1.2 -1.4 4 599 No 77.6 Skin 0.07 0.10 0.05 -1.3 -0.7 -0.4 5 638 Yes 80.4 Skin 0.04 0.18 - +0.6 +5.6 -Case 2 1 1,281 No 167.8 Skin 0.14 0.46 - +7.4 +17.2 -2 2,269 Yes 123.2 Skin 0.10 0.18 0.22 +3.1 +10.9 +13.8 3 490 No 75.2 PTV1 0.08 0.11 0.05 -1.9 +0.2 -0.4 4 559 No 79.4 Vertebrae 0.14 0.15 - -1.3 -1.9 -5 593 Yes 74.7 PTV1 0.05 0.17 - -1.1 +4.0
-Table 5. General features of the planning results
Fig. 4. Variation of isodose distribution among participating institutions (Case 2).
PTV1 and PTV2, and that the high-dose area in PTV2 was even hotter than that in PTV1 in one institution.
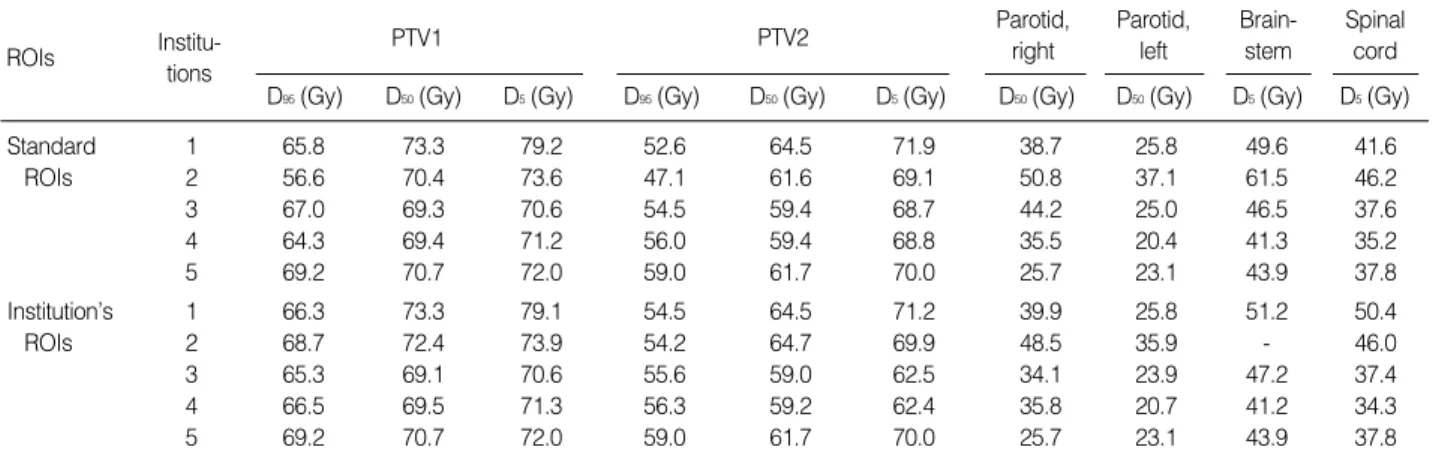
For given clinical cases, the dose statistics showing IMRT dose delivery patterns showed marked variations for both of standard ROIs and individual institution’s ROIs among insti-tutions (Table 6). The values of D95for PTV1 were less than the prescribed dose in all plans. In Institution 1, D5for PTV1 was more than 110% of the prescribed dose. The sparing of the parotid glands was tightest in Institution 5, with consid-eration that Institution 5 delineated the deep lobe on both sides. The other institutions tried to spare at least one parotid gland, located at the contralateral side of the primary tumor. D5values for the spinal cord exceeded 45 Gy in one institu-tion for standard ROI and in two instituinstitu-tions for individual institution’s ROI. The value of D5for brainstem exceeded 54 Gy in one institution.
In contrast to the profound variations recorded in dose statistics for PTV, variation in TCP for the primary lesion and involved lymph nodes was not so pronounced for both standard ROIs and individual institution’s ROIs (Table 7).
Norm. volume 1.0 0.9 0.8 0.7 0.6 0.5 0.4 0.3 0.2 0.1 0.0 0 1,000 2,000 3,000 4,000 5,000 6,000 7,000 8,000 9,000 Dose (cGy)
Dose volume histogram Dose volume histogram
Dose (cGy) Norm. volume 1.0 0.9 0.8 0.7 0.6 0.5 0.4 0.3 0.2 0.1 0.0 0 1,000 2,000 3,000 4,000 5,000 6,000 7,000 8,000 9,000
Fig. 5. Variation of the dose volume histogram for planning target volumes among participating institutions (Case 2). Color key: red, institution 1; green, institution 2; blue, institution 3; yellow, institution 4; magenta, institution 5.
ROI, region of interest; PTV, planning target volume; D95, the dose where the cumulative DVH intersects with 95% of the volume; D50, the dose where the
cumulative DVH intersects with 50% of the volume; D5, the dose where the cumulative DVH intersects with 5% of the volume; DVH, dose volume
his-togram.
ROIs
Institu-tions
PTV1
D95(Gy) D50(Gy) D5(Gy) D95(Gy) D50(Gy) D5(Gy) D50(Gy) D50(Gy) D5(Gy) D5(Gy)
PTV2 Parotid, right Parotid, left Brain-stem Spinal cord Standard 1 65.8 73.3 79.2 52.6 64.5 71.9 38.7 25.8 49.6 41.6 ROIs 2 56.6 70.4 73.6 47.1 61.6 69.1 50.8 37.1 61.5 46.2 3 67.0 69.3 70.6 54.5 59.4 68.7 44.2 25.0 46.5 37.6 4 64.3 69.4 71.2 56.0 59.4 68.8 35.5 20.4 41.3 35.2 5 69.2 70.7 72.0 59.0 61.7 70.0 25.7 23.1 43.9 37.8 Institution’s 1 66.3 73.3 79.1 54.5 64.5 71.2 39.9 25.8 51.2 50.4 ROIs 2 68.7 72.4 73.9 54.2 64.7 69.9 48.5 35.9 - 46.0 3 65.3 69.1 70.6 55.6 59.0 62.5 34.1 23.9 47.2 37.4 4 66.5 69.5 71.3 56.3 59.2 62.4 35.8 20.7 41.2 34.3 5 69.2 70.7 72.0 59.0 61.7 70.0 25.7 23.1 43.9 37.8
Table 6. Dose statistics for standard ROIs and each institution’s ROIs (Case 1)
ROI, region of interest; TCP, tumor control probability; NTCP, normal tissue complication probability; GTV, gross tumor volume.
TCP (%) GTV, primary lesion GTV, involved lymph nodes NTCP (%) Skin Parotid, left Parotid, right Cases Institu-tions Standard 1 99 100 45 2 14 ROIs 2 90 100 78 14 26 3 95 100 52 4 2 4 96 100 25 1 2 5 97 100 11 2 3 Institution’s 1 99 100 52 2 -ROIs 2 99 100 51 10 -3 95 100 24 2 -4 96 100 23 1 -5 97 100 11 2
-Table 7. Biological indices for standard ROIs and each institu-tion’s ROIs (Case 1)
The NTCP for parotid glands and skin was largely unsatis-factory, showing marked variation among institutions. Con-sidering the trend to sacrifice the parotid gland of the in-volved side, the NTCP for the contralateral side still showed unsatisfactory results in some institutions. Excess dose deliv-ery to the skin, as shown in Fig. 4, explains the high NTCP of the skin in Institutions 1 and 2.
DISCUSSION
In Korea, IMRT is in the early stage of implementation, with routine use limited to a small number of hospitals; how-ever, more hospitals are being equipped with modern state-of-the-art IMRT technology (10). Some institutions in Korea have performed the planning studies and explored the feasi-bility of IMRT in the clinical settings (3, 4, 11-13). The Kore-an Radiation Oncology Group (KROG) is currently per-forming a study regarding the optimal radiation prescrip-tion using IMRT in applying simultaneous integrated boost for nasopharyngeal cancer (KROG-0501).
Early publications on IMRT for head and neck cancer sug-gested significant heterogeneity in global head and neck IMRT practice patterns (17). For the same prescribed target dose and dose constraints for organ at risk, IMRT strategies in the study showed striking difference in various aspects, such as beam setup, total number of segments, PTV dose coverage and dose statistics for organs at risks. This Euro-pean Society for Therapeutic Radiology and Oncology (ES-TRO) planning exercise demonstrated that the planning of IMRT needs close cooperation between the various disci-plines involved in the preparation and execution of a treat-ment.
It is believed that much of the heterogeneity in IMRT arises from physician-based factors. Clearly, radiation oncologists should receive sound training in those factors determined by the physician in performing IMRT, including target delin-eation, setting of parameters for objective functions, inter-pretation of the resultant plan, and understanding of uncer-tainties in delivery. It appears that there exists a lack of pre-paredness for fully implementing IMRT as a clinical routine in Korea. This study was therefore undertaken to assess the pattern of planning strategies for head and neck IMRT plan-ning, with particular emphasis on physician-based factors such as identifying the target volume and non-tumor tissues on the planning CT, and specifying the dose to the target volume and the surrounding normal organs.
The factors such as RTPS, its optimization algorithm, beam data, and other physical QA-related issues were identically controlled, meaning that physician-related factors in IMRT planning (e.g., target segmentation and the prescription for inverse planning) have a greater influence on the resulting plan quality than QA issues in the delivery of complex IMRT plan. Although physical QA issues are also important,
physi-cian-based factors in IMRT planning are critical, and must undergo preparation before state-of-the art IMRT technolo-gy can be implemented in the clinical setting.
The present study identified marked variations in IMRT design and global patterns of planning strategies for IMRT of nasopharyngeal cancer in Korea. Substantial variations existed not only in target definition and dose prescription, but also with regard to the management of neck node areas; consequently, the resultant IMRT plans were strikingly dif-ferent among the institutions. The variation in volume seg-mentation translated into the variation of dose statistics for standard ROIs. However, the dose statistics for individual institution’s ROIs also showed substantial variation among institutions. This indicates that the difference of planning quality originates not only from the difference of ROI delin-eation but from the ability to perform inverse planning.
One of the shortcomings of the current study is that target volume determination guidelines and plan acceptance guide-lines were not provided to each institution participated. It was remained to each institution’s discretion. The IMRT could not be planned with only condition of doses of PTV1, PTV2 and PTV3 and without target determination guideline, accep-tance criteria and so on. The marked variations in IMRT de-sign and global patterns of planning results shown in the current study are not only due to the quality of IMRT plan-ning in each institution but because of the lack of precise guideline while performing the IMRT planning. However, the institutions participated are in substantial agreement that the cause of wide variation of planning results are main-ly due to variation of physician-based factors such as volume segmentation and setting the parameters for inverse planning. This wide variation could potentially be translated into dif-ferent treatment outcomes between each institution.
Preparedness in performing IMRT is a crucial factor in its implementation. In the present study, the planning results of Institution 1 and 2 were relatively difficult to brag out. At the time of this planning study, Institution 1 and 2 did not performed IMRT for clinical cases. The attainment of excel-lence in IMRT practice requires greater effort in terms of time, man-power, and education, among other factors. Given the growing popularity of IMRT, it is not surprising that numerous IMRT ‘‘schools’’, seminars, and workshops have appeared internationally. However, there are few education-al opportunities available for participating radiation oncolo-gists in Korea. The human resources available to the KOS-TRO radiation oncology society remain limited (10).
It is also necessary to support efforts to develop ‘class-solu-tion’, in which an automated inverse planning protocol using a single set of inverse-planning parameters can be used for most patients to generate an acceptable IMRT plan. This would eliminate the need for time-consuming user-interface optimization in most cases. The adoption of computer-based assistance for physician factors in IMRT is also desirable (18).
REFERENCES
1. Intensity Modulated Radiation Therapy Collaborative Working Group.
Intensity-modulated radiotherapy: current status and issues of inter-est. Int J Radiat Oncol Biol Phys 2001; 51: 880-914.
2. Ezzell GA, Galvin JM, Low D, Palta JR, Rosen I, Sharpe MB, Xia P, Xiao Y, Xing L, Yu CX. Guidance document on delivery,
treat-ment planning, and clinical impletreat-mentation of IMRT: report of the IMRT Subcommittee of the AAPM Radiation Therapy Committee. Med Phys 2003; 30: 2089-115.
3. Lee SW, Back GM, Yi BY, Choi EK, Ahn SD, Shin SS, Kim JH, Kim SY, Lee BJ, Nam SY, Choi SH, Kim SB, Park JH, Lee KK, Park SH, Kim JH. Preliminary results of a phase I/II study of
simul-taneous modulated accelerated radiotherapy for nondisseminated nasopharyngeal carcinoma. Int J Radiat Oncol Biol Phys 2006; 65: 152-60.
4. Lee SW, Kim GE, Suh CO, Chu SS, Lee KK, Moon SR. Intensity
modulation technique using the complementary boost-fields for eth-moid sinus cancer. Clin Oncol (R Coll Radiol) 2002; 14: 241-9.
5. Lee N, Xia P, Quivey JM, Sultanem K, Poon I, Akazawa C, Akaza-wa P, Weinberg V, Fu KK. Intensity-modulated radiotherapy in the
treatment of nasopharyngeal carcinoma: an update of the UCSF experience. Int J Radiat Oncol Biol Phys 2002; 53: 12-22.
6. Chao KS, Ozyigit G, Tran BN, Cengiz M, Dempsey JF, Low DA.
Patterns of failure in patients receiving definitive and postoperative IMRT for head-and-neck cancer. Int J Radiat Oncol Biol Phys 2003; 55: 312-21.
7. Eisbruch A, Marsh LH, Dawson LA, Bradford CR, Teknos TN, Chep-eha DB, Worden FP, Urba S, Lin A, Schipper MJ, Wolf GT.
Recur-rences near base of skull after IMRT for head-and-neck cancer: im-plications for target delineation in high neck and for parotid gland sparing. Int J Radiat Oncol Biol Phys 2004; 59: 28-42.
8. Mendenhall WM, Amdur RJ, Palta JR. Intensity-modulated
radio-therapy in the standard management of head and neck cancer: pro-mises and pitfalls. J Clin Oncol 2006; 24: 2618-23.
9. Kam MK, Leung SF, Zee B, Chau RM, Suen JJ, Mo F, Lai M, Ho R, Cheung KY, Yu BK, Chiu SK, Choi PH, Teo PM, Kwan WH,
Chan AT. Prospective randomized study of intensity-modulated
radio-therapy on salivary gland function in early-stage nasopharyngeal carcinoma patients. J Clin Oncol 2007; 25: 4873-9.
10. Huh SJ; Korean Society of Therapeutic Radiology and Oncology (KOSTRO). Current status of the infrastructure and characteristics
of radiation oncology in Korea. Jpn J Clin Oncol 2007; 37: 623-7.
11. Kim JY, Kim DY, Kim TH, Park SY, Lee SB, Shin KH, Pyo H, Kim JY, Cho KH. Intensity-modulated radiotherapy with a belly board
for rectal cancer. Int J Colorectal Dis 2007; 22: 373-9.
12. Choi Y, Kim JK, Lee HS, Hur WJ, Chai GY, Kang KM. Impact of
intensity-modulated radiation therapy as a boost treatment on the lung-dose distributions for non-small-cell lung cancer. Int J Radiat Oncol Biol Phys 2005; 63: 683-9.
13. Choi Y, Kim JK, Lee HS, Hur WJ, Hong YS, Park S, Ahn K, Cho H. Influence of intravenous contrast agent on dose calculations of
intensity modulated radiation therapy plans for head and neck can-cer. Radiother Oncol 2006; 81: 158-62.
14. Okunieff P, Morgan D, Niemierko A, Suit HD. Radiation
dose-res-ponse of human tumors. Int J Radiat Oncol Biol Phys 1995; 32: 1227-37.
15. Kutcher GJ, Burman C. Calculation of complication probability
fac-tors for non-uniform normal tissue irradiation: the effective volume method. Int J Radiat Oncol Biol Phys 1989; 16: 1623-30.
16. Burman C, Kutcher GJ, Emami B, Goitein M. Fitting of normal
tis-sue tolerance data to an analytic function. Int J Radiat Oncol Biol Phys 1991; 21: 123-35.
17. Claus F, Mijnheer B, Rasch C, Bortfeld T, Fraass B, De Gersem W, Wirtz H, Hoinkis C, Cho BC, Kwong LW, Bae H, Muller K, De Neve W. Report of a study on IMRT planning strategies for ethmoid sinus
cancer. Strahlenther Onkol 2002; 178: 572-6.
18. Chao KS, Bhide S, Chen H, Asper J, Bush S, Franklin G, Kavadi V, Liengswangwong V, Gordon W, Raben A, Strasser J, Koprowski C, Frank S, Chronowski G, Ahamad A, Malyapa R, Zhang L, Dong L.
Reduce in variation and improve efficiency of target volume delin-eation by a computer-assisted system using a deformable image reg-istration approach. Int J Radiat Oncol Biol Phys 2007; 68: 1512-21.