저작자표시-비영리-변경금지 2.0 대한민국 이용자는 아래의 조건을 따르는 경우에 한하여 자유롭게 l 이 저작물을 복제, 배포, 전송, 전시, 공연 및 방송할 수 있습니다. 다음과 같은 조건을 따라야 합니다: l 귀하는, 이 저작물의 재이용이나 배포의 경우, 이 저작물에 적용된 이용허락조건 을 명확하게 나타내어야 합니다. l 저작권자로부터 별도의 허가를 받으면 이러한 조건들은 적용되지 않습니다. 저작권법에 따른 이용자의 권리는 위의 내용에 의하여 영향을 받지 않습니다. 이것은 이용허락규약(Legal Code)을 이해하기 쉽게 요약한 것입니다. Disclaimer 저작자표시. 귀하는 원저작자를 표시하여야 합니다. 비영리. 귀하는 이 저작물을 영리 목적으로 이용할 수 없습니다. 변경금지. 귀하는 이 저작물을 개작, 변형 또는 가공할 수 없습니다.
i
Master
’s Thesis of Landscape Architecture
Does an introduction of a park
affect the survival of surrounding
industries?
– A case study of Hongdae, Seoul, South Korea
공원의 조성이 주변 산업의 생존에 미치는 영향
- 홍대지역을 중심으로-
February, 2020
Graduate School of Seoul National University
Department of Landscape Architecture and Rural
Systems Engineering, Landscape Architecture Major
ii
Does an introduction of a park
affect the survival of surrounding
industries?
– A case study of Hongdae, Seoul, South Korea
Under the Direction of Adviser, Prof. Heeyeun Yoon
Submitting a master
’s thesis of
Landscape Architecture
February, 2020
Graduate School of Seoul National University
Department of Landscape Architecture and Rural Systems
Engineering, Landscape Architecture Major
Haewon Moon
Confirming the master
’s thesis
written by Haewon Moon
February, 2020
Chair
(Seal)
Vice Chair (Seal)
Examiner (Seal)
i
Abstract
This study aims to reveal how the creation of urban parks affects the business survivals of retail establishments in the vicinity. We conducted a survival analysis with a case of Hongdae and Yeonnam retail district in Seoul, South Korea from 2009 to 2018. We revealed that distance from Gyeongui Line Forest affected the survival rate of individual stores. Specifically, stores within 500m from the park had a lower probability of closure then those situated farther. Also, the characteristics of stores showed different survival rate such as stores located in residential area, a more larger store size, and whether if it is located in the first floor were significant. Findings from this study and its methodology will be valuable in observing the relationship of urban parks and retail districts.
Keyword : Urban park, Hongdae, Retail district, Gentrification, Survival Analysis
ii
Table of Contents
Abstract ... i
List of Figures ... iii
List of tables ... iii
Chapter 1. Introduction ... 1
Chapter 2. Background ... 5
2.1 Relationship between urban parks and retail district ... 8
Chapter 3. Analytical Design ... 11
3.1 Study site, period and data ... 12
3.2 Methods and variables ... 15
3.2.1 Measure ... 15
3.2.2 Kernel density analysis ... 18
3.2.3 Survival analysis ... 19
Chapter 4. Results ... 21
4.1 Estimation of retail district area ... 21
4.2 Survival of stores by characteristics ... 23
4.3 Survival rate by distance to the park ... 31
4.4 Factors affecting the survival of stores ... 32
Chapter 5. Conclusion and discussion ... 33
Reference... 37
iii
List of Figures
Figure 1. The boundary of study site and the location of stores in the sample with reference to Gyeongui Line Forest ... 12 Figure 2. Gyeongui Line Forest in study period from establishment
plan to completion ... 12 Figure 3. Kernel density of distribution of stores in the stuy site
from 2009 to 2018 ... 21 Figure 4. Kaplan-Meier estimation of industries before the creation
of Gyeongui Line Forest in 2015 ... 23 Figure 5. Kaplan-Meier estimation of industries after the creation
of Gyeongui Line Forest in 2015 ... 23
List of Tables
Table 1. Industrial type categories ... 26 Table 2. Odds Ratio results of industries before the creation of
Gyeongui Line Forest in 2015 ... 27 Table 3. Odds Ratio results of industries after the creation of
1
Chapter 1. Introduction
Urban parks and open spaces provide benefits to the vicinity, such as recreational opportunities, aesthetic enjoyment, and even the mere existence values (Brandera & Koetseb, 2011). Parks near residential areas offer outdoor recreational opportunities to the neighborhoods (Jim, 2004; Lo & Jim, 2010; Oh & Jeong, 2007); within a walking distance, residents use urban parks as a place for jogging, cycling, picnicking, and meeting people for social interactions (Peters et al., 2010). Studies have pointed that this kind of induced outdoor activities have improved health conditions (Bedimo-Rung et al., 2005; Kardan et al., 2015; Kondo et al., 2018). Also, the property values near well-built parks generally exceed those of the equivalent properties located elsewhere, getting positive externalities from the improved physical neighborhood environments. A large quantity of literature has revealed the impact of parks on real estate values by using hedonic pricing model (Ahn, 2016; Brander & Koetse, 2011; Jim & Chen, 2010; Panduro & Veie, 2013).
Urban parks near retail areas, on the other hand, accommodate more diversified visitors than residents, providing naturalistic environments and scenic views for them to get chances to refresh themselves in a busy urban setting (McCormack et al., 2010). They also attract potential customers, and consequently help retailers to earn higher sales revenues (Jo, 2017). Some of such public amenities, however, upgrade environments nearby and adversely affect the existing retail communities through gentrification (Lees, 2003; Yoon & Currid-Halkett, 2015).
2
Retail gentrification, a kind of involuntary displacement of existing local stores and services due to raised rents or property values, has long been an issue that has drawn attentions from scholars and practitioners (Lees & Phillips, 2018; Byrne, 2003; LeVeen, 2004). Particularly Seoul, South Korea saw an increasing level of retail gentrification in recent years. Seoul has undergone a relatively more rapid urbanization driven by public authorities compared with cities in western countries, and has deployed government-led urban redevelopment projects to intentionally promote gentrification in declined areas (Kim & Heo, 2015; Shin & Kim, 2016).
Retail gentrification could be understood in various ways. On one hand, it is frequently observed in upward-moving commercial areas. Property values increase and the landlords of those could be benefitted by the increased rent, while the existing tenants cannot afford the excessive rent increment and are displaced (Kim, 2019 ; Bae, 2019 ; Lee, 2015 ; Heo, 2015 ; Jeong et al., 2018). Another perspective looks at retail gentrification as an inevitable process in the growth of a city. An increasing number of consumers revitalizes the retail areas, triggering new constructions and renovations of old buildings. Sometimes, diversification of land uses would positively change the nearby areas by inviting visitors in multiple purposes and improving pedestrian experiences (Kim, 2018 ; Lee, 2018 ; Seo, 2017).
The topic of gentrification has been studied mainly using qualitative methods (Collis et al., 2000 ; Link et al., 2005 ; Cameron & Coaffee, 2005 ; Kim, 2013 ; Kim & Heo, 2015 ; Jeong et al., 2015 ; Zukin et al., 2017). The most frequently used methods are questionnaire survey, observations and interviews (Collis et al., 2000 ; Link et al.,
3
2005), since the relevant data, such as retail rents and sales revenue, are difficulty to collect (Kim & Heo; 2015). Collis et al. (2000) conducted surveys for the local businesses in small towns of Atherstone, and revealed that lack of accessibility, poor image of the town because of empty shops, and deterioration of outdoor market were major contributory factors to the decline of the town centre. With the survey respondent, Cameron and Coaffee (2005) found that on the one hand, gentrification is evidence to drive successive waves of redevelopment, but on the other hand, it brings tensions between gentrifiers. Davidson (2008) examined levels of social mixing between gentrifying and communities in three neighborhoods undergoing new-build gentrification in London. By social surveys the study found that policy and planning frameworks which transform the neighborhoods in ways such as high-density, new-build developments, and self-contained create new-build gentrification. Zukin et al. (2017) examined 7064 reviews of restaurants in gentrifying neighborhoods in Brooklyn and emphasized that participation in social media has a material effect on capital investment in the urban environment. After looking at the causes and the process of gentrification, another research interviewed 68 merchants working in the gentrified area and found that the entry of new stores was influenced by the rent gap and future expectation (Heo et al., 2015). Zukin et al. (2009) looked at low-income neighborhoods which have become prime targets of both commercial and residential redevelopment. When interviewed, seven of the eight store owners who opened their business in the early years, also lived in Williamsburg. But as the local identity of new stores weakened, only two of seven recent new retail entrepreneurs lived there. This
4
change happened after the location has received higher visibility, and the rents increased consequently (Zukin et al., 2009).
The limitations of such studies come from the lack of systematic and comprehensive analyses of the phenomenon. Interview, observations and/or case studies of a small geographic area would not yield a general understanding on the process, spatial and temporal extent, as well as the contributing factors to gentrifications. Particularly, changes of retail district after a neighborhood improvement project, such as park constructions, has been indirectly explained by the changes in the population, sales revenues or residents’ preferences (Parker, 2018; Jim & Chen, 2010; Kho & Kim, 2016), only a few research investigated the opening and closure of individual stores (Yoon & Currid-Halkett, 2015).
In this study, we aim to assess the survivals of business establishments in a gentrifying area reportedly by a public amenity project, called Gyeongui Line Forest from 2009 to 2018. It is a park project in a declined neighborhood, in Seoul, South Korea. Through this study, we aim to answer the question on whether an introduction of a new park would be advantageous to nearby retailers in operating their business. We adopted survival analysis, using multi-year dataset. We compared the survival rate of the business establishments in the park vicinity before and after the park completion in 2015.
The text unfolds as follows. After describing the background of the study site, we present the analytical design, including data and the statistical method. After describing the analytical results, we then discuss the findings of our study with some policy implications.
5
Chapter 2. Background
Gyeongui Line Forest is a linear park on an abandoned railroad - Gyeongui railroad. Gyeongui railroad was built in 1906 during Japanese colonial period initially for Russo-Japanese War, and later became a part of the international railway connecting Seoul and Sinuiju, a city in the North Korea. The operation was ceased in 1945 with the division of the Korea into south and north (Jung et al., 2016), then after 55 years of abandonment, a part of the route was reconstructed between the Munsan Station in South Korea and Panmun Station in North Korea after the South and North Korea Summit in 2000 (Won, 2017). In 2011, to make transportation easier, a 6.3 km segment of Gyeongui railroad in Seoul, from Hyochang Station to Gajwa Station, was rebuilt on underground level, and on the emptied street level, Gyeongui Line Forest Park was constructed (Na, 2018). Reportedly, the creation of Gyeongui Line Forest improved the nearby neighborhoods and connected the formerly disconnected surrounding urban spaces (Jung et al., 2016; Jo et al., 2017 ; Kim et al., 2019).
Gyeongui Line Forest is a 6.3km or 28 block-long linear park, with its width varies from 10 to 60m, totaling 195,624
𝑚
2. After the announcement of the park conversion project in 2006, the condition of the surrounding areas has changed. The largest change is observed in the land use. Before the project, most of the buildings in the abandoned Gyeongui railroad were residential, while after the project, building containing retail industries, mostly food businesses, took 47.2% of the total building area situated around the park as of 2017 (Kim, 2018). Also, 22% of the first floor usage has changed,6
mostly from residential to retail (Lee, 2016). In addition, various types of retailers have moved to the area, such as guesthouses and craft workshops, revitalizing the local economy (Won, 2017).
After the opening of the entire section of Gyeongui Line Forest in July 2016, such change has accelerated by the increased visitors. First, Hongdae retail district (Hongdae), one of the top campus-oriented retail areas in the city, located south-east from the park, began interacting with the park. Various programs such as flea markets and artistic performances previously held in Hongdae area extended the stages to the Gyeongui Line Forest (Jeong, 2016). More diversified visitors and consumers have come to Hongdae, which used to mostly attract students or young professionals in their 20s and 30s (Kho & Kim, 2016). The number of guesthouse businesses and restaurants increased drastically, making the Hongdae the fifth most popular tourist sites in Korea (Ministry of Culture, Sports and Tourism, 2018 ; digitaltimes, 2017).
Second, Yeonnam-dong retail area (Yeonnam), located south-north from Hongae district and encompassing the Gyeongui Line Forest Yeonnam section, also has experienced similar changes. The announcement of the park plan attracted retail industries to the vicinity such as restaurants, cafes, pubs, workshops, hotels and guesthouses and the customers. The unique park-retail spatial relationship earned the nickname to the park; ‘Yeontral Park’ or ‘Central Park in Yeonnam’ (Kim, 2015; Sung, 2013). It is now one of the top 50% most popular retail districts in the city as of 2014. Considering its past life as a residential area, the current status of Yeonnam means a drastic change (Kim, 2018).
7
Anecdotal evidences suggest that Hongdae and Yeonnam are one of the most representative cases under a threat of retail gentrification (Kim et al., 2019). The price of real estate increased significantly after the construction of the park and the opening of a new subway station (Digital Times, 2017). The unit price of commercially used buildings, has been raised up to 45% after the construction, while a similar pattern was observed for retail rents; 1.5 to 2 times of increment after the construction (Hankookilbo, 2015; Jo, 2017). Being unable to afford the spaces, small enterprisers began to leave the area, seeking for a cheaper rent (Lee, 2018).
8
2.1 Relationship between urban parks and retail district
The relationship between urban parks and retail district has been viewed from multiple angles. Some of such examples include the assessment of the park impacts on the retail revenue (Chu, 2018; McInroy, 2000; Won, 2017), the change in the number of visitors (Kim, 2018; Loughran, 2014), the retail rent (Chandralal, 2010 ; Sutton, 2010), the residential development (Jo, 2017; Russell, 2011), and retail survival (Yoon & Currid-Halkett, 2015).
First, the opening of a park has been known to lead an increase in retail revenues. The High Line, an urban park built on an old railroad track in New York City in U.S., is referred frequently in this context. Song (2013) analyzed that the most affected industry sectors are retail trade, food services, and accommodations. Nearly 148 million dollars were increased through the industry sectors most affected from multiplier effect such as retail trade, food services and drinking places, accommodation, transportation, and recreation, in 2011 which have continuously increased since the opening in 2009. For the case of Gyeongui Line Forest, Park and Kim (2019) compared the total sales of the surrounding retail area, before and after the formation. After the completion in 2016, the gross sale increased by 10-12%. Second, the creation of parks increases the number of visitors to the surrounding area. The High Line, when it was merely an abandoned rail track, has not attracted visitors. After the park conversion, it has become one of the landmarks of the city, and attracted over 7.6 million visitors in 2015, which was more than other landmarks in New York city, such as the Metropolitan Museum of Art with 6.3 million visitors and the Empire State Building with 4.2 million
9
visitors annually (Ganser, 2017). Kim (2018) revealed that the formation of a park – Seoullo 7017, situated in Seoul, South Korea - also changes the visitors’ usage pattern. In addition to walking activities, relaxation and leisure activities were observed, and picnickers gathered day and night (Oh & Lee, 2018).
Third, buildings near a well-designed and maintained parks earns higher rents (Park & Kim, 2019). A study suggests that office rents near Bryant Park, New York City has been raised after the park renovation. The park has transformed from a crime-ridden place to a safe and active place where office workers have lunch and citizens gather for activities. (Ernst & Young, 2003). A study on Yeonnam-dong in Seoul, concluded that the retail rent rose up to two times more than that of before the creation of the park (Jo, 2017).
The creation of an urban park might increase the value of existing residential units and/or stimulate new developments. Jung et al. (2016) did a multilevel analysis and found that apartments 100m closer to Gyeongui Line Park was 15% higher in market value compared to those located further away. The residential properties located 100 feet closer to the High Line, situated in West Chelsea, New York, has 0.25% lower market transaction value (Yoon, 2013).Brambilla and Ronchi (2016), in a case study of Lombardy Region, northern Italy, found that the availability of open space was an advantage that helps increasing value of nearby properties by 9%.
Lastly, studies have looked at the relationship between urban parks and retail survival. A research on the High Line suggested that after the neighborhood had undergone a series of urban planning interventions and new addition of the public amenity, businesses established earlier than those changes, particularly art studio and
10
gallery businesses, have been displaced (Yoon & Currid-Halkett, 2015). Choi et al. (2015) explored the characteristics of different parks located in central business district of Daegu, South Korea, and suggest improvements and complements. In this study, apparent difference in the surrounding commercial area may be due not only to the spatial characteristics but also because of park differences, such as the use hierarchy, facilities, or the internal environment.
11
Chapter 3. Analytical Design
In this research, we aim to reveal how the creation of urban parks – Gyeongui Line Forest Yeonnam section – affects the business operations of retail establishments in the vicinity, with a case of Hongdae and Yeonnam retail district in Seoul, South Korea from 2009 to 2018. The business operations are measured with the duration and risk of closure of the businesses, hence the survival analysis is employed.
The analysis is two-fold. By using Kernel density estimation, we first depicted the geographic pattern of new opening and closing of retail establishments around the park, and then we analyzed whether the proximity to the park was advantageous in business survival, using Kaplan-Meier method and Cox’s proportional hazards regression. We conducted the analysis twice for the samples opened before and after 2015, to compare their vulnerability depending on the timing of the opening. We assumed that the businesses established earlier would be more susceptible to gentrification (Yoon & Currid-Halkett, 2015).
12
3.1 Study site, period and data
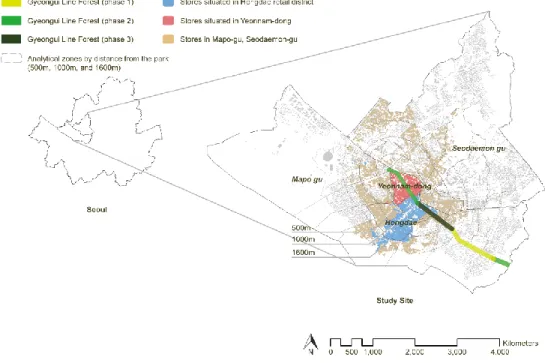
Figure 1. The boundary of study site and the location of stores in the sample with reference to the Gyeongui Line Forest
Figure 2. Gyeongui Line Forest in study period from establishment plan to completion
13
Our study site is the two retail districts – Yeonnam and Hongdae – around the Gyeongui Line Forest Phase 2, so called Yeonnam section in Seoul, South Korea.
The study period is from 2009 to 2018. In 2009, the plan of the park creation has been initiated, and 2018 is the current point. In detail, from 2009 to 2011, the basic plan and design of the park was completed, and in 2012, 2015 and 2016, the three sections have been constructed respectively (Fig 2) (Seoul Metropolitan Government, 2014).
The Yeonnam section is 1.31km long and 28,500
𝑚
2 wide, with an average width of about 25m (Friends of Gyeongui line forest, 2018). We limited our study site up to 1600m from the park considering the general extent of the park influences to the vicinity (Wolch, 2005 ; Moore et al., 2008).The primary dataset is the business licensing data of retail establishments, provided by the Korea Local Information Research & Development Institute (KLID). This contains information on the name, business address, geo-code, phone numbers, industrial classification (Korean standard industrial classification (KSIC)), and opening and closing date of business establishments, collected and updated every month. Following the KSIC, we categorized the retail businesses into 6: manufacturing, whole sale, retail, service, restaurant, and publication (Yoon & Kang, 2018). To consider the location and characteristics of each store, building registrations, digital topographic map, and landmark map were used additionally. Also, to address the macroeconomic factors, we used the GDP (Gross Domestic Product) growth rate, annual average KOSPI (Korea Stock
14
Exchange Price Index), and price index of the national indicator system.
The final sample includes 22,582 stores situated in Hongdae and Yeonnam.
15
3.2 Methods and variables
3.2.1 Measure
The dependent variable for the subsequent survival analysis is the probability of business closures(closure) of individual stores situated in the study site. The question variable is a dummy variable indicating whether the store is located within 500m from the Gyeongui Line Forest (within_500m). 500m or approximately five minutes walking distance is a hypothetical distance within which parks have their immediate influence in general, adopted in many studies (Nicholls, 2001; Wolch, 2005; New York City 2007). The coefficient of this variable represents how much impact the proximity to the park has on the survival of those business establishments.
The explanatory variables consist of locational, store-specific characteristics, and macroeconomic factors, according to previous studies (Hong, 2014; Jung, 2017; Lo, 2010; Oh, 2018). First, locational characteristics can be divided into the two categories. The first is the accessibility to transportation facilities. We assumed that the closer the distance to the main transportation facilities such as the subway stations (sub_dist) and the arterial roads (dr_dist), the higher the number of visitors to nearby stores. The second is the land use characteristics. If a store is located within residential use, it takes value one in the dummy variable (resi_use). Locational characteristics are also explained with Urban Network Analysis. Urban Network Analysis (UNA) can provide meaningful explanations of the store accessibility, reflecting the transportation network as well as other physical factor of the building such as the building
16
volume, location, and population (Sevtsuk & Mekonnen, 2012; Park & Lee, 2015). We specified the convenience to reach multiple destinations (reach), which is calculated as the number of accessible buildings from the subject building. The relationship with adjacent buildings (betweenness), is calculated as the median of buildings from the subjective building within the study area. We also specified the straightness (straightness) as the shortest network distances between a subject building to other buildings, closeness (closeness) as the shortest distance to another building from the subject building, and the accessibility to reach a store (gravity) as the spatial impedance required to reach each buildings to the subject building.
Store characteristics are divided into two categories. First is the building characteristics; store area (store_area), total area of the building of the subject store (bld_area), the land area of the building
(land_area), the building coverage rate (bcrat), whether the store is
located in the first floor (first_flr). The second is the 6 industrial type: restaurant (class_restr), publication (class_public), manufacturing
(class_manuf), wholesale (class_whs), retail trade (class_retail), and
service (class_serv). Wholesale trade includes large markets which sales goods in large quantities from manufacturers, clothing, and import sales. Retail trade here specifically includes speciality stores such as clothing and accessories, handicraft workshop, and department stores. Service industry includes medical services, beauty and hairdressing services, leisure services, and lodging services. To see the differing effect of the park proximity by industrial type, we included the interaction term as the multiplication of those two sets of variables (class_restr_500m, class_serv_500m,
17
class_public_500m, class_manuf_500m, class_whs_500m,
class_retail_500m).
We considered 4 types of macroeconomic factors. First, we used Gross Domestic Product (gdp) along with consumer sales (cpi) to track the inflows and outflows of consumer wealth and estimate the economic situation for the year (Breeden & Thomas, 2008; Jung & Yoon, 2017). We also considered Korea Composite Stock Price Index
(kospi), because stock prices are related to real consumption of the
retail market (Li & Wang, 2010; Nam, 2006). Also, if the economy gets better, the demand will rise (Leoker & Eeckhout, 2017) Therefore, we added Producer Price Index (ppi), assuming if the annual average CPI and PPI are high, the risk of closure is lowered.
18
3.2.2 Kernel density analysis
Kernel density estimation is a way to assess the probability density of a point data distribution using kernel function (Botev et al. 2010). The probability density differs according to the size of the smoothing parameter called the bandwidth (Sheather & Jones, 1991). In this study, we used the bandwidth (h) as the GIS default value (Silverman, 1986; Jung & Yoon, 2017).
h = 0.9 ∗ min (𝑆𝐷, √ 1
ln(2)∗ 𝐷𝑚) ∗ 𝑛 −0.2
𝑆𝐷 : standard distance 𝐷𝑚 : median distance
𝑛 : number of points if no population field is used (Function 1).
Kernel function is expressed as f(x, y) =1 𝑛∑ 𝐾ℎ(𝑥 − 𝑥𝑖) = 𝑛 𝑖=1 1 𝑛ℎ𝑑∑ 𝐾( 𝑥−𝑥𝑖 ℎ 𝑛 𝑖=1 )
f(x, y) : Ker ≠ l function of estimates 𝑛 : number of points
h : bandwidth d : data dimension k(x) : kernel function x : unknown point x𝑖 : ith base point (Function 2).
19
3.2.3 Survival analysis
We employed a survival analysis to infer whether the creation of Gyeongui Line affect the survival of the surrounding retail districts. Survival analysis is a statistical method for assessing the occurrence and timing of an event (Allison, 2010), and has been widely applied to various fields of study including public health (Coleman, 2011), business marketing (Solomon, 2013), gentrification (Yoon & Currid-Halkett, 2015) and urban planning (Chen, 2016).
Kaplan-Meier estimator
Through Kaplan-Meier estimator, the average survival probability of retail establishments can be derived for each time unit (Goel et al. 2010). We defined the survival period as the business duration between the opening to the closing, and the event as the business closure. The survival function by the Kaplan-Meier estimator is described as below Function 3.
S(𝑡𝑖) = ∏𝑡𝑠=1(1 −ℎ𝑠𝑖)
(Function 3).
It is the probability that the store i continue to operate from the start of the analysis until the time 𝑡𝑖. ℎ𝑠𝑖 is the hazard rate i.e. the
ratio of the stores experiencing the business closing over the total number of the stores in the risk set at time 𝑡.
20 Cox proportional hazard model
We used Cox proportional hazard model, because it is a multivariate approach and we can deduct the effects of both time-variant and time-intime-variant variables (Song et al., 1996).The hazard function h(𝑡𝑖) is the risk of closing business for store i at time t
(Function 4).
h(t|𝑋𝑖) =ℎ0(𝑡)exp (𝛽𝑋𝑖+ 𝛽𝑋𝑖𝑡)
𝛽𝑋𝑖 : location and store characteristics
𝛽𝑋𝑖𝑡 : time-dependent macroeconomic indicator (Function 4).
𝛽𝑋𝑖 is a vector of locational and store characteristics which does
not change by time, and 𝛽𝑋𝑖𝑡 is a vector of the time-dependent
macroeconomic indicators such as GDP growth rate, annual average KOSPI, and annual average producer and consumer price index.
21
Chapter 4. Results
4.1 Estimation of retail district area
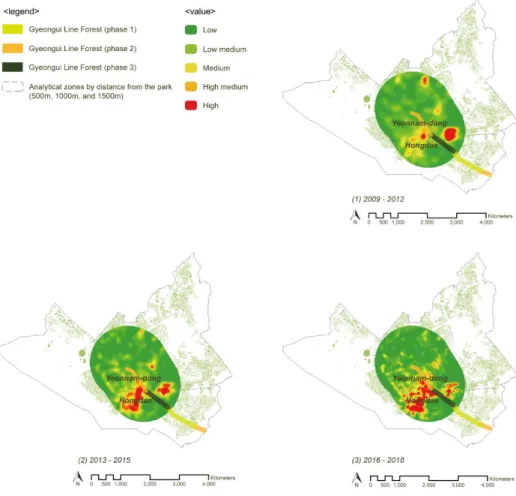
Figure 3. Kernel density of the distribution of stores in the study site from 2009 to 2018
By kernel density analysis, we can see the geographic distribution of the opening of retail establishments in the site. Fig.3.(1) illustrates the distribution of the new openings between 2009 and 2012. Along
22
with the design and construction phase of the park, the number of new stores in Yeonnam and Hongdae increased rapidly. The retail, restaurant, café in this area expanded to reach the Gyeongui Line Forest. On the other hand, new openings around the south-east side of the park, Fig.3.(3), gradually declined during this process.
Through this analysis, it can be observed that the creation of Gyeongui Line Forest is coincided with a general growth or decline of the nearby retail areas. While retail industries in Yeonnam and Hongdae increased alongside the park, stores with similar characteristics declined in other retail district far from the park.
23
4.2 Survival of stores by characteristics
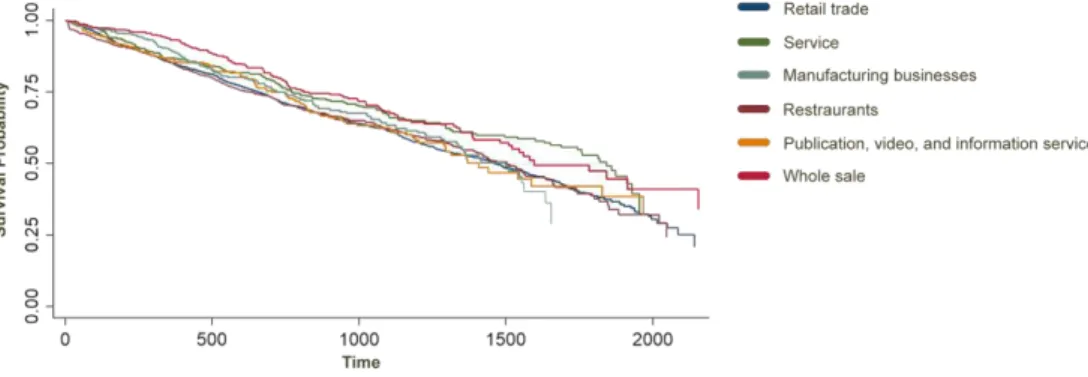
Figure 4. Kaplan-Meier estimation of industries before the creation of Gyeongui Line Forest in 2015
Figure 5. Kaplan-Meier estimation of industries after the creation of Gyeongui Line Forest in 2015
We present the Kaplan-Meier estimation of industries before and after the creation of Gyeongui Line Forest in Figure 4 and 5. The total 22,582 stores covered in the study, 9,674 stores or 42.84% have closed during the study period from 2008 to 2019. When looking at industries before the creation of Gyeongui Line Forest in 2015 (Figure 4), we can see that all 6 industries’ survival probability goes
24
down constantly. The initial survival rates of stores located within the study site decreased relatively similarly at first, but the gap began to arise between industries from about 700 days (about 1.9 years) before the park was completed. This can be understood as the construction of Gyeongui Line Forest, Yeonnam-dong section began on March, 2014, existing stores were more likely to have become hard to survive than new stores flowing in. Figure 5 shows the survival probability of industries after the creation of Gyeongui Line Forest in 2015. From this, we can see the decrease of survival rate, but at the same time, we can also that the probability rate itself is much higher compared to the probability of industries before the creation of the park. The results suggest that, as discussed in previous studies, the park affects the usage behavior of commercial users (Ganser, 2017 ; Kim, 2018), and the survival of stores made after the creation of the park is better than that of existing stores due to more stores tailored to the users usage behavior (Ernst & Young, 2003 ; Jo, 2017).
In the Table 2, we present the result of the survival analysis for the business establishment opened before the park completion in 2015. Restaurants, service, and publication had a higher probability of survival compared to retail each by restaurants 0.83 times, service 0.7 times, and publication 0.27 times the fitted odds. 1.40 times the fitted odds. On the contrary, manufacturing businesses had a lower probability of survival than the retail trade by 1.40 times the fitted odds. This pattern changes after the creation of Gyeongui Line Forest in 2015 (Table 3). Restaurants had a higher rate of closure, respectively, compared with the retail industry (1.36 times). It could be assumed that the introduction of the parks was disadvantageous
25
to restaurant businesses, as many new restaurants have been created nearby Gyeongui Line Forest due to the behaviors of users such as freely moving in and out of the park to take out food and eat on benches or sit inside stores which can overlook the view. However, at the same time, many restaurant businesses which could not afford the sharply rising rents closed down thereby increasing the closure rate. (Jo, 2017; Lee, 2018).
Unlike the before condition, wholesales, on the other hand, had a higher probability of survival than retail trade by 51.3%. It could be assumed that because the introduction of the park attract individual consumers, it was disadvantageous to wholesale businesses which trade sale goods in large quantities.
Service and publication industries also had a lower rate of closure, by 19.7% and 73.9%, respectively, compared with the retail industry.
26 Table 1. Industrial type categories
Category Sub-category Numbers Number of closure Percent
manufacturing 747 399 53.41
retail 7,890 3,721 47.16
restaurant 7,177 3,326 46.73
service
medical
beauty and hairdressing leisure
lodging
2,507 967 38.73
wholesale 2,279 750 32.9
publication, video and information 1,982 511 25.78
27
Table 2. Odds Ratio results of industries before the creation of Gyeongui Line Forest in 2015
Variables Description Odds Ratio Std. Err. z P>|z| [95% Conf Interval]
Question variable
within_500m Distance to Gyeongui Line Park
(in 500m dummy 1, 0)
0.910* 0.464 -1.85 0.064 0.824 1.006
Location characteristics
dr_dist Distance to road (m) 0.999 0.002 -0.38 0.706 0.994 1.004
resi_use Residential area district (1, 0) 0.815*** 0.044 -3.81 0.000 0.733 0.905
reach number of accessible buildings 0.999 0.001 -1.35 0.177 0.998 1.000
betweenness median value of the building 1.000* 0.000 -1.86 0.063 1.000 1.000
straightness linear distance 1.000 0.000 0.38 0.703 0.999 1.001
closeness shortest distance to another building 1.255 0.580 0.49 0.622 0.508 3.103
gravity spatial resistance to arrive at store 0.997 0.019 -0.18 0.857 0.960 1.034
Store characteristics
store_area Store area (
𝑚
2)
1.000*** 0.000 -4.33 0.000 1.000 0.905bld_area Area of building which the store is located (
𝑚
2)
1.000 0.000 -0.78 0.438 1.000 1.000land_area Land area (
𝑚
2)
1.000*** 0.000 5.08 0.000 1.000 1.000bcrat Coverage ratio 1.001 0.002 0.63 0.528 0.997 1.005
first_flr Whether the store is located in the first floor (1,0) 0.970 0.034 -0.88 0.380 0.906 1.038
Industrial type of stores
class_restr Industrial type ‘Restaurant’ 0.833*** 0.030 -5.08 0.000 0.776 0.894
class_serv Industrial type ‘Services’ 0.705*** 0.041 -6.00 0.000 0.628 0.790
class_public Industrial type ‘Publication, Video and
Information service industry’
0.273*** 0.021 -17.11 0.000 0.235 0.316
class_manuf Industrial type ‘Manufacturing business’ 1.401*** 0.103 4.60 0.000 1.213 1.617
28 Interaction between industrial type and distance
class_restr_500m Interaction of industrial type ‘Restaurant’ and Gyeongui Line Park (in 500m dummy)
1.087 0.094 0.97 0.332 0.918 1.287
class_serv_500m Interaction of industrial type ‘Services’ and Gyeongui Line Park (in 500m dummy)
0.833 0.118 -1.29 0.196 0.630 1.099
class_public_500m Interaction of industrial type ‘Publication, Video and Information service industry’
and Gyeongui Line Park (in 500m dummy)
1.434** 0.237 2.18 0.029 1.037 1.983
class_manuf_500m Interaction of industrial type ‘Manufacturing business’
and Gyeongui Line Park (in 500m dummy)
1.106 0.193 0.58 0.562 0.786 1.556
class_whs_500m Interaction of industrial type ‘Wholesale’
and Gyeongui Line Park (in 500m dummy)
0.885 0.168 -0.64 0.521 0.610 1.284
Total Variable Cost
sub_dist Distance to subway (m) 1.000*** 0.000 6.21 0.000 1.000 1.000
gdp Growth Domestic Product growth rate 1.000*** 0.000 5.02 0.000 1.000 1.000
kospi Annual average Korea Composite Stock Price
Index
0.999*** 0.000 -3.34 0.001 0.999 1.000
ppi Annual average Producer Price Index 0.894*** 0.021 -4.68 0.000 0.999 1.000
cpi Annual average Consumer Price Index 1.407*** 0.130 3.69 0.000 1.174 1.686
_cons 0.006*** 0.004 -7.12 0.000 0.001 0.024
29
Table 3. Odds Ratio results of industries after the creation of Gyeongui Line Forest in 2015
Variables Description Odds Ratio Std. Err. z P>|z| [95% Conf Interval]
Question variable
within_500m Distance to Gyeongui Line Park
(in 500m dummy 1, 0)
0.771*** 0.727 -2.76 0.006 0.641 0.927
Location characteristics
dr_dist Distance to road (m) 0.998 0.005 -0.47 0.642 0.989 1.007
resi_use Residential area district (1, 0) 0.580*** 0.045 -7.03 0.000 0.499 0.675
reach number of accessible buildings 0.998** 0.001 -2.43 0.015 0.996 1.000
betweenness median value of the building 1.000 0.000 -0.20 0.841 1.000 1.000
straightness linear distance 1.000 0.001 -0.54 0.591 0.998 1.001
closeness shortest distance to another building 1.118 0.569 0.22 0.827 0.412 3.032
gravity spatial resistance to arrive at store 1.000 0.032 -0.01 0.992 0.939 1.064
Store characteristics
store_area Store area (
𝑚
2)
0.999*** 0.000 -6.18 0.000 0.999 1.000bld_area Area of building which the store is located (
𝑚
2)
1.000*** 0.000 -3.15 0.002 1.000 1.000land_area Land area (
𝑚
2)
1.001*** 0.000 6.80 0.000 1.001 1.001bcrat Coverage ratio 1.004 0.004 0.99 0.320 0.996 1.012
first_flr Whether the store is located in the first floor (1,0) 0.878** 0.526 -2.16 0.030 0.781 0.988
Industrial type of stores
class_restr Industrial type ‘Restaurant’ 1.361*** 0.080 5.29 0.000 1.214 1.526
class_serv Industrial type ‘Services’ 0.803** 0.070 -2.53 0.011 0.677 0.952
class_public Industrial type ‘Publication, Video and
Information service industry’
0.261*** 0.046 -7.63 0.000 0.185 0.369
30
class_whs Industrial type ‘Wholesale’ 0.487*** 0.117 -3.00 0.003 0.304 0.780
Interaction between industrial type and distance
class_restr_500m Interaction of industrial type ‘Restaurant’ and Gyeongui Line Park (in 500m dummy)
0.939 0.128 -0.46 0.646 0.720 1.227
class_serv_500m Interaction of industrial type ‘Services’ and Gyeongui Line Park (in 500m dummy)
1.459** 0.269 2.05 0.041 1.016 2.094
class_public_500m Interaction of industrial type ‘Publication, Video and Information service industry’
and Gyeongui Line Park (in 500m dummy)
0.973 0.407 -0.07 0.948 0.429 2.208
class_manuf_500m Interaction of industrial type ‘Manufacturing business’
and Gyeongui Line Park (in 500m dummy)
0.988 0.352 -0.03 0.974 0.492 1.897
class_whs_500m Interaction of industrial type ‘Wholesale’
and Gyeongui Line Park (in 500m dummy)
0.884 0.513 -0.21 0.832 0.283 2.759
Total Variable Cost
sub_dist Distance to subway (m) 1.000 0.000 1.05 0.292 1.000 1.000
gdp Growth Domestic Product growth rate 1.000 0.000 1.60 0.109 1.000 1.000
kospi Annual average Korea Composite Stock Price
Index
0.996*** 0.000 -8.63 0.000 0.995 0.997
ppi Annual average Producer Price Index 1.258*** 0.214 13.53 0.000 1.217 0.301
cpi Annual average Consumer Price Index 1.274 3.431 0.09 0.928 0.007 249.6
_cons 0.771*** 0.727 -2.76 0.006 0.641 0.927
31
4.3 Survival rate by distance to the park
As shown in Table 2, before the creation of Gyeongui Line Park, stores in all industries within 500 m from the park has a lower probability of closing businesses compared with the rest of the industries beyond the distance. The fitted odds that a prototypical store within 500 m from the park experience a business failure is 0.91 times of the fitted odds for a store beyond 500 m range. After the creation (Table 3), a similar difference is observed with smaller magnitude. It shows stores in all industries after the creation of Gyeongui Line Park, and we can see that industries within 500 m from the park experience business failure 0.77 times of the fitted odds compared to stores beyond 500 m range. This means that the proximity to park benefits the nearby businesses more than the proximity to an abandoned railroad.
The distance variable alone describes that stores which is located beyond 500 m from the park has lower probability of survival. When the distance from the park is interacted with the industrial classification as shown in Table 2, we can see that before the creation of the park, industries related to publication experience business failure 1.434 times of the fitted odds compared to retail industries for a store within 500 m range. Looking at Table 3, service stores including medical, lodging, laundry, and beauty, also showed 1.459 times business failure compared to retail industries within 500 m range of Gyeongui Line Forest.
32
4.4 Factors affecting the survival of stores
Among the location characteristics, distance from Gyeongui Line Forest, location in a residential use showed statistical significance.
From Table 2, the result shows that probability of failure of stores before the creation of Gyeongui Line Forest, decreases when the stores are located in a residential area rather than commercial area by 18.5%. The probability failure of the residential area decreased to 42% after the creation of the park as shown in Table 3.
Also, Table 3 shows us that store size, building area of the store, and whether the store is located in the first floor were significant. If the store is situated on the first floor, the probability of failure decreases by 12.2%.
33
Chapter 5. Conclusion and discussion
Through this research, we revealed how the creation of urban parks affects the business operations of the nearby retail establishments, in terms of their survivals. To do this we first depicted the geographic pattern of new opening and closing of retail establishments around the park, then we analyzed whether the distance to the park explained would help retailers in their surviving in the market, using Kaplan-Meier method and Cox’s proportional hazard regression.
The analytical results suggested that during the creation of Gyeongui Line Forest, retail establishments located within a close range from the park experienced lower rate of closure than the ones far from the park, supporting the common belief that parks contribute to enhancing visibility as well as to increasing pedestrian volumes of the vicinity area, hence benefitting the retailers (Friedland & Palmer, 1984; Won, 2017). This finding applies when comparing industries before the park completion and after the creation, while the park benefits the nearby industries more than an abandoned railroad and decreases the probability of failure of industries. A research which aimed to look at the economic effect of pedestrianization because increasing rental values in pedestrianized areas are highly related with displacement of small shops, found that there was a positive effect between the increase of pedestrians and the increase of sales which also corresponds with our findings (Ozdemir & Selcuk,2017).
Second, we also observed some other characteristics of retail establishments that had significant influences to the survival time of
34
individual shops. Some researchers consider the rapid neighborhood change as gentrification. Ocejo (2011) defined commercial gentrification as an introduction of new business establishments that satisfied the needs of middle-class gentrifiers. Zukin and Kosta (2004) emphasized the importance of commercial districts when understanding the neighborhoods undergoing gentrification. The study suggested that a neighborhood should have retails that cater to both existing and new comers, who are linked in a beneficial relation which can lead to marketable and sociable neighborhood innovation (Zukin & Kosta, 2004). Deener (2007) argued that because commercial streets have a symbolic value in building the local neighborhood identity, studying its role might be the key to solving a gentrification problem. Those with positive effects on retail establishments are stores situated in residential area, with smaller store and building size, and also situated on the first floor. This finding corresponds to the formation of a park changing the nearby industries as to visitors' usage pattern such as enjoying take-out food stores or preferring to eat on sits where they can view the park (Kim, 2018 ; Jo, 2017).
Lastly, when comparing the pattern of before and after the construction, we can see that restaurants experience a more frequent closer after the creation of Gyeongui Line Forest. Since the establishment of a park consider the park users, it can be seen that the growth rate of stores is higher in the food and retail businesses compared to similar commercial areas (Won, 2017). As the number of stores related to food industry increase due to the urban park, at the same time, more closure occurs because of problems such as high retail rents and users' taste (Park & Kim, 2019 ; Sutton, 2010).
35
However, in the research done by Yoon and Park (2018) which focused on the decrease in diversity of business types due to gentrification, the result showed a slight difference with our findings. They selected 16 neighborhoods from Seoul and analyzed the changes in physical environment over time. The results showed that as time goes, residence and neighborhood commerce changed into fashion or cosmetic related stores and western style restaurants. When looking at the open number of shops, restaurants were the highest but also many closed down with a percentage higher than neighborhood commerce industries such as medical services and laundry industries.
Additionally, with detailed data on retail establishments, more analysis could be possible to examine the interrelationship between business survival and urban parks. First, a variety of industry type of stores in retail districts could be analyzed. The amount of the effect park has on individual stores were different both by their characteristics and distance. In this study, we found factors affecting the survival of business retails by location, store characteristics, and macroeconomics characteristics. If there were detailed data on individual stores, such as the opening hour, and the number of customer and workers, the factors related would be more accurate. Also, data on financial statements and card use would be an indicator to economic relationship (Won, 2017; Herman, 2007).
By examining how urban parks affect retail industries, this paper offers implications for revitalizations of retail districts through environmental improvement, suggesting favorable green amenity characteristics for pedestrians and the surrounding commercial area (Peters & Elands, 2010). By providing an urban park for pedestrians,
36
more pedestrians will be attracted to the open space, shops will be created nearby for use, and consequently the surrounding neighborhood will be activated (Inroy, 2000).
Our research also contains expectation to provide diverse research and policy implications for urban revitalization. The long-time revitalization of cities is done by a variety of large and small projects, some in process and some already completed (Lee, 2016; Seo, 2017). From a long-term point of view, the government should implement appropriate projects interacting with green amenities which contribute to the revitalization of the city and economic aspect of commercial areas, connecting the uneven urban neighborhoods on a large scale. It would be also a helpful reference for retailers considering what kind of industry type or location to choose when wanting to be in business for a long time.
37
Reference
Allison, P. D. (2010). Survival Analysis Using SAS: A Practical Guide, Second Edition.
Ashworth, C. (2011). Marketing and organizational development in e-SMEs: understanding survival and sustainability in growth-oriented and comfort-zone pure-play enterprises in the fashion retail industry. International Entrepreneurship and Management Journal, 8(2), 165-201.
Ayres, J., Leistritz, L., & Stone, K. (1992). Rural Retail Business Survival: Implication for Community Developers. Community Development, 23(2), 11-21.
Bekele, E., & Worku, Z. (2008). Factors that Affect the Long-term Survival of Micro, Small and Medium Enterprises in Ethiopia. South African Journal of Economics, 76(3), 548-568.
Bellotti, T., & Crook, J. (2017). Retail credit stress testing using a discrete hazard model with macroeconomic factors. Journal of the Operational Research Society, 65(3), 340-350.
Botev, Z. I., Grotowski, J. F., & Kroese, D. P. (2010). Kernel Density Estimation via Diffusion. The Annuals of Statistics, 38(5), 2916-2957.
Brambilla, M., & Ronchi, S. (2016). The park-view effect: Residential development is higher at the boundaries of protected areas. Science of The Total Environment, 569-570(1), 1402-1407. Breeden, J. L., & Thomas, L. (2008). The relationship between default and economic cycles for retail portfolios across countries. Journal of Risk Model Validation, 2(3), 11-47.
Cameron, S., & Coaffee, J. (2006). Art, Gentrification and Regeneration – From Artist as Pioneer to Public Arts. European Journal of Housing Policy, 5(1), 39-58.
Chang, C., & Li, M. (2014). Effects of urban parks on the local urban thermal environment. Urban Forestry & Urban Greening, 13,
672-38 681.
Chang, H., & Lian, C. (2011). Exploring an integrated method for measuring the relative spatial equity in public facilities in the context of urban parks. Cities, 28, 361-371.
Chiusura, A. (2004). The role of urban parks for the sustainable city. Landscape and Urban Planning, 68, 129-138.
Cho, S., Bowker, J. M., & Park, W. M. (2006). Measuring the Contribution of Water and Green Space Amenities to Housing Values: An Application and Comparison of Spatially Weighted Hedonic Models. Journal of Agricultural and Resource Economics, 31(3), 485-507. Cho, Y. & Zo, H. (2017). A Study on the Meaning of Physical Composition of Linear Park as Urban Greenway. Journal of Architectural Institute of Korea, 37(1), 373-376.
Choi, C., Woo, Y., & Jung, S. (2015). An Analysis of Locational Characteristics and Use Behavior of Neighborhood Parks in Central Business District. Journal of the Korean Association of Geographic Information Studies, 18(1), 25-47.
Collis, C., Berkeley, N., & Fletcher, (2000) Retail Decline and Policy Responses in District Shopping Centers. The Town Planning Review. 71(2), 149-168.
Cybriwsky, R. (1999). Changing patterns of urban public space: Observations and assessments from the Tokyo and New York metropolitan areas. Cities, 16(4), 223-231.
Dileep Kumar, M., & Jain, V. (2010). Survival Skills of Business Management Graduates: A study with Reference to Retail and Banking. Far East Journal of Psychology and Business, 1(1), 49-77. Friedland, R., & Palmer, D. (1984). Park Place and Main Street: Business and the Urban Power Structure. Annual Review, 10, 393-416.
Golicnik, B., & Tompson, C. W. (2010). Emerging relationships between design and use of urban park spaces. Landscape and Urban Planning, 94, 38-53.
39
Heo, J., Jeong, Y., & Jung, C. (2015). Gentrification Process and Changing Shop Owners in Commercial Area on Gyeongridan Street. Seoul Studies, 16(2), 19-33.
Hahm, Y., Yoon, H., Jung, D., & Kwon, H. (2017). Do built environments affect pedestrians’ choices of walking routes in retail districts? A study with GPS experiments in Hongdae retail district in Seoul, South Korea. Habitat International, 70, 50-60.
Hoshino, T., & Kuriyama, K. (2009). Measuring the Benefits of Neighbourhood Park Amenities: Application and Comparison of Spatial Hedonic Approaches. Environmental and Resource Economics, 45(3), 429-444.
Inroy, N. M. (2000). Urban Regeneration and Public Space; The Story of an Urban Park. Space and Polity, 4(1), 23-40.
Jim, C., & Chen, W. (2010). External effects of neighborhood parks and landscape elements on high-rise residential value. Land Use Policy, 27, 662-670.
Jung, D., & Yoon, H. (2017). Survival Analysis of Good Business Establishments in Major Retail District and Its Extended Area: A case study on Itaewon, Seoul, Korea. Journal of Architectural Institute of Korea, 3, 57-68.
Jung, E., Choi, Y., & Yoon, H. (2016). The impact of the Gyeongui Line Park project on residential property values in Seoul, Korea. Habitat International, 58, 108-117.
Jung, S. (2016). Gyeongui Line Forest Park Landscape Design. Graduate School of Architecture & Urban Design. Hongik University. Kim, J. (2015). Planning for Seoul Station Elevated Promenade Park. Master thesis. Graduate School of Environmental Studies. Seoul National University.
Kim, L. (2004). Time-Varying Macroeconomic Risk and Commercial Real Estate: An Asset Pricing Perspective. Journal of Real Estate Portfolio Management, 10(1), 47-57.
40
Kreja, K. (2006). 13 Spatial imprints of urban consumption: large-scale retail development in Warsaw. The urban mosaic of post-socialist europe, 253-272.
Lee, H. (2016). A Study on Revitalization Plan of Idle Space from the viewpoint of Place Marketing: through the Analysis of Domestic and Foreign Cases. Graduate School of Construction Engineering. Chung-And University.
Lo, A., & Jim, C. (2010). Willingness of residents to pay and motives for conservation of urban green space in the compact city of Hong Kong. Urban Forestry & Urban Greening, 9, 113-120.
Loughran, K. (2014). Parks for Profit: The High Line, Growth Machines, and the Uneven Development of Urban Public Spaces. City & Community, 13(1), 49-68.
Lutzenhiser, M., & Netusil, N. R. (2008). The Effect of Open Space on a Home’s Sale Price. Contemporary Economic Policy, 19(3), 291-298.
Madden, D. J. (2010). Revisiting the End of Public Space: Assembling the Public in an Urban Park. City & Community, 9(2), 187-207. Morancho, A. B. (2003). A hedonic valuation of urban green areas. Landscape and Urban Planning, 66(1), 35-41.
More, T. A., Stevens, T., & Allen, P. G. (1988). Valuation of Urban Parks. Landscape and Urban Planning, 15, 139-152.
Oh, H., & Lee, M. (2018). The difference between residents and visitors on the influencing factors of satisfaction in urban linear park: A case study of Gyeongui-line forest park ’ s Yeonnam-dong section. Journal of Korea Planning Association, 53(5), 207-224. Oh, K., & Jeong, S. (2007). Assessing the spatial distribution of urban parks using GIS. Landscape and Urban Planning, 82, 25-32.
Park, N., & An, S. (2012). Memorial Design for Relocation Site of Steam Locomotive in Jangdan Station on Kyong-Eui Railway. Journal of Korean Institute of Landscape Architecture, 40(4), 51-61.
41
Park, T., & Lee, M. (2015). Accessibility Measure of Cultural Facilities Using Urban Network Analysis. Journal of Korean Society of Civil Engineers, 35(2), 455-464.
Peters, K., Elands, B., & Buijs, A. (2010). Social interactions in urban parks: Stimulating social cohesion?. Urban Forestry & Urban Greening, 9, 93-100.
Poudyal, N. C., Hodges, D. G., & Merrett, C. D. (2009). A hedonic analysis of the demand for and benefits of urban recreation parks. Land Use Policy, 26(4), 975-983.
Seo, K. (2004). Gyeongui Line Underground Problem. Journal of Korean Society of Civil Engineers, 52(3), 56-60.
Sevtsuk, A., & Mekonnen, M. (2012). Urban network analysis: A new toolbox for ArcGIS. Revue internationale de geomatique, 2, 287-305. Sheather, S. J., & Jones, M. C. (1991). A Reliable Data-Based Bandwidth Selection Method for Kernel Density Estimation. Journal of the Royal Statistical Society, 53(3), 683-690.
TenHaken, V. & Cohen, E. (2007). Survival Behaviors of 100-Year-Old West Michigan Retail and Service Companies. Journal of Business & Economics Research, 5(8), 73-78.
Tyrvainen, L., & Miettinen, A. (2000). Property Prices and Urban Forest Amenities. Journal of Environmental Economics and Management, 39(2), 205-223.
Wolch, J., Jerrett, M., Reymolds, K., McConnell, R., Chang, R., Dahmann, N., Brady, K., Gilliland, F., Su, J. G., & Berhane, K. (2011). Childhood obesity and proximity to urban parks and recreational resources: A longitudinal cohort study. Health & Place, 17, 207-214. Won, H. (2017). A study on the effects of market area by Gyeongui Line Forest Park Project. Graduate School of Real Estate studies. Konkuk University.
Yang, S., & Yoo, S. (2016). Behavior Patterns in an Urban Linear Park, Reusing the Abandoned Railroad: Focused on Gyeongui Line Forest Park in Seoul. Journal of Urban Design Institute of Korea,
42 17(1), 110-115.
Yoon, H. (2013). Is a High-quality Park Worth the Cost? Hedonic Analysis of Housing Market near the High Line, New York City. Journal of Korea Planning Association, 48(7), 135-152.
Yoon, H., & Currid-Halkett, E. (2015). Industrial gentrification in West Chelsea, New York: Who survived and who did not? Empirical evidence from discrete-time survival analysis. Urban Studies, 52(1), 20-49.
Zukin, S., Lindeman, S., & Hurson, L. (2017). The omnivore ’s neighborhood? Online restaurant reviews, race, and gentrification. Journal of Consumer Culture, 17(3), 459-479.
43