P2-11 / Y. H. Song
IMID 2009 DIGEST •
Abstract
In order to apply to the White light emitting diodes (WLEDs), The Y2SiO5: Eu3+ as red phosphor was
synthesized by solid state reaction method. The highest emission of Y2SiO5: Eu3+ was shown when the Eu3+
concentration was 0.02. A single phase was observed from X-ray diffraction (XRD) analysis of synthesized samples and secondary phase wasn’t found.
1. Introduction
Recently, The WLEDs come into the spotlight because they have a lot of advantages such as chemical stability, low power consumption, and long life time compared with fluorescent lamp and incandescent lamp. [1-3] At a present time, The WLEDs are composed of InGaN blue chip coated yellow phosphor (YAG: Ce3+). [4] But, this method to
generate the WLED has many problems which aren’t applied to the indoor illumination source having the high luminescence efficiency because of low color rendering index (CRI) values. In order to solve these problems, we synthesized Eu3+ ion doped with Y
2SiO5
phosphor showing red emitting as a new type of materials which have high brightness color.
2. Experimental
The red phosphor which consists of Y2-xSiO5: Eu3+x
was synthesized by conventional solid state reaction method at high temperature. The Y2O3, SiO2 and
Eu2O3 are used for starting materials. These materials
are grinded as using the agate mortal and then, fired at 1450 oC for 6 hrs under air. After cooling to room
temperature, the phosphors obtained were grinded thoroughly in an agate mortar so as to analyze the properties of these phosphors. The crystalline phase of
the sample was examined by XRD (Cu Kα, 12 kW,
Rigaku, Japan) at 10° to 60° 2θ. The luminescent
properties of the phosphors were determined from the excitation and emission spectra using a room temperature PL spectrometer (PSI, Korea) equipped with a 500 W Xenon discharge lamp. The particle morphology was observed by FE-SEM (JEOL, JSM7500F, Japan).
3. Results and discussion
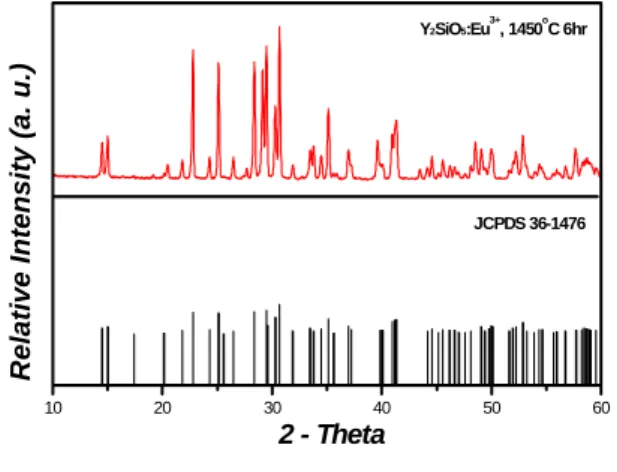
Figure 1 shows the x-ray diffraction pattern of Y 2-xO5: Eu3+x as a function of Eu3+ doping concentration
as red phosphor that is synthesized at 1450 oC for 6
hrs under air. According to the JCPDS card (No. 36-1476), the structure of the synthesized phosphor is a monoclinic and has a space group of 1*/a(15) that
consists of lattice parameter having a = 12.50, b = 6.728, c = 10.421. These results indicate that the synthesized samples have high purity and crystalline phase.
Fig. 1. XRD pattern of Y2SiO5 : Eu3+ phosphor
synthesized at 1450℃ for 6hr under air atmosphere.
Luminescence Properties of Y
2SiO
5: Eu
3+as Red-Emitting
Phosphor for White Light Emitting Diodes
Y. H. Song, W. J. Park
and D. H. Yoon*
1
School of Advanced Materials Science & Engineering, Sungkyunkwan University, 440-746, Suwon, Korea
TEL:82-31-290-7388, e-mail: [email protected]
Keywords : red phosphor, white light emitting diodes, energy transfer
10 20 30 40 50 60
R
e
lative Intensity (a. u.)
2 - Theta
Y2SiO5:Eu3+, 1450oC 6hr
P2-11 / Y. H. Song
• IMID 2009 DIGEST
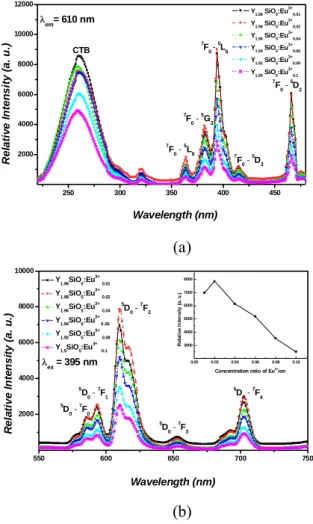
Figure 2(a) shows the excitation spectra (λem = 610
nm) of Y2O5: Eu3+ as a function of Eu3+ doping
concentration from 0.01 to 0.1 mol by conventional solid state reaction method at 1450 oC for 6 hrs under
air. The excitation spectra consist of a broad intense band with maximum at 260 nm and some weak bands owing to the charge transfer band of Eu3+ - O2-.
Figure 2(b) indicates the emission spectra (λem =
395 nm) of the synthesized sample. This spectra that is composed of 5D0→7F0 (585 nm), 5D0→7F1(593 nm), 5D
0→7F2 (610 nm), 5D0→7F3 (653 nm) and 5D0→7F4
(702 nm). Especially, the emission spectrum shows the strong peak due to 5D
0→7F2 transition of Eu3+.
When the doping concentration of Eu2+ is 0.02 mol,
the highest emission intensity is shown at 610 nm. However, the emission intensity is suddenly decreased below the highest emission intensity when the Eu2+ doping concentration ratio was 0.02, Consequently, this spectrum shows that the phosphors excited in the near UV region have strong red emission spectra when applied to RGB/UV chips in WLEDs.
(a)
(b)
Fig. 2. The comparison with the (a) excitation
spectra (λem = 610 nm) and (b) emission spectra
(λex = 395 nm) of Y2SiO5: Eu3+ red phosphor
synthesized by solid state reaction method at 1450
oC for 6 hrs under air concentration.
Figure 3 shows the SEM image of synthesized
sample at 1450 oC for 6 hrs under air. The crystal
structure of synthesized samples is shown as spherical shape of non uniformity and particle size of the phosphors were observed about 1~3 µm.
Fig. 3. FE-SEM image of Y1.98SiO5: Eu3+0.02 red
phosphor synthesized by conventional solid state
reaction method at 1450 oC for 6 hrs under air.
4. Summary
In conclusion, Eu3+ doped with Y
2SiO5 red
phosphor is prepared by conventional solid state reaction method. The results shows that the doping concentration of Eu3+ ion is 0.02 mol, The highest
emission intensity is observed and Y2SiO5 with doped
Eu3+ is the promising materials to apply the WLEDs
using near UV chip because of excellence about luminescence properties.
5. References
1. T. Suehiro, N. Hirosaki, R. J. Xie, K. Sakuma, M. Mitomo, M. Ibukiyama, and S. Yamada, Appl. Phys. Lett, Vol. 92, p. 191904 (2008).
2. B. Dierre, X.L. Yuan, N. Hirosaki, R.J. Xie, T. Sekiguchi, Mat. Sci. Eng. B. Vol. 146, p. 80-83 (2008).
3. P. Xianqing, K. Machida, T. Horikawa, H. Hanzawa, J. Rare. Earths. Vol. 26, p. 198-202 (2008).
4. C. Kulshreshtha, A. Kumar Sharma, and K. S. Sohn, Journal of Electrochemical Society, Vol. 156, p. J52-J56 (2009). 250 300 350 400 450 2000 4000 6000 8000 10000 12000 7 F0 -5G3 7 F0 - 5 D2 7 F0 -5 D3 7 F0 -5 L6 7 F0 -5L9 CTB λem= 610 nm R e la ti v e I n te n s it y (a . u .) Wavelength (nm) Y1.99 SiO5:Eu 3+ 0.01 Y1.98 SiO5:Eu 3+ 0.02 Y 1.96 SiO5:Eu 3+ 0.04 Y 1.94 SiO5:Eu 3+ 0.06 Y1.92 SiO5:Eu 3+ 0.08 Y1.90 SiO5:Eu 3+ 0.1 550 600 650 700 750 2000 4000 6000 8000 10000 0.00 0.02 0.04 0.06 0.08 0.10 3000 4000 5000 6000 7000 8000 R e la ti v e In te n s it y ( a . u .)
Concentration ratio of Eu3+ion
λex = 395 nm 5 D0 - 7F4 5 D0 -7 F3 5 D0 -7 F2 5 D0 -7F1 5 D0 -7 F0 Wavelength (nm) R e la ti v e I n te n s it y (a . u .) Y1.99SiO5:Eu 3+ 0.01 Y1.98SiO5:Eu 3+ 0.02 Y1.96SiO5:Eu 3+ 0.04 Y1.94SiO5:Eu 3+ 0.06 Y1.92SiO5:Eu 3+ 0.08 Y1.9SiO5:Eu 3+ 0.1