Systematic Variation of Summertime Tropical Cyclone Activity in the Western North
Pacific in Relation to the Madden–Julian Oscillation
JOO-HONG KIM, CHANG-HOIHO,ANDHYEONG-SEOGKIM
School of Earth and Environmental Sciences, Seoul National University, Seoul, Korea
CHUNG-HSIUNGSUI
Institute of Hydrological Sciences, National Central University, Jungli, Taiwan
SEONKI PARK
Department of Environmental Science and Engineering, Ewha Womans University, Seoul, Korea
(Manuscript received 15 May 2006, in final form 7 August 2007) ABSTRACT
The variability of observed tropical cyclone (TC) activity (i.e., genesis, track, and landfall) in the western North Pacific (WNP) is examined in relation to the various categories of the Madden–Julian oscillation (MJO) during summer (June–September) for the period 1979–2004. The MJO categories are defined based on the empirical orthogonal function analysis of outgoing longwave radiation data.
The number of TCs increases when the MJO-related convection center is located in the WNP. The axis of a preferable genesis region systematically shifts like a seesaw in response to changes in the large-scale environments associated with both the eastward and northward propagation of the MJO and the intrasea-sonal variability of the WNP subtropical high. Furthermore, the authors show that the density of TC tracks in each MJO category depends on the systematic shift in the main genesis regions at first order. Also, the shift is affected by the prevailing large-scale steering flows in each MJO category. When the MJO-related convection center is found in the equatorial Indian Ocean (the tropical WNP), a dense area of tracks migrates eastward (westward). The effects of extreme ENSO events and the variations occurring during ENSO neutral years are also examined.
A statistical analysis of TC landfalls by MJO category is applied in seven selected subareas: the Philip-pines, Vietnam, South China, Taiwan, East China, Korea, and Japan. While a robust and significant modulation in the number of TC landfalls is observed in south China, Korea, and Japan, the modulation is marginal in the remaining four subareas.
1. Introduction
Tropical atmospheric circulation shows signs of a sig-nificant spectral peak in the intraseasonal spectral band, indicating the importance of intraseasonal vari-ability for tropical weather. The most dominant tropical intraseasonal oscillation is known as the Madden– Julian oscillation (MJO: Madden and Julian 1971). The MJO represents eastward-propagating quasiperiodic
signals of circulation and convection. It originates over the Indian Ocean and moves eastward across the Mari-time Continent to the Pacific Ocean. The propagating features are shown on a planetary scale with a broad-band spectral peak ranging from 30 to 90 days. Exten-sive efforts have been made to understand the origin and dynamical/physical characteristics of the MJO and its impact on global and regional climate [for a review see Zhang (2005)]. The MJO interacts with the Asian– Australian monsoon (e.g., Lawrence and Webster 2002, and references therein), global tropical cyclone (TC) activity (e.g., Nakazawa 1986; Liebmann et al. 1994; Molinari et al. 1997; Molinari and Vollaro 2000; Ma-loney and Hartmann 2000a,b, 2001; Hall et al. 2001; Straub and Kiladis 2003; Bessafi and Wheeler 2006;
Corresponding author address: Chang-Hoi Ho, Climate Physics
Laboratory, School of Earth and Environmental Sciences, Seoul National University, Shillim-dong, Gwanak-gu, Seoul 151-742, Korea.
E-mail: [email protected] DOI: 10.1175/2007JCLI1493.1
© 2008 American Meteorological Society
Frank and Roundy 2006; Harr 2006; Ho et al. 2006), and cold surge occurrences and winter precipitation in East Asia (e.g., Jeong et al. 2005, 2008).
A possible linkage between the MJO and global TC activity was firstly detected by Gray (1979), even though other intraseasonal variability having different time scales, as well as the MJO, is involved in the link-age. He found that the period of active TC genesis over the globe tends to be clustered over a period of 2–3 weeks, followed by a comparable period of inactive TC genesis. Subsequently, a number of studies have been performed to clarify the relationship between the MJO and TCs in the global tropics. Over the western North Pacific (WNP), Nakazawa (1986) documented the clus-tering of TC occurrences according to the 30–60 day oscillation using outgoing longwave radiation (OLR) data obtained in 1979. Liebmann et al. (1994) extended this research using an additional data period and showed evidence for modulation of TC genesis by the MJO. They suggested that TC genesis tends to be fre-quent during the MJO convective period. However, the ratio of intense systems (i.e., tropical storms and ty-phoons) to weak systems (i.e., tropical depressions) seems to be nearly constant regardless of the convective and/or dry periods. Recently, Harr (2006) further iden-tified the MJO years that exhibit the temporal cluster-ing of TCs in the WNP and those that do not exhibit it, concluding that other factors that contribute to TC gen-esis override the inhibiting impacts due to the MJO during the latter years, while the temporal clustering is due to the significant decrease in TC occurrence during the suppressed convective period of the MJO during the former years.
To explain the enhanced TC genesis during the MJO convective period, some recent studies have investi-gated the genesis mechanism by means of low-level barotropic wave dynamics over monsoon confluence regions where the monsoon westerlies impinge on the trade easterlies (e.g., Sobel and Maloney 2000; Hart-mann and Maloney 2001; Maloney and HartHart-mann 2001; Aiyyer and Molinari 2003; Maloney and Dickinson 2003). Also, this mechanism can be explained as a baro-tropic wave accumulation associated with variations of the low-level zonal wind. Sobel and Maloney (2000) examined the time-mean barotropic wave activity flux at 850 hPa and found that it increases when the MJO is in a westerly (i.e., convective) phase in the WNP. In an extended study, Maloney and Hartmann (2001) ex-plained the modulation of TCs by the MJO in terms of low-level barotropic dynamics. When the MJO westerly anomalies at 850 hPa occur in the tropical WNP, the barotropic wave accumulation, from the mean flow to the eddy kinetic energy, becomes active. This process is
associated with an enhanced surface convergence and 850-hPa cyclonic shear of the monsoon flow so that active eddy growth in such an environment creates fa-vorable conditions for TC genesis. The converse is true during an anomalous MJO easterly phase. A study us-ing a linear shallow-water model by Aiyyer and Moli-nari (2003) further confirmed that the off-equatorial disturbances, approximately 1000–2000 km in scale, de-velop in the presence of the MJO, which could serve as precursors to TCs. They said that this process may be particularly relevant to cyclogenesis in the tropical WNP.
In addition to the aforementioned studies that fo-cused on the genesis or occurrence frequency of TCs, some studies have delineated the variability of TC tracks, for example, the geographical prevalence of TC occurrence over the East and Southeast Asia regions in relation to the tropical intraseasonal oscillation. Harr and Elsberry (1991, 1995) investigated the clustering of TC tracks in the WNP associated with variations of the monsoon circulation, having an intraseasonal time scale. They applied a fuzzy clustering method, which is a generalization of cluster analysis [refer to Harr and Elsberry (1995) for more detailed information], to clas-sify distinct 700-hPa circulation patterns and then tried to link circulation patterns with TC track descriptive characteristics such as “straight moving,” “recurving,” and “inactive.” Recently, Delk (2004) briefly described TC tracks in the WNP in relation to the submonthly mode (i.e., a 15–25-day band of the intraseasonal oscil-lation). However, to the authors’ knowledge, there has been no comprehensive discussion of spatial variations of TC activity (i.e., genesis locations, tracks, and land-falls) in the WNP connected to the evolution of the MJO in the time range of 30–90 days. Thus, parts of this study aim to provide such an analysis.
East and Southeast Asian countries are hit by several TCs every year (cf. Kim et al. 2005a). Since TCs bring heavy rainfall and strong wind gusts that result in se-vere natural disasters, they invariably result in the loss of human life and property. Therefore, it is important to improve the accuracy of forecasts of the monthly or seasonal activity of TC landfalls. For these long-lead forecasts, it is essential to understand the activity of landfalling TCs associated with atmospheric/oceanic low-frequency variability at time scales ranging from subseasonal to interannual. While some research has been conducted to obtain statistics for landfalling TCs associated with the El Niño–Southern Oscillation (e.g., Saunders et al. 2000; Elsner and Liu 2003; Liu and Chan 2003; Wu et al. 2004; Fudeyasu et al. 2006) and the Antarctic Oscillation (e.g., Ho et al. 2005), no effort has been spared to explore the relationship between
land-falling TCs and the MJO. Hence, parts of this study examine the statistics of landfalling TCs for each coastal area in every MJO category.
ENSO is known to be the most important planetary-scale phenomenon that affects interannual variations of TC activity in the WNP. The location of TC genesis shifts with the ENSO phase (e.g., Chia and Ropelewski 2002, and references therein) and track and landfall area do as well (e.g., Wang and Chan 2002; Wu and Wang 2004; Wu et al. 2004; Camargo and Sobel 2005; Camargo et al. 2007; Fudeyasu et al. 2006), showing that ENSO strongly modulates spatial variations of TC activity on an interannual time scale. Because this study aims mainly to investigate the spatial variations, the authors have tried to separate the impacts of the MJO from those related to ENSO phases.
This paper is organized into five sections as follows. Section 2 describes the datasets used, the methods of categorizing MJO evolution, and the placing of TCs into each MJO category. Section 3 discusses the main results that include the variability of TC genesis and tracks, explains the transitional characteristics from one category to the other and the statistics of TC landfalls, and gives an analysis of the effects of ENSO. Finally, a summary and discussion are presented in sections 4 and 5.
2. Data and analysis methods a. Data
Daily interpolated OLR obtained from the polar or-biting satellites of the National Oceanic and Atmo-spheric Administration (NOAA) has been utilized for identifying the structure and phase of the MJO (Lieb-mann and Smith 1996). The dataset is on a 2.5°⫻ 2.5° latitude–longitude grid and is available for the period from June 1974 to the present, except for the period from 17 March to 31 December 1978. The daily hori-zontal winds at seven pressure levels (i.e., 850, 700, 600, 500, 400, 300, and 200 hPa), the relative vorticity at 850 hPa, and the geopotential heights at 500 hPa obtained from the National Centers for Environmental Predic-tion–National Center for Atmospheric Research (NCEP–NCAR) reanalysis have been analyzed to ex-tract the large-scale circulation characteristics (Kalnay et al. 1996).
The Niño-3.4 (5°S–5°N, 120°–170°W) index has been chosen as an El Niño index, which is obtained from the NOAA monthly 2° ⫻ 2° extended reconstructed sea surface temperature (SST) anomalies, based on the 1971–2000 base period (Smith and Reynolds 2004).
The TC information used in this study has been ob-tained from the archive of the Regional Specialized
Meteorological Centers–Tokyo Typhoon Center. This dataset contains a 6-hourly record (a 3-hourly record in some cases) of the latitude/longitude position of the low center, minimum central pressure value, and maximum 10-min-averaged surface wind speed (max), for all
tropical storms (maxⱖ 17 m s⫺1) and typhoons (maxⱖ
33 m s⫺1) during the period 1951–2004. Therefore, the term TC covers both tropical storms and typhoons.
In the present study, the analysis period is confined to summer (June–September) from 1979 to 2004 be-cause TC activity in the WNP is known to be strong during summer (Ho et al. 2004), and satellite-derived data have been routinely incorporated into the NCEP– NCAR assimilation system since 1979 (Kalnay et al. 1996).
b. Analysis methods
1) DETERMINATION OF THEMJO CATEGORY The space–time wave filter (Hayashi 1971; Wheeler and Kiladis 1999) has been applied to the OLR data over the circumglobal tropical domain (20°S–20°N) in order to extract the eastward-propagating signals of the MJO. The wavenumber of the filter ranges from 0 to 5 and the period ranges from 30 to 90 days. Within these ranges of wavenumber and period, a large spectral power of the eastward-propagating waves was observed (see Fig. 3 of Wheeler and Kiladis 1999). After the filtering is carried out, an empirical orthogonal function (EOF) analysis was performed on the MJO-filtered OLR only for summer, as in Matthews (2000).
Figure 1 shows the two leading EOFs (i.e., EOF1 and EOF2) and their associated principal component (PC) time series (i.e., PC1 and PC2). While EOF1 exhibits negative OLR anomalies (i.e., strong convection) in the tropical Indian Ocean and positive anomalies (i.e., weak convection) from the Indian subcontinent to the western Pacific (Fig. 1a), EOF2 exhibits strong convec-tion from the Arabian Sea to the Maritime Continent and weak convection from the Indochina peninsula to the Philippine Sea (Fig. 1b). In general, these two EOFs illustrate a quadrature phase relationship in the spatial domain with a similar magnitude in their explained variance. In the temporal domain, PC1 leads PC2 by about 90° (Fig. 1c). It is evident that the two modes represent a propagating wave phenomenon (Zhang and Hendon 1997). Furthermore, it is noted that the propa-gating characteristic appears to be northward as well as eastward, although the space–time filtering used to ex-tract the MJO mode is based on zonal propagation alone. This is meaningful because the northward propa-gation of the intraseasonal oscillation is strongest over
the Indian Ocean and the WNP during summer (Wang and Rui 1990; Kemball-Cook and Wang 2001).
The phase and amplitude indices of the propagation vector can be expressed as tan⫺1[PC2(t)/PC1(t)] and
公
PC12(t)⫹ PC22(t), respectively. Here, four active cat-egories—A, B, C, and D—of the MJO are defined ac-cording to the phase index with the constraint that the amplitude is greater than one standard deviation. Cat-egory A denotes the first quadrant of the PC1–PC2 plane where the phase index is located between 0° and 90°. The remaining three categories are denoted by the second (90°–180°), third (180°–270°), and fourth (270°– 360°) quadrants of the PC1–PC2 plane. In addition, an inactive category—NONE—of the MJO is defined for the residual days.The sensitivity of the amplitude threshold is exam-ined by changing it from 0.5 to 1.5. Table 1 shows the
number of MJO days in each category according to variations in the amplitude threshold. If the threshold is set up at 0.5 standard deviation, the percentage of ac-tive MJO days is nearly 90% of the whole period. This is a somewhat unacceptable condition because the MJO is present nearly all of the time during summer. Al-though the major conclusions are little affected by set-ting up this loose threshold, the greater possibility of contamination of the MJO signal by the other variables may be unavoidable. By contrast, the percentage of ac-tive MJO days is only 34.6% when the threshold is set up at 1.5 standard deviation. While this strict condition is more evidently representative of MJO-related vari-ability, a period of scant MJO activity may restrict the limit of applicable time. On that account, a more “stan-dard” threshold of one standard deviation, which in-cludes 64% of the whole period, is adopted here (cf. FIG. 1. Two leading EOFs and the associated PC time series of the MJO-filtered OLR (wavenumber 0–5,
period 30–90 day) isolated by the space–time filtering: (a) first EOF explaining 24.0% of the filtered variance and (b) second EOF explaining 22.7% of the filtered variance. Dotted contours with dark shading denote negative values. Contour interval is 2 W m⫺2, zero contours omitted for simplicity. (c) First (solid line) and second (dotted line) PC time series for summer only (June–August) during the period 1979–82.
Wheeler and Hendon 2004; Bessafi and Wheeler 2006). However, it should be mentioned that defining the ac-tive MJO period cannot help avoiding its inherent ar-tificiality.
Figure 2 shows the four categories of the composite MJO life cycle represented by the OLR anomalies. The anomaly values used in the composite maps were ob-tained by subtracting the season mean value. Overall, the sequence of the four categories represents both eastward- and northward-propagating characteristics. In category A, anomalous deep convection dominates in the tropical Indian Ocean (Fig. 2a). As the convec-tion center propagates both east and north, the WNP
belongs to the convective phase in category C, showing an opposite structure compared to category A (Fig. 2c). Such examples of opposite OLR distributions are simi-larly found in the vast areas extending from the Ara-bian Sea to the Indochina peninsula in the case of cat-egories B and D (Figs. 2b and 2d).
2) COMPARISON WITH THERMMINDEX
Although the definition of the MJO in the present study is widely used in many studies (e.g., Wheeler and Kiladis 1999; Straub and Kiladis 2003; Bessafi and Wheeler 2006; Frank and Roundy 2006), some caveats must be given. There is another MJO index, called a real-time multivariate MJO (RMM) index, defined by Wheeler and Hendon (2004), that has been applied to monitoring and predicting MJO activity. The RMM in-dex is also defined by two leading PCs (i.e., RMM1 and RMM2) of the EOF analysis technique as the MJO index (i.e., PC1 and PC2) used in this study except that it is extracted from the combined fields of daily (with long-time-scale components removed) zonal winds at 850 and 200 hPa and OLR averaged between 15°S and 15°N without applying the bandpass time filter. Power spectra of the RMM (see Fig. 2 of Wheeler and Hendon 2004) show a large spectral peak at 30–80 days, which is typically associated with the MJO. Thus, it is necessary to compare the MJO index used in this study with the RMM index to qualify the results of this study.
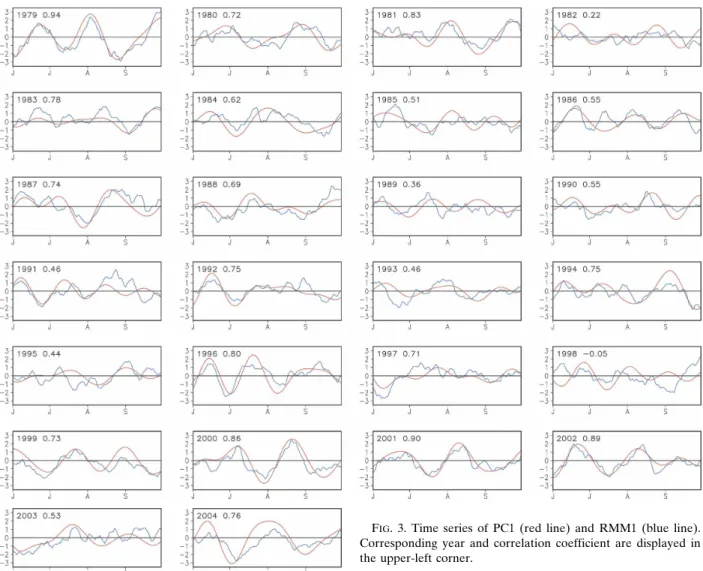
Figure 3 shows the PC1 and RMM1 during the whole analysis period. The two indices fluctuate analogously, having a correlation coefficient of 0.66. However, the two indices show a large discrepancy at some periods (usually during weak MJO periods), resulting in the ambiguity that a particular day belongs to completely different MJO categories. One reason why this study did not use the RMM is because it generates rather unstable phase propagation (i.e., retrograde phase tran-sition) due to day-to-day noise in the time series, which is not presented in the MJO index used in this study. The presence of day-to-day noise may be due to the existence of high-frequency spectral powers less than 30 days. In this regard, the RMM index may not be suit-able for this study, which mainly aims to clarify the FIG. 2. MJO life cycle represented as a composite of OLR
anomalies for each MJO category. Dotted contours with dark shading denote negative values. Contour interval is 5 W m⫺2, zero contours are omitted.
TABLE1. Number of days for which the MJO is in a particular category according to varying amplitude (Amp) threshold. A percentage of the total number of days is shown in parentheses.
Threshold
Category
Total
A B C D MJO days None
Ampⱖ 0.5 722 (22.8) 702 (22.1) 719 (22.7) 685 (21.6) 2828 (89.2) 344 (10.8) 3172 (100.0) Ampⱖ 1 530 (16.7) 513 (16.2) 506 (16.0) 488 (15.4) 2037 (64.2) 1135 (35.8)
impact of the MJO at the 30–90-day spectral band. Thus, the MJO index obtained from the EOF analysis of the space–time filtered OLR was utilized to isolate the effect of the MJO spectral band at 30–90 days.
3) ANALYSES OFTCACTIVITY
To examine the MJO–TC relationship, TCs are put into each MJO category based on the date of their gen-esis. If the TCs occur in any two consecutive MJO cat-egories after they propagate and develop, they belong to the first category, which is defined based on their genesis time. In addition, analyses are performed sepa-rately with respect to early summer (June–July, here-after JJ) and late summer (August–September, hereaf-ter AS) to consider the timing of the MJO categories. The genesis locations and tracks of TCs, and the fre-quency of TC passage (TPF), are also examined. The TPF is the value obtained by dividing the number of TC occurrences in each 5°⫻ 5° latitude–longitude grid by
the total number of the TCs in each MJO category. In other words, the TPF denotes the probability density distribution of TCs in the spatial domain (see Ho et al. 2004).
To consider the effect of ENSO on TC activity, El Niño (La Niña) years were chosen when the summer-mean Niño-3.4 index was greater (less) than 0.5°C (⫺0.5°C). The selected years were 1982, 1987, 1991, 1994, 1997, 2002, and 2004 for El Niño and 1988, 1998, and 1999 for La Niña. The other 16 years were classified as neutral years.
Following Hall et al. (2001), a statistical test was per-formed to test whether the number of TC geneses and landfalls for each MJO category were significantly differ-ent from the uniformly distributed value in each category. If we assume that the probability of TC genesis or land-fall on any particular day is constant, the probability distribution can be regarded as a binomial distribution. The test statistic is Z⫽ ( pˆ ⫺ p0)/
公
p0(100⫺ p0)/N inFIG. 3. Time series of PC1 (red line) and RMM1 (blue line).
Corresponding year and correlation coefficient are displayed in the upper-left corner.
which p0, pˆ, and N are the expected and observed
per-centages of TC genesis and landfall days and the num-ber of days for a particular MJO category, respectively. The test statistic Z generally follows a Gaussian normal distribution with an expected value 0 and variance 1 when the sampling day N is large enough.
3. Results a. Genesis
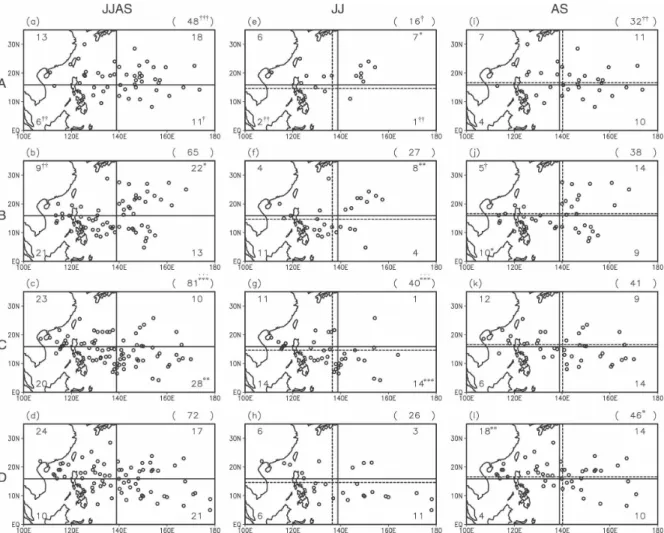
Figure 4 presents the locations of TC genesis during summer (Figs. 4a–d), JJ (Figs. 4e–h), and AS (Figs. 4i–l) for each MJO category. The horizontal and vertical lines delineate four quadrants; these lines intersect at the mean position (15.9°N, 138.9°E) of all 413 TCs dur-ing summer, at 14.6°N, 136.5°E for all 151 TCs durdur-ing
JJ, and at 16.6°N, 140.2°E for all 262 TCs during AS. Numbers significantly above or below the climatology by statistics, as in Hall et al. (2001), are marked with asterisks or cross symbols, respectively.
The number of geneses increases from category A to C and decreases from category C to A during summer (48→65→81→72) and JJ (16→27→40→26). The num-bers of geneses in categories A (C) are significantly fewer (more) over the 90% confidence level than the climatological average. These changes coincide with the variations of the composite OLR anomalies in the WNP (Fig. 2). These results are also consistent with previous studies (e.g., Nakazawa 1986; Liebmann et al. 1994). To check the seasonal difference of MJO-related variations in the total genesis number, it is shown separately for JJ and AS (Figs. 4e–l). The changes from category A to D are smaller during AS FIG. 4. Total number (in parentheses) and positions (open circle) of TC geneses during (a)–(d) summer, (e)–(h) JJ, and (i)–(l) AS for each MJO category. Horizontal and vertical lines indicate the boundaries of subregions centered on the mean genesis location of all TCs during summer (solid line), JJ, and AS (dashed line). Numbers in each quadrant indicate the genesis number of that quadrant. If the TC numbers are significantly above (below) climatology at the 90%, 95%, and 99% confidence levels, this is indicated by an asterisk (cross) [* (†)], double asterisks (crosses) [** (††)], or triple asterisks (crosses) [*** (†††)], respectively.
(32→38→41→46) than during JJ (16→27→40→26), though the number of geneses is large, indicating that the aforementioned variations in the number of geneses during summer can be mainly attributed to that during JJ. It is noted that the modulation of basinwide TC genesis by the MJO spectral band is rather weak during AS, suggesting that there are other large-scale contrib-uting factors that are important to TC genesis. These include off-equatorial tropical depression (TD) type disturbances that have the characteristic time scales of synoptic waves (i.e., 3–10 days) (e.g., Lau and Lau (1990); Takayabu and Nitta (1993); Chang et al. (1996)), which may be initiated by the scale contraction of mixed Rossby–gravity (MRG) waves within a mon-soon confluent region (e.g., Sobel and Bretherton 1999; Kuo et al. 2001; Dickinson and Molinari 2002; Aiyyer and Molinari 2003) or by Rossby wave energy disper-sion in the wake of a preexisting TC (e.g., Briegel and Frank 1997; Ritchie and Holland 1999; Sobel and Bretherton 1999; Li et al. 2003; Li and Fu 2006), and the intraseasonal variability of the monsoon circulation and convection that have submonthly time scales (e.g., Hartmann et al. 1992; Fukutomi and Yasunari 1999; Delk 2004; Ko and Hsu 2006). Although these factors are not the main scope of this study, we suggest that consideration of these factors together with the MJO would be necessary for a better understanding of varia-tions in TC genesis in further studies.
Spatial variations of the major locations of TC gen-esis on a subbasin scale are detected as clearly as the basinwide variations in the total number. The axis of preferable genesis regions is found to shift like a seesaw according to variations in the MJO category. In cat-egory A, it is found that there is significantly low fre-quency in the number of geneses in the two bottom quadrants during summer and JJ, but not during AS (Figs. 4a, 4e, and 4i). As the category changes from A to B (cf. Figs. 4a and 4b), the number of TCs in the southwest quadrant during summer changes from 6, which is significantly below normal, to 21, which is nei-ther significantly below nor above normal. A change in this quadrant mostly accounts for that in the entire do-main (48 versus 65). This significant increase is also found during both JJ (2→11, cf. Figs. 4e and 4f) and AS (4→10, cf. Figs. 4i and 4j). Although changes in the actual number are not as large as those in the southwest quadrant, other notable changes in the number from A to B are found in two top quadrants: the number in the northwest quadrant becomes significantly below nor-mal in category B, but significantly above nornor-mal in the northeast quadrant. As the category changes from B to C (cf. Figs. 4b and 4c), a significant increase in the number of TC geneses is observed in both the
north-west (9→23) and southeast quadrants (13→28), but a decrease (22→10) in the northeast quadrant; this is as-sociated with enhanced convection activity and the cir-culation response in the WNP (Figs. 2c, 5c, and 6c). The significant variations are also seen in the northeast (8→1) and southeast (4→14) quadrants during JJ (cf. Figs. 4f and 4g), and in the northwest (5→12) and southwest (10→6) quadrants during AS (cf. Figs. 4j and 4k). For the changes from category C to D (cf. Figs. 4c, 4g, 4k and 4d, 4h, 4l), the overall genesis locations shift northward, especially in the west of the mean genesis longitude; this is associated with the intrusion of a re-duced convective phase into the tropical western Pacific (Fig. 2d). However, the statistical significance of the northward shift is only found in the northwest quadrant (12→18) during AS (Fig. 4l).
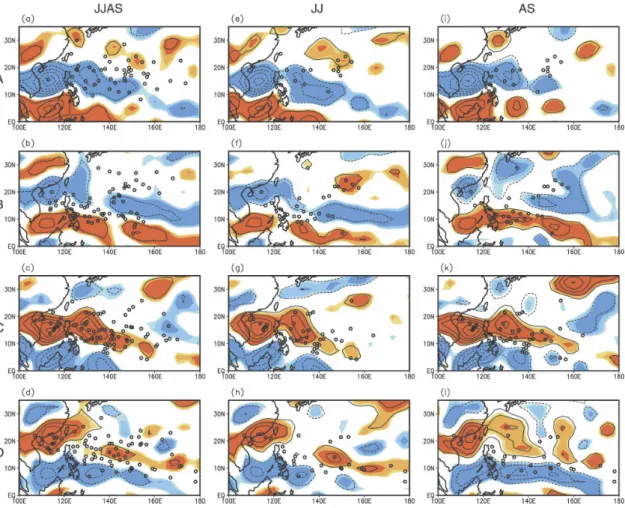
The dynamic parameters that control TC genesis, such as the 850-hPa relative vorticity (Fig. 5) and total and zonal vertical wind shear (Fig. 6), were investigated with respect to each MJO category. Consistent with the northward propagation of the MJO-related convection center, as seen in Fig. 2, the 850-hPa vorticity anomalies move north as well (Figs. 5a–d). The propagating char-acteristics during JJ (Figs. 5e–h) and AS (Figs. 5i–l) are nearly identical to those during summer. In categories A and B, quite a few TCs form to the northeast of the negative vorticity anomalies. TC genesis increases along the periphery of the equatorial positive vorticity anomalies in category B. The concentration of TC gen-esis over the positive vorticity anomalies dramatically increases in categories C and D, indicating that many of TC geneses are systematically linked with the propaga-tion of the MJO. While not shown in the figure, the increase of positive vorticity anomalies is related to an enhanced monsoon confluent zone due to an increase in low-level westerlies. In this mean state, favorable conditions for TC genesis occur over the confluence region possibly through the wave accumulation (e.g., Maloney and Hartmann 2001; Kuo et al. 2001; Aiyyer and Molinari 2003) and/or the emanation of Rossby waves in the wake of a preexisting TC (e.g., Sobel and Bretherton 1999; Li et al. 2003; Li and Fu 2006).
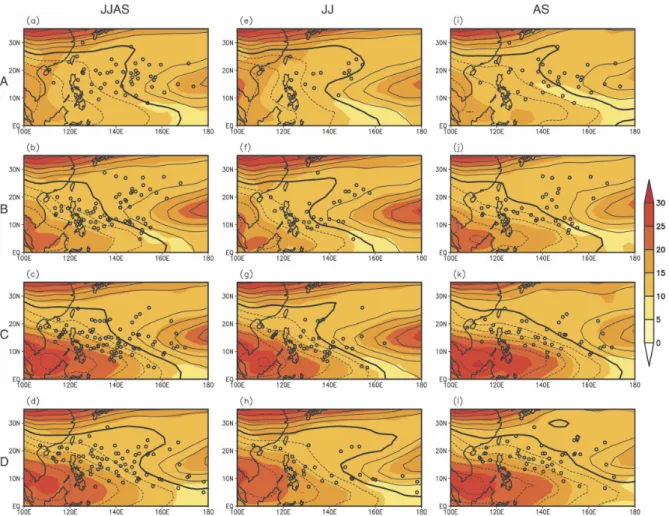
As the MJO convection center migrates from the In-dian Ocean to the WNP, the spatial field of vertical wind shear indicates the intrusion of a strong shear zone into the tropical WNP, with easterlies to the west and westerlies to the east (cf. Figs. 6a, 6e, 6i and 6c, 6g, and 6k). While the intrusion of the easterly shear mainly occurs between the equator and 15°N, that of the westerly shear is centered between 10° and 20°N. The intrusion of the strong shear zone makes the weak shear region (⬍15 m s⫺1) narrower, causing a more
in-stance, the weak shear region covers a vast area of the WNP in category A, resulting in the spread of TC gen-esis locations (Figs. 6a, 6e, and 6i). On the other hand, it becomes much narrower in both zonal and meridio-nal directions in category C, resulting in the clustered TC genesis (Figs. 6c, 6g, and 6k). In contrast to JJ, the intrusion of the easterly shear zone becomes broader during AS so that the westerly shear zone to the east becomes narrower. Further, it is found that TCs prefer to form in regions of weak easterly vertical wind shear, especially in categories C and D in which the active MJO-related convection and corresponding enhanced cyclonic vorticity are propagating in the WNP (Frank and Roundy 2006). However, this propensity disap-pears during the suppressed convective periods of the MJO in the WNP, that is, categories A and B.
b. Track
Tropical cyclone tracks generally follow the steering flows, defined as the tropospheric layer-mean winds
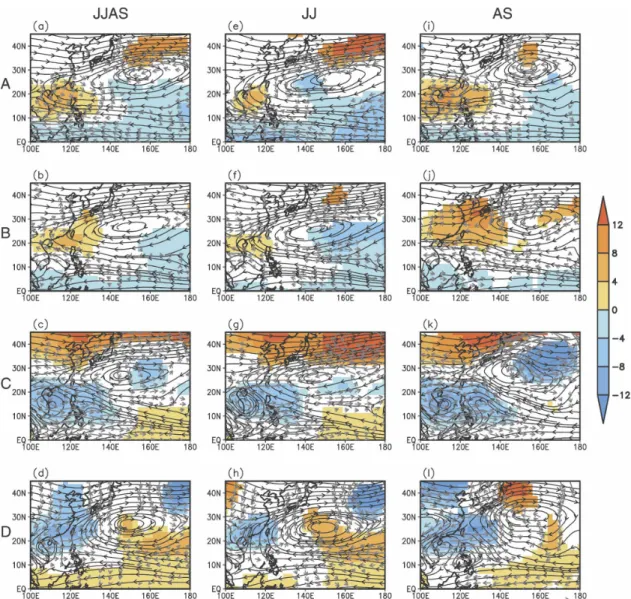
(Chan and Gray 1982), around the periphery of a sub-tropical high. Hence, it is expected that the geographi-cal distribution of TC tracks would be influenced by systematic changes in the steering flows linked to the phase transition of the MJO. Figure 7 shows actual TC tracks during summer (Figs. 7a–d), JJ (Figs. 7e–h), and AS (Figs. 7i–l) for each MJO category and the clima-tologies and anomalies of the TPF are given in Fig. 8. In addition, the total fields of the tropospheric layer-mean winds (i.e., steering flows) and their statistically signifi-cant anomalies by a two-tailed t test for each MJO cat-egory, along with the statistically significant regions of the 500-hPa geopotential height, are presented in Fig. 9. In the case of category A, straight-moving TCs to the South China Sea are relatively few and nearly half of the TCs that formed in the WNP pass across the ocean southeast ocean of Japan (Figs. 7a, 7e, and 7i). These characteristics are clearly observed in the TPF plot: the TPFs increase over the ocean southeast of Japan, but decrease over the Philippine Sea and toward the South FIG. 5. Position of TC geneses (open circle) and composite 850-hPa vorticity anomalies during (a)–(d) summer, (e)–(h) JJ, and (i)–(l) AS for each MJO category. Regions statistically significant at the 90%, 95%, and 99% confidence levels are shaded with a darker color for a higher confidence level. Dotted contours denote negative values. Contour interval is 2⫻ 10⫺6s⫺1, zero contours are omitted.
China Sea and Korea (Figs. 8b, 8g, and 8l). The increase southeast of Japan is statistically significant over the 90% confidence level. The large-scale circulation in-volves two anticyclonic anomalies impinging against a cyclone between them: one along the South China Sea toward the Philippine Sea and the other offshore east of Japan (Figs. 9a, 9e, and 9i). While the two anticyclonic anomalies expand the domain of the WNP subtropical high (WNPSH) to the South China Sea and offshore east of Japan, the cyclonic anomaly between them weakens the strength of the WNPSH south of Japan. If we consider these wave responses in the steering flow together with the genesis parameters that were shown in Figs. 5 and 6, we can reason that the MJO-related variability in TC tracks in this category is largely influ-enced by the genesis region at a first order. The north-ward propagation of the TCs that formed around the southern part of the cyclonic anomaly is mainly due to the weakened WNPSH offshore south of Japan. On the other hand, the relatively weak TC activity over the
Philippine Sea toward the South China Sea is mainly caused by fewer TC geneses there due to suppressed convection (Figs. 2a and 4a).
In the case of category B, the frequency of straight-moving TCs is obviously greater compared to that of category A (Figs. 7b, 7f, and 7j). This difference be-tween the two categories is mainly due to a consider-able increase in the number of geneses in the southwest quadrant (Figs. 4b, 4f, and 4j). The TCs formed in the southwest quadrant, that is, the southern periphery of the WNPSH, are steered by the easterlies (Figs. 9b, 9f, and 9j) so that they tend to propagate straight to the west. This results in an increase of the TPF to the west of the main formation region (Figs. 8c, 8h, and 8m). Compared to JJ, however, there exists an eastward shift in the positive TPF region during AS, which is caused by the conglomerate of TC geneses around 150°E in the southeast quadrant (Fig. 4j) and their northwestward propagation over the region of enhanced easterly steer-ing flows (Fig. 9j). The strengthensteer-ing of the WNPSH FIG. 6. Position of TC geneses (open circle) and total field of the composite total vertical wind shear (shading) and zonal vertical wind shear (contour) during (a)–(d) summer, (e)–(h) JJ, and (i)–(l) for each MJO category. Shading scale is indicated in the legend. Dotted contours denote negative values. Contour interval is 5 m s⫺1, zero lines of the zonal vertical wind shear are represented by a thick solid line.
around the East China Sea is attributed to a northward migration of the anticyclonic anomaly, especially ap-parent during AS, resulting in a decrease of the TPF anomalies along the East China Sea through the east Philippine Sea.
In the case of category C, the overall density of TC tracks increases owing to the increase in the number of geneses (cf. Figs. 7c, 7g, 7k and 8d, 8i, 8n). The increase is statistically significant along the Philippine Sea–East China Sea–Korea, which may be due to the increase in the number of geneses in the northwest and southeast quadrants, as shown in Fig. 4. In this category, the strong westerly wind bursts along the equator alter the large-scale monsoon circulation, enhancing the
mon-soon trough (Figs. 9c, 9g, and 9k). As a result, an anomalous cyclonic cell dominates along the South China Sea and across the Philippine Sea during both JJ and AS. There is another anomalous cyclonic cell far offshore southeast of Japan, showing a large seasonal difference: it is located around (20°N, 160°E) during JJ that is a slightly southeast position from the center of the WNPSH and is located around (35°N, 160°E) with stronger intensity during AS that is a northeast position from the center of the WNPSH. The latter represents a strong midlatitude trough (Fig. 9k) that is related to several northward-propagating tracks (Fig. 7k) over that region. Meanwhile, the TCs formed offshore east of the Philippines show slightly more north-oriented FIG. 7. Tracks (dark gray line) and genesis positions (open circle) of TC during (a)–(d) summer, (e)–(h) JJ, and (i)–(l)
tracks, compared to category B. This is also apparent in Fig. 8d, in which the region of increased TPF shifts slightly northeastward. This more north-oriented steer-ing of TCs is related to the weakened easterly steersteer-ing flows around the Philippines caused by the expansion of the monsoon trough. Also, this is apparently inferred
from the strong anomalous westerlies south of 15°N, which may block the westward propagation of the TCs formed over the Philippine Sea.
Category D also shows dense tracks over the north-west Philippine Sea toward the East China Sea; how-ever, the density of tracks offshore east of the Philip-FIG. 8. TC passage frequencies in each 5°⫻ 5° latitude–longitude grid during (a)–(e) summer, (f)–(j) JJ, and
(k)–(o) for the respective climatologies and the anomalies from the corresponding climatology for each MJO category. Dotted contours denote negative values. Contour interval is 2.5%, zero contours are omitted for sim-plicity. Regions statistically significant at the 90%, 95%, and 99% confidence levels are shaded with darker color for higher confidence level.
pines toward the South China Sea is slightly lower (cf. Figs. 7d, 7h, 7l and 8e, 8j, 8o). The reasons for this variability are as follows. First, TC genesis decreases in the two southern quadrants (Figs. 4d, 4h, and 4l). Sec-ond, the westerly anomalies propagate west of 140°E in the region 10°–20°N in association with the northward-propagating cyclonic anomaly; the westerly anomalies are then altered to become southerly anomalies off-shore south of Japan as they meet the easterly anoma-lies, which makes the WNPSH retreat to the east, but strengthen it meridionally (Figs. 9d, 9h, and 9l).
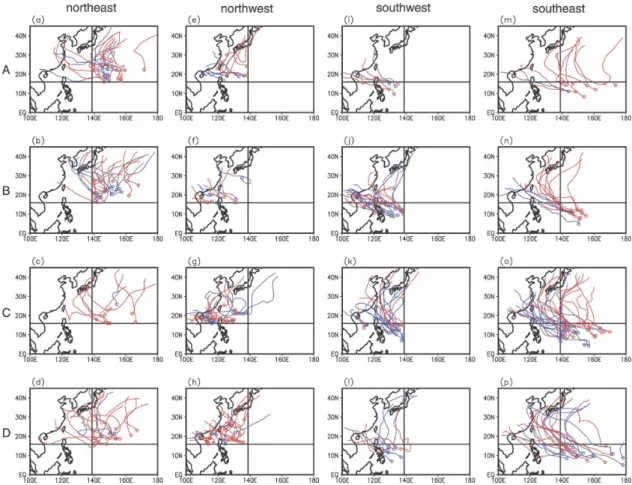
To provide more detail, TC tracks are plotted sepa-rately within the four quadrants divided according to subseasons (JJ and AS) (Fig. 10). The TC tracks that
formed in the northeast quadrant for the four MJO categories are displayed in Figs. 10a–d. The distinction between tracks of category A and the others is notice-able; the TC tracks of category A are concentrated off-shore southeast of Japan, compared to those of other categories. This means that the TCs formed in the northeast quadrant are steered more systematically in category A than in other categories. The TC tracks of categories B, C, and D, by contrast, show a sporadic distribution.
Next, the TCs originating from the northwest quad-rant are presented (Figs. 10e–h). On the whole, the movement in this quadrant looks erratic, which may be due to variable steering. The TCs formed during JJ FIG. 9. Total field of the tropospheric layer-mean winds (streamline), the tropospheric layer-mean wind anomalies
(vector; unit: m s⫺1), and the 500-hPa geopotential height anomalies (shading; unit: gpm) during (a)–(d) summer, (e)–(h) JJ, and (i)–(l) for each MJO category. Only values statistically significant at the 95% confidence level are presented for the tropospheric layer-mean wind anomalies and the 500-hPa geopotential height anomalies.
preferably propagate westward due to the effect of the strong ridge in categories A and B (Figs. 9e and 9f), but their direction of propagation becomes erratic due to the weakening of the WNPSH there in categories C and D (Figs. 9g and 9h). Also, tracks propagating westward are dominant in category B, but those propagating northward are more numerous in category D according to the intensity variations of the WNPSH in that region (Figs. 9b and 9d).
It should be noted that TC activity in the southwest quadrant is revealed to be very sensitive to the MJO (Figs. 10i–l). In addition to variations in the number of geneses, the TC tracks are more westward oriented in categories A and B (Figs. 10i–j), while they are slightly northward oriented in the cases of categories C and D (Figs. 10k and 10l). These features are easily under-stood by examining the steering flows around the pe-riphery of the WNPSH in this quadrant, in which the easterlies are weakened by the intrusion of the MJO-related westerly wind bursts along the equator between categories B and C (see Figs. 9j and 9k). Owing to more northward-oriented tracks in category C, some TCs can
reach the East China Sea, and further reach the land on the Korean peninsula. The seasonal difference between JJ and AS is negligible.
Finally, we plot the TCs formed in the southeast quadrant (Figs. 10m–p). Together with the TCs of cat-egory A in the northeast quadrant, those of catcat-egory A in this quadrant also contribute significantly to an in-crease in the TPF southeast of Japan (Fig. 10m). The weakened ridge north of the region lets the TCs propa-gate northward (Fig. 9i). In contrast to the variability in the northeast quadrant, the TCs of category B propa-gate more to the west than those of category A, that is, they are well clustered compared to the TCs of other categories (Fig. 10n). This is because the WNPSH in category B is stronger than that in category A (Fig. 9j). In categories B and C, there exists a noticeable seasonal difference in TC tracks, with more straight-moving TCs during JJ than during AS. This is obviously due to the difference of the mean location of the western periph-ery of the WNPSH (cf. Figs. 9f, 9g and 9j, 9k). However, the tracks in category D do not show any remarkable seasonal difference.
FIG. 10. Tracks and genesis positions (open circle) of TC for JJ (blue line) and AS (red line) for each MJO category formed in the (a)–(d) northeast, (e)–(h) northwest, (i)–(l) southwest, and (m)–(p) southeast quadrants defined in Fig. 4.
c. Landfalling statistics
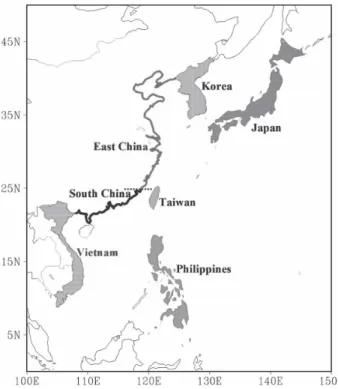
In this study, the coastal area is divided into seven subareas: the Philippines, Vietnam, south China, Tai-wan, east China, Korea, and Japan (Fig. 11). The main factor taken into account is the national boundary, but China is further divided into two subdivisions (i.e., south China and east China) with respect to an artificial boundary line along 25°N due to its large territory.
Table 2 gives the statistics for the number of days and TC landfalls for the four active MJO categories, and the category NONE (weak MJO activity period), with re-spect to each subarea. From a statistical perre-spective, there is a significant modulation in Vietnam, south China, Korea, and Japan over the 90% confidence level using a two-tailed t test. Variations in the remaining three subareas also exhibit a modulation by the MJO to some degree, but they are not significant at the 90% confidence level. However, defining the landfall from the best-track dataset is a subtle skill because some tracks are not easy for us to decide whether they cross the coastal line or not. After testing the number of landfalls by slightly changing the extent of the landmass area, a robust and statistically significant signal was found in south China, Korea, and Japan.
While it is not statistically significant, the number of TC landfalls in the Philippines slightly increases to 14 (2.7% of the total of 513 days for category B) and 13
(2.6% of the total of 506 days for category C) for cat-egories B and C, respectively, compared to the clima-tology (2.2% of the total of 3172 days). This is obvious because of frequent TC geneses offshore east of the Philippines (see Figs. 4b and 4c). Vietnam in category A experienced only four TCs (0.8% of the total of 530 days for category A); this number is statistically signifi-cant at the 90% confidence level. The number increases to 13 (2.5%) for category B, to which the major con-tributing factors are an increase in the number of straight-moving TCs propagating into the South China Sea across the Philippines that formed in the offshore area east of the Philippines as well as frequent genesis in the South China Sea. In the south China area, there is a robust and statistically significant modulation in categories A and C; this is consistent with the variabil-ity of convection and the large-scale steering flows (cf. Figs. 2a, 9a and 2c, 9c).
In Taiwan, the number of landfalling TCs is slightly larger for categories C (i.e., 10) and D (i.e., 11) than for categories A (i.e., 7) and B (i.e., 5), but none of them are statistically significant. The modulation in TC land-falls over east China is the weakest. In this area, the number does not show any systematic changes in rela-tion to the MJO. On the other hand, it is found that TC landfalls are strongly concentrated in a specific cat-egory in Korea. While Korea experiences only one (0.2%) TC landfall in category A, the number increases to 11 (2.2%) in category C. This signal is the most ro-bust and is unaffected by any changes. All of these values are significant over the 90% confidence level. In particular, the percentage value in category C is signifi-cant at the 99% confidence level, compared to the cli-matology (0.9%). In Japan, the number of TC landfalls is the smallest in category A (i.e, 6), which is statistically significant at the 90% confidence level, and the largest in category D (i.e., 15), which is not statistically signifi-cant.
d. Separation of the ENSO effects
As discussed in the introduction, ENSO has been known to be the most outstanding planetary-scale phe-nomenon affecting interannual variations of TC activity in the WNP. It has been found that the MJO is also related to ENSO warm events (e.g., Kindle and Phoe-bus 1995; Wang and Weisberg 2000; Bergman et al. 2001; McPhaden 2004). Although the mechanism of the effects of the MJO on ENSO is still a topic of debate, strong MJO events have been frequently observed dur-ing the developdur-ing stages of recent major El Niño events. Further, Zhang (2005) mentioned that the in-terannual SST warming in the central and eastern Pa-cific is comprised several intraseasonal events associ-FIG. 11. Delineation of the seven subareas: the Philippines,
ated with the MJO. Thus, it is necessary to take the effect of ENSO into account in the present study.
To simplify the problem, ENSO years are chosen based on the Niño-3.4 index. The selected years were described in section 2. Figure 12 displays all TC tracks and the number of geneses and their division by cat-egory for El Niño, La Niña, and neutral years. In addi-tion, the statistics of the number of days and TC gen-eses for each MJO category in relation to ENSO are given in Table 3. The TCs during El Niño (La Niña) years largely form in the southeast (northwest) quad-rant (Figs. 12a and 12f), as revealed in many previous studies (e.g., Fudeyasu et al. 2006, and references therein). In accordance with the interannual shift in the major region of genesis, the variability associated with the MJO is highly concentrated in the southeast and northwest quadrants during El Niño and La Niña years, respectively (cf. Figs. 12b–e and 12g–j). Changes in the number of basinwide geneses for ENSO events are similar to those for all years with the concentration of geneses in categories C and D (Table 3). Though ex-treme ENSO events are removed, spatial variations of TC geneses and tracks are nearly identical to those for all years (Figs. 12l–o). In addition, the variability of the TPF anomalies is well conserved (figure not shown). However, the modulation of the number of basinwide TC geneses (35→40→44→41) becomes slightly weaker, compared to that for El Niño and La Niña years, sug-gesting the possibility of the intensification of the MJO effect on TC activity during extreme ENSO events. This view needs further substantiation in any future studies.
4. Summary
In the present study, we have explored the systematic variations of summertime TC activity in the WNP in
relation to the MJO. By applying a space–time wave filter to the OLR data during 1979–2004, the MJO can be defined as eastward-propagating waves whose wave-numbers range from 0 to 5 and periods from 30 to 90 days. Next, the EOF analysis is performed to define the phase and amplitude of the MJO. The four active MJO categories (A–D) and category NONE indicating peri-ods of weak MJO activity are defined. Based on these defined categories, the TCs are placed into each cat-egory and composite maps of the OLR and NCEP– NCAR data are obtained. The categorized TCs are fur-ther examined by dividing them into four quadrants (i.e., northeast, northwest, southwest, and southeast) whose center is located at (15.9°N, 138.8°E); this center is the mean genesis position of all summertime TCs. The TC categorizing procedure and composite analyses are repeated for JJ and AS to consider the seasonality. In addition, the effect of strong ENSO events is sepa-rated from the TC analyses.
Category A presents the smallest number of TC gen-eses (i.e., 48) in all categories, which the MJO-related enhanced convection locates in the tropical Indian Ocean. It is manifest in the southwest quadrant where the number is 6; hence, there are very few straight-moving TCs in the South China Sea. However, it shows that TC activity greatly increases in the ocean southeast of Japan; this is attributed to both the intrusion of the weak vertical shear zone in that region and the weak-ened WNPSH, which results from the cyclonic anomaly between the two significant anticyclonic anomalies: one along the South China Sea across the Philippine Sea and the other offshore east of Japan. The former is directly connected to the MJO-related suppressed con-vection cell in the South China Sea and the latter may be located along the great circle of the wave train in-duced by anomalous MJO-related heating. In this cat-TABLE2. Statistics of the number of days and TC landfalls in each subregion for which the MJO is in a particular category. For the number of days, a percentage of the total number of days is shown in parentheses. For the number of TC landfalls, a percentage daily landfall rate (defined by the percentage of the landfall number of the number of days for each category) is shown in parentheses. Categories in which TC numbers are significantly above (below) climatology at the 90%, 95%, and 99% confidence levels are indicated by an asterisk (cross) [* (†)], double asterisks (crosses) [** (††)], or triple asterisks (crosses) [*** (†††)], respectively.
Category Total A B C D None MJO days 530 (16.7) 513 (16.2) 506 (16.0) 488 (15.4) 1135 (35.8) 3172 (100.0) Philippines 8 (1.5) 14 (2.7) 13 (2.6) 11 (2.3) 24 (2.1) 70 (2.2) Vietnam 4 (0.8)† 13 (2.5) 10 (2.0) 9 (1.8) 17 (1.5) 53 (1.7) South China 8 (1.5)† 15 (2.9) 21 (4.2)* 15 (3.1) 33 (2.9) 92 (2.9) Taiwan 7 (1.3) 5 (1.0) 10 (2.0) 11 (2.3) 13 (1.1) 46 (1.5) East China 9 (1.7) 6 (1.2) 9 (1.8) 7 (1.4) 9 (0.8) 40 (1.3) Korea 1 (0.2)† 2 (0.4) 11 (2.2)*** 5 (1.0) 9 (0.8) 28 (0.9) Japan 6 (1.1)† 10 (1.9) 12 (2.4) 15 (3.1) 28 (2.5) 71 (2.2)
egory, the number of TC landfalls is statistically signifi-cantly decreased in Vietnam, south China, Korea, and Japan compared to climatology.
From categories A to B, the number of TC geneses greatly increases, from 6 to 21, in the southwest
quad-rant along with the intrusion of a strong convective region to the equatorial western Pacific. Moreover, straight-moving TCs increase to the South China Sea along with the westward expansion of the WNPSH. Meanwhile, the longitudinal zone of weak vertical wind FIG. 12. Tracks and genesis positions (dot) of TCs formed in (a)–(e) El Niño, (f)–(j) La Niña, and (k)–(o) neutral years during summer and for each MJO category. Horizontal and vertical lines indicate boundaries of the subregions centered on the mean genesis location of all summertime TCs. Numbers in each quadrant indicate the genesis number of that quadrant.
shear becomes narrower, resulting in an intensified de-gree of clustering in the monsoon confluence zone. This variability is evident during JJ, but not during AS.
Since the anomalous deep convection around the equator migrates farther north and the WNPSH re-treats northeastward in category C, a cyclonic circula-tion anomaly prevails over most of the WNP basin. The weak shear zone becomes further narrowed, especially during JJ. Accordingly, TC genesis is most active (i.e., 81) and is clustered in the region of active convection for this category. In addition, the major genesis region shifts to the north and east (i.e., the northwest and southeast quadrants) with many TC geneses in the southwest quadrant (i.e., 20). However, the number of geneses decreases considerably in the northeast quad-rant (22→10). The region of TC geneses in this category is directly linked with the MJO-related enhanced con-vection. In comparison to category B, more TCs form in the north South China Sea and, further, reach south China; the TPF through the Philippine Sea–east China Sea–Korea line increases, resulting in significantly en-hanced TC landfalls in south China and Korea.
The anomalous deep convection moves further northward and is in a decaying stage in category D. Therefore, the overall genesis frequency is slightly re-duced when compared to category C and migrates northward. Consistent with the changes in large-scale environments (i.e., the eastward retreat and meridional broadening of the WNPSH), TCs propagate preferen-tially to the east China Sea and farther to Japan. Con-sequently, Taiwan and Japan experience a slight, but statistically insignificant, increase in the number of TC landfalls in this category.
Analyses of the ENSO effects reveal that spatial variations of TC activity associated with the MJO dur-ing extreme ENSO events are dependent upon the in-terannual shift in the major genesis location. However, the spatial variations for neutral years have nearly the
same magnitude as those for all years, indicating that those are characteristic signals induced by the intrasea-sonal propagation of the MJO, rather than a merely intraseasonal manifestation of ENSO-related ones.
5. Discussion
Intraseasonal variations of the location of TC genesis associated with the MJO are reminiscent of interannual variations associated with ENSO. While the latter shows a northwest–southeast oriented axis of variations in terms of the location of TC genesis (see Figs. 12a and 12f), the former shows a seesawlike moving axis (see Fig. 4). On this score, variations of TC genesis associ-ated with the MJO differ from those associassoci-ated with ENSO.
East–west oriented variations of the density of TC tracks appear on an interannual time scale associated with ENSO as well as on an intraseasonal time scale associated with the MJO, especially during JJ and au-tumn (Wu and Wang 2004; Fudeyasu et al. 2006). How-ever, the variations associated with ENSO are less clear than those associated with the MJO during AS (Fude-yasu et al. 2006).
A remarkable contrast is revealed in terms of the statistics of TC landfalls. Deterministic large-scale steering circulations that control TC landfall in Korea and Japan are induced by the MJO rather than by ENSO, seeing that a robust and significant modulation in the number of TC landfalls is observed in Korea, rather weakly, and also in Japan, but is not observed in landfalling statistics associated with ENSO. Interannual variations of the number of TC landfalls in Korea and Japan may be better controlled by those of the zonally oriented quasi-stationary Rossby wave train along the summer-mean jet stream than by ENSO (Kim et al. 2005b).
Systematic variations in the degree of clustering of TC tracks according to the MJO category is associated TABLE3. Statistics of the number of days and TC geneses in El Niño (E), La Niña (L), and neutral (N) years for which the MJO is in a particular category. For the number of days, a percentage of the total number of days is shown in parentheses. For the number of TC geneses, a percentage daily genesis rate (defined by the percentage of the genesis number of the number of days for each category) is shown in parentheses. The categories where TC numbers are significantly above (below) climatology at the 90%, 95%, and 99% confidence levels are indicated by an asterisk (cross) [* (†)], double asterisks (crosses) [** (††)], or triple asterisks (crosses) [*** (†††)], respectively. Category A B C Period E L N E L N E L N Whole summer MJO days 128 (15.0) 63 (17.2) 339 (17.4) 168 (19.7) 50 (13.7) 295 (15.1) 141 (16.5) 67 (18.3) 298 (15.3) Geneses 11 (8.6)† 2 (3.2)†† 35 (10.3) 20 (11.9) 5 (10.0) 40 (13.6) 30 (21.3)** 7 (10.4) 44 (14.8)
with the monsoon trough–WNPSH covariability on an intraseasonal time scale, which was presented in Harr and Elsberry (1991, 1995). As illustrated in Figs. 2 and 9, the northward propagation of MJO-related convec-tion and circulaconvec-tion anomalies in the monsoon trough region possibly influences the outer trough region by Rossby wave emanation such that the WNPSH may expand or shrink; this leads to distinct TC tracks and landfalls divided on the basis of the four MJO catego-ries, as discussed in section 3.
Although we have not discussed the period of weak MJO activity (category NONE) in detail, it contributes a significant portion of the total number of TC geneses as well as the landfalling statistics (e.g., Fig. 4 and Table 2), suggesting that the MJO is merely one modulating factor among many factors with different space and time scales. In this regard, one of the conclusions of Liebmann et al. (1994) is appropriate—that TC activity is also modulated by an intraseasonal variability that is a completely independent band from the MJO. This other intraseasonal variability may be related to the submonthly oscillation, which may consist of a 10–25-day intraseasonal oscillation (e.g., Fukutomi and Yasu-nari 1999) and several known tropical waves such as the equatorial Rossby waves, MRG waves, TD-type waves, and so on (e.g., Lau and Lau 1990; Takayabu and Nitta 1993; Wheeler and Kiladis 1999; Frank and Roundy 2006). The latter waves having higher frequencies and westward-propagating properties are found to be closely related to variations of TC activity (e.g., Chang et al. 1996; Dickinson and Molinari 2002; Bessafi and Wheeler 2006; Frank and Roundy 2006).
Clustering of TC genesis within the MJO-related convective region is observed when the MJO-related convection center is found in the WNP. This introduces a probable hypothesis that there are more chances of TCs being generated by means of Rossby wave disper-sion in the wake of a preexisting TC (e.g., Sobel and Bretherton 1999; Li et al. 2003; Li and Fu 2006). One
case that may support this hypothesis is the TC activity in June 2004, during which there were five successive TC geneses within the strong MJO convective envelope (Kim et al. 2005a; Nakazawa 2006). Further studies are necessary to prove this hypothesis.
Another important issue is that these higher-fre-quency signals also interact with the larger space-scale and longer time-scale variability, such as the MJO (e.g., Matthews and Kiladis 1999; Straub and Kiladis 2003). As noted in Straub and Kiladis (2003), there are evi-dently periods when this mechanism is activated. From this viewpoint, nonlinear scale interaction processes within monsoon environments, as discussed by Holland (1995), are insightful. The results of this study may also implicitly suggest this issue. Based on the fact that there are a large number of TCs in each MJO category, the signal of TCs may also contribute a significant portion of the intraseasonal convection and circulation behav-ior. In other words, scale interaction is the most critical function for summertime climate variability in the WNP.
Acknowledgments. This study was funded by the
Ko-rea Meteorological Administration Research and De-velopment Program under Grant CATER 2006–4204. JHK and HSK were also supported by the Brain Korea 21 (BK21) Project in 2007. CHS was supported by the National Sciences Council in Taiwan under Grants NSC 093-2111-M-008-002 and NSC 094-2111-M-008-008. Part of this work was carried out by JHK in Taiwan during the period of 1 March 2005–31 March 2006 and was supported by the same NSC grants. The authors are grateful to three anonymous reviewers. Their helpful comments and suggestions led this study to a publish-able work.
REFERENCES
Aiyyer, A. R., and J. Molinari, 2003: Evolution of mixed Rossby– gravity waves in idealized MJO environments. J. Atmos. Sci.,
60, 2837–2855. TABLE3. (Extended) Category TOTAL D NONE Period E L N E L N E L N 147 (17.2) 62 (16.9) 279 (14.3) 270 (31.6) 124 (33.9) 741 (38.0) 854 (100.0) 366 (100.0) 1952 (100.0) 23 (15.6) 8 (12.9) 41 (14.7) 37 (13.7) 23 (18.5)** 87 (11.7) 121 (14.2) 45 (12.3) 247 (12.7)
Bergman, J. W., H. H. Hendon, and K. M. Weickmann, 2001: In-traseasonal air–sea interactions at the onset of El Niño. J.
Climate, 14, 1702–1719.
Bessafi, M., and M. C. Wheeler, 2006: Modulation of south Indian Ocean tropical cyclones by the Madden–Julian oscillation and convectively coupled equatorial waves. Mon. Wea. Rev.,
134, 638–656.
Briegel, L. M., and W. M. Frank, 1997: Large-scale influences on tropical cyclogenesis in the western North Pacific. Mon. Wea.
Rev., 125, 1397–1413.
Camargo, S. J., and A. H. Sobel, 2005: Western North Pacific tropical cyclone intensity and ENSO. J. Climate, 18, 2996– 3006.
——, A. W. Robertson, S. J. Gaffney, P. Smyth, and M. Ghil, 2007: Cluster analysis of typhoon tracks. Part II: Large-scale circulation and ENSO. J. Climate, 20, 3654–3676.
Chan, J. C. L., and W. M. Gray, 1982: Tropical cyclone movement and surrounding flow relationships. Mon. Wea. Rev., 110, 1354–1374.
Chang, C.-P., J. M. Chen, P. A. Harr, and L. E. Carr, 1996: North-westward-propagating wave patterns over the tropical west-ern North Pacific during summer. Mon. Wea. Rev., 124, 2245– 2266.
Chia, H.-H., and C. F. Ropelewski, 2002: The interannual vari-ability in the genesis location of tropical cyclones in the northwest Pacific. J. Climate, 15, 2934–2944.
Delk, T. L., 2004: Intraseasonal, large-scale circulations and tropi-cal cyclone activity over the western North Pacific during boreal summer. M.S. thesis, Department of Meteorology, Na-val Postgraduate School, Monterey, CA, 76 pp.
Dickinson, M., and J. Molinari, 2002: Mixed Rossby–gravity waves and western Pacific tropical cyclogenesis. Part I: Syn-optic evolution. J. Atmos. Sci., 59, 2183–2196.
Elsner, J. B., and K.-B. Liu, 2003: Examining the ENSO–typhoon hypothesis. Climate Res., 25, 43–54.
Frank, W. M., and P. E. Roundy, 2006: The role of tropical waves in tropical cyclogenesis. Mon. Wea. Rev., 134, 2397–2417. Fudeyasu, H., S. Iizuka, and T. Matsuura, 2006: Impact of ENSO
on landfall characteristics of tropical cyclones over the west-ern North Pacific during the summer monsoon season.
Geo-phys. Res. Lett., 33, L21815, doi:10.1029/2006GL027449.
Fukutomi, Y., and T. Yasunari, 1999: 10–25 day intraseasonal variations of convection and circulation over East Asia and western North Pacific during early summer. J. Meteor. Soc.
Japan, 77, 753–769.
Gray, W. M., 1979: Hurricanes: Their formation, structure and likely role in the tropical circulation. Meteorology over the
Tropical Oceans, D. B. Shaw, Ed., Royal Meteorological
So-ciety, 155–218.
Hall, J. D., A. J. Matthews, and D. J. Karoly, 2001: The modula-tion of tropical cyclone activity in the Australian region by the Madden–Julian oscillation. Mon. Wea. Rev., 129, 2970– 2982.
Harr, P. A., 2006: Temporal clustering of tropical cyclone occur-rence on intraseasonal time scales. Preprints, 27th Conf. on
Hurricanes and Tropical Meteorology, Monterey, CA, Amer.
Meteor. Soc., 3D.2.
——, and R. L. Elsberry, 1991: Tropical cyclone track character-istics as a function of large-scale circulation anomalies. Mon.
Wea. Rev., 119, 1448–1468.
——, and ——, 1995: Large-scale circulation variability over the tropical western North Pacific. Part I: Spatial patterns and
tropical cyclone characteristics. Mon. Wea. Rev., 123, 1225– 1246.
Hartmann, D. L., and E. D. Maloney, 2001: The Madden–Julian oscillation, barotropic dynamics, and North Pacific tropical cyclone formation. Part II: Stochastic barotropic modeling. J.
Atmos. Sci., 58, 2559–2570.
——, M. L. Michelsen, and S. A. Klein, 1992: Seasonal variations of tropical intraseasonal oscillations: A 20–25-day oscillation in the western Pacific. J. Atmos. Sci., 49, 1277–1289. Hayashi, Y., 1971: A generalized method of resolving
distur-bances into progressive and retrogressive waves by space Fourier and time cross-spectral analyses. J. Meteor. Soc.
Ja-pan, 49, 125–128.
Ho, C.-H., J.-J. Baik, J.-H. Kim, D.-Y. Gong, and C.-H. Sui, 2004: Interdecadal changes in summertime typhoon tracks. J.
Cli-mate, 17, 1767–1776.
——, J.-H. Kim, H.-S. Kim, C.-H. Sui, and D.-Y. Gong, 2005: Possible influence of the Antarctic Oscillation on tropical cyclone activity in the western North Pacific. J. Geophys.
Res., 110, D19104, doi:10.1029/2005JD005766.
——, ——, J.-H. Jeong, H.-S. Kim, and D. Chen, 2006: Variation of tropical cyclone activity in the south Indian Ocean: El Niño–Southern Oscillation and Madden–Julian oscillation ef-fects. J. Geophys. Res., 111, D22101, doi:10.1029/2006JD007289. Holland, G. J., 1995: Scale interaction in the western Pacific
mon-soon. Meteor. Atmos. Phys., 56, 57–79.
Jeong, J.-H., C.-H. Ho, B.-M. Kim, and W.-T. Kwon, 2005: Influ-ence of the Madden–Julian oscillation on wintertime surface air temperature and cold surges in east Asia. J. Geophys.
Res., 110, D11104, doi:10.1029/2004JD005408.
——, B.-M. Kim, C.-H. Ho, and Y.-H. Noh, 2008: Systematic variation in wintertime precipitation in East Asia by MJO-induced extratropical vertical motion. J. Climate, 21, 788–801. Kalnay, E., and Coauthors, 1996: The NCEP/NCAR 40-Year
Re-analysis Project. Bull. Amer. Meteor. Soc., 77, 437–471. Kemball-Cook, S., and B. Wang, 2001: Equatorial waves and air–
sea interaction in the boreal summer intraseasonal oscilla-tion. J. Climate, 14, 2923–2942.
Kim, J.-H., C.-H. Ho, and C.-H. Sui, 2005a: Circulation features associated with the record-breaking typhoon landfall on Ja-pan in 2004. Geophys. Res. Lett., 32, L14713, doi:10.1029/ 2005GL022494.
——, ——, ——, and S. K. Park, 2005b: Dipole structure of inter-annual variations in summertime tropical cyclone activity over East Asia. J. Climate, 18, 5344–5356.
Kindle, J. C., and P. A. Phoebus, 1995: The ocean response to operational westerly wind bursts during the 1991–1992 El Niño. J. Geophys. Res., 100, 4893–4920.
Ko, K.-C., and H.-H. Hsu, 2006: Sub-monthly circulation features associated with tropical cyclone tracks over the East Asian monsoon area during July–August season. J. Meteor. Soc.
Japan, 84, 871–889.
Kuo, H.-C., J.-H. Chen, R. T. Williams, and C.-P. Chang, 2001: Rossby waves in zonally opposing mean flow: Behavior in northwest Pacific summer monsoon. J. Atmos. Sci., 58, 1035– 1050.
Lau, K.-H., and N.-C. Lau, 1990: Observed structure and propa-gation characteristics of tropical summertime synoptic-scale disturbances. Mon. Wea. Rev., 118, 1888–1913.
Lawrence, D. M., and P. J. Webster, 2002: The boreal summer intraseasonal oscillation: Relationship between northward and eastward movement of convection. J. Atmos. Sci., 59, 1593–1606.
Li, T., and B. Fu, 2006: Tropical cyclogenesis associated with Rossby wave energy dispersion of a preexisting typhoon. Part I: Satellite data analyses. J. Atmos. Sci., 63, 1377–1389. ——, ——, X. Ge, B. Wang, and M. Peng, 2003: Satellite data
analysis and numerical simulation of tropical cyclone formation.
Geophys. Res. Lett., 30, 2122, doi:10.1029/2003GL018556.
Liebmann, B., and C. A. Smith, 1996: Description of complete (interpolated) outgoing longwave radiation data set. Bull.
Amer. Meteor. Soc., 77, 1275–1277.
——, H. H. Hendon, and J. D. Glick, 1994: The relationship be-tween tropical cyclones of the western Pacific and Indian Oceans and the Madden–Julian oscillation. J. Meteor. Soc.
Japan, 72, 401–411.
Liu, K. S., and J. C. L. Chan, 2003: Climatological characteristics and seasonal forecasting of tropical cyclones making landfall along the south China coast. Mon. Wea. Rev., 131, 1650–1662. Madden, R. A., and P. R. Julian, 1971: Detection of a 40–50 day oscillation in the zonal wind in the tropical Pacific. J. Atmos.
Sci., 28, 702–708.
Maloney, E. D., and D. L. Hartmann, 2000a: Modulation of east-ern North Pacific hurricane by the Madden–Julian oscilla-tion. J. Climate, 13, 1451–1460.
——, and ——, 2000b: Modulation of hurricane activity in the Gulf of Mexico by the Madden–Julian oscillation. Science,
287, 2002–2004.
——, and ——, 2001: The Madden–Julian oscillation, barotropic dynamics, and North Pacific tropical cyclone formation. Part I: Observations. J. Atmos. Sci., 58, 2545–2558.
——, and M. J. Dickinson, 2003: The intraseasonal oscillation and the energetics of summertime tropical western North Pacific synoptic-scale disturbances. J. Atmos. Sci., 60, 2153–2168. Matthews, A. J., 2000: Propagation mechanisms for the Madden–
Julian oscillation. Quart. J. Roy. Meteor. Soc., 126, 2637–2652. ——, and G. N. Kiladis, 1999: The tropical–extratropical interac-tion between high-frequency transients and the Madden– Julian oscillation. Mon. Wea. Rev., 127, 661–677.
McPhaden, M. J., 2004: Evolution of the 2002–03 El Niño. Bull.
Amer. Meteor. Soc., 85, 677–695.
Molinari, J., and D. Vollaro, 2000: Planetary- and synoptic-scale influences on eastern Pacific tropical cyclogenesis. Mon. Wea.
Rev., 128, 3296–3307.
——, D. Knight, M. Dickinson, D. Vollaro, and S. Skubis, 1997: Potential vorticity, easterly waves, and eastern Pacific tropi-cal cyclogenesis. Mon. Wea. Rev., 125, 2699–2708.
Nakazawa, T., 1986: Intraseasonal variations of OLR in the Trop-ics during the FGGE year. J. Meteor. Soc. Japan, 64, 17–34. ——, 2006: Madden–Julian oscillation activity and typhoon land-fall on Japan in 2004. Sci. Online Lett. Atmos., 2, 136–139.
Ritchie, E. A., and G. J. Holland, 1999: Large-scale patterns as-sociated with tropical cyclogenesis in the western Pacific.
Mon. Wea. Rev., 127, 2027–2043.
Saunders, M. A., R. E. Chandler, C. J. Merchant, and F. P. Rob-erts, 2000: Atlantic hurricanes and NW Pacific typhoons: ENSO spatial impacts on occurrence and landfall. Geophys.
Res. Lett., 27, 1147–1150.
Smith, T. M., and R. W. Reynolds, 2004: Improved extended re-construction of SST (1854–1997). J. Climate, 17, 2466–2477. Sobel, A. H., and C. S. Bretherton, 1999: Development of
synop-tic-scale disturbances over the summertime tropical north-west Pacific. J. Atmos. Sci., 56, 3106–3127.
——, and E. D. Maloney, 2000: Effect of ENSO and the MJO on western North Pacific tropical cyclones. Geophys. Res. Lett.,
27, 1739–1742.
Straub, K. H., and G. N. Kiladis, 2003: Interactions between the boreal summer intraseasonal oscillation and higher-frequency tropical wave activity. Mon. Wea. Rev., 131, 945– 960.
Takayabu, Y. N., and T. Nitta, 1993: 3–5-day period disturbances coupled with convection over the tropical Pacific Ocean. J.
Meteor. Soc. Japan, 71, 221–246.
Wang, B., and H. Rui, 1990: Synoptic climatology of transient tropical intraseasonal convection anomalies: 1975–1985.
Me-teor. Atmos. Phys., 44, 43–61.
——, and J. C. L. Chan, 2002: How strong ENSO events affect tropical storm activity over the western North Pacific. J.
Cli-mate, 15, 1643–1658.
Wang, C., and R. H. Weisberg, 2000: The 1997–98 El Niño evo-lution relative to previous El Niño events. J. Climate, 13, 488–501.
Wheeler, M. C., and G. N. Kiladis, 1999: Convectively coupled equatorial waves: Analysis of clouds and temperature in the wavenumber–frequency domain. J. Atmos. Sci., 56, 374–399. ——, and H. H. Hendon, 2004: An all-season real-time multivari-ate MJO index: Development of an index for monitoring and prediction. Mon. Wea. Rev., 132, 1917–1932.
Wu, L., and B. Wang, 2004: Assessing impacts of global warming on tropical cyclone tracks. J. Climate, 17, 1686–1698. Wu, M. C., W. L. Chang, and W. M. Leung, 2004: Impacts of El
Niño–Southern Oscillation events on tropical cyclone land-falling activity in the western North Pacific. J. Climate, 17, 1419–1428.
Zhang, C., 2005: Madden–Julian oscillation. Rev. Geophys., 43, RG2003, doi:10.1029/2004RG000158.
——, and H. H. Hendon, 1997: On propagating and stationary components of the intraseasonal oscillation in tropical con-vection. J. Atmos. Sci., 54, 741–752.