of microalgal hydrolysate
on bioethanol production
Gyeongho Seon
1, Hee Su Kim
2, Jun Muk Cho
1, Minsik Kim
1, Won‑Kun Park
3*&
Yong Keun Chang
1,4*Microalgae accumulate abundant lipids and are a promising source for biodiesel. However,
carbohydrates account for 40% of microalgal biomass, an important consideration when using them for the economically feasible production of biodiesel. In this study, different acid hydrolysis and post‑treatment processing of Chlorella sp. ABC‑001 was performed, and the effect of these different hydrolysates on bioethanol yield by Saccharomyces cerevisiae KL17 was evaluated. For hydrolysis using H2So4, the neutralization using Ca(OH)2 led to a higher yield (0.43 g ethanol/g sugars) than NaOH (0.27 g ethanol/g sugars). Application of electrodialysis to the H2So4 + NaOH hydrolysate increased the yield to 0.35 g ethanol/g sugars, and K+ supplementation further enhanced the yield to 0.41 g ethanol/g sugars. Hydrolysis using HNO3 led to the generation of reactive species. Neutralization using only NaOH yielded 0.02 g ethanol/g sugars, and electrodialysis provided only a slight enhancement (0.06 g ethanol/g sugars). However, lowering the levels of reactive species further increased the yield to 0.25 g ethanol/g sugars, and K+ supplementation increased the yield to 0.35 g ethanol/g sugars. Overall, hydrolysis using H2So4 + Ca(OH)2 provided the highest ethanol yield, and the yield was almost same as from conventional medium. This research emphasizes the importance of post‑treatment processing that is modified for the species or strains used for bioethanol fermentation. The worldwide problem of climate change and global warming has spotlighted the need for research on the use of biomass for the production of biofuels1,2. Microalgal biomass has significant potential for use in biofuel
production because microalgae have high biomass productivity per unit area, their growth does not compete with food crops and is carbon–neutral, and they accumulate abundant lipids3,4. Despite the many advantages
of microalgal lipids for the production of biofuels, the economic feasibility and industrialization of microalgal biofuel production require further developments4.
A possible breakthrough is the conversion of the other cellular components of microalgae into valuable materials5. Carbohydrates are among the candidates for biorefineries. Microalgal carbohydrates mostly occur
as starch and cellulose and can account for up to 40% of the dry cell weight (DCW) of microalgae6,7. Treatment
of these carbohydrates with hydrolysis or other procedures can produce more valuable carbohydrates4. The
ole-aginous microalgae, which are considered most suitable for biofuel production, consist of 30 to 60% lipids and 30 to 50% carbohydrates. Therefore, there is a need for a strategy that uses carbohydrate residue after producing biofuels8–10. However, the chemical treatment of these carbohydrates to produce edible value-added carbohydrate
products may also produce undesirable contaminants due to the adverse effects of organic solvents11,12. Therefore,
utilization of these microalgal carbohydrates as a source for microbial fermentation medium has been limited to ethanol production13,14, although there is a need for more progress in this area.
In contrast to the lignocellulosic biomass from land plants, microalgae have no lignin (which requires harsh chemical conditions for hydrolysis) and therefore generate little or no toxic compounds during hydrolysis9,15. For
this reason, hydrolysis of microalgal carbohydrates to produce fermentable sugars, and use of these sugars for fermentation by microorganisms to produce value-added products could be an effective approach for enhancing the economic feasibility of the microalgal biofuel industry.
1Department of Chemical and Biomolecular Engineering, Korea Advanced Institute of Science and Technology
(KAIST), Daejeon 34141, Republic of Korea. 2Daegu Center, Korea Basic Science Institute (KBSI), 80 Daehak-ro,
Daegu 41566, Republic of Korea. 3Department of Chemistry and Energy Engineering, Sangmyung University,
Seoul 03016, Republic of Korea. 4Advanced Biomass R&D Center, Daejeon 34141, Republic of Korea. *email:
Previous research has mainly used acids and enzymatic catalysts for the hydrolysis of microalgae because these methods provide high production of monosaccharides14,16. Although enzymatic hydrolysis can produce a
higher monosaccharide yield and selectivity for cell walls and starch, it is difficult to use enzymes as an industrial process because of their high cost and slow rates of hydrolysis14. On the contrary, acid hydrolysis is rapid and
inexpensive17 and is therefore most suitable for the large-scale industrial hydrolysis of carbohydrates. However,
there are several important considerations when using acid hydrolysis: the low pH, the degradation of sugars, and the production of compounds that inhibit microbial growth following neutralization13. Thus, it is necessary
to optimize the acid hydrolysis and post-hydrolysis treatments18,19.
The optimization procedure typically considers different types of acids, different acid concentrations, and different reaction times needed to achieve the maximum yield of fermentable sugars and the lowest yield of compounds that inhibit microbial growth. For example, in the case of Chlorella sp. KR-1 biomass, addition of 0.3 N HCl at 121 °C for 15 min saccharified 98.2% of carbohydrates into mono-sugars, and the yield decreased when 1 N HCl was used20. A high acid concentration causes oxidation of sugars due to excessive hydrolysis, and
generates organic acids or 5-hydroxymethylfurfural (HMF), which can inhibit growth9. Moreover, hydrolysis
yields can differ among algal species when using the same hydrolysis conditions21. Therefore, the specific
meth-ods of acid hydrolysis must be optimized for different microalgal strains or species and the microbes used for fermentation. Post-hydrolysis procedures must consider which alkali to use for neutralization and control for salt additions during hydrolysis and neutralization. Some salts are necessary for microbial cell growth, and these should be considered when selecting the acid and alkali13. However, excessive salts can inhibit microbial growth
by generating osmotic shock or the production of chemically reactive species22,23. Therefore, several studies have
used electrodialysis (ED) to control the salt content of hydrolysates that were subjected to acid hydrolysis13.
In this study, the promising microalga Chlorella sp. ABC-001, which was recently isolated from a thermal power plant at Youngwol, Korea, was used for hydrolysis and the production of fermentable sugars. The effects of hydrolysis using H2SO4 and HNO3 at different concentrations and reaction times on the production of the
fermentable sugars and growth inhibitors were examined. Then, the effects of post-treatment processing (neu-tralization and control of salt content) with precipitation and electrodialysis (ED) on the ethanol yield of Sac‑
charomyces cerevisiae KL17 grown in the different hydrolysates were investigated. The effects of major salts and
supplementation were also determined.
Results and discussion
Chemical composition of Chlorella sp. ABC‑001.
The growing number of industries that produce microalga-based value-added products and biofuels has created an urgent need for methods that can efficiently manage microalgal residues24. Thus, the effect of using different hydrolysate residues from Chlorella sp.ABC-001 to promote fermentation and ethanol production by S. cerevisiae KL17 was examined. This recently isolated microalga was confirmed as an ideal strain for the capture of CO2 and the utilization of cooling water from a
power generation facility, because of its excellent growth rate at high concentrations of CO2 (up to 10%) and salt
(up to 35 g/L), and at a relatively high temperature (35 °C)25,26.
The chemical composition of Chlorella sp. ABC-001 indicated the presence of abundant lipids (39.4% DCW), making this strain a highly suitable as a source of biofuel (Table 1). Fermentable and non-fermentable carbohy-drates accounted for 39.1% of DCW, protein for 13.9%, and inorganic ash for 7.4%. Analysis of the fermentable monosaccharides indicated abundant glucose (67.8%), galactose (16.9%), and mannose (9.1%), all of which can be used by S. cerevisiae KL17 for ethanol production27,28. Compared with other microalgae (Table A.1), Chlorella Table 1. Chemical composition of Chlorella sp. ABC-001.
Macro-molecules % DCW Carbohydrates 39.1 ± 0.61 Lipids 39.4 ± 2.63 Proteins 13.9 ± 0.14 Inorganic ash 7.4 ± 0.32 Monosaccharides % DCW Glucose 67.8 ± 4.27 Rhamnose 16.9 ± 0.13 Galactose 9.1 ± 0.23 Mannose 3.4 ± 0.32 Xylose 2.1 ± 0.18 Others 0.7 ± 0.27 Elements % DCW C 52.4 ± 0.13 H 7.8 ± 0.01 N 2.9 ± 0.03 S 0.3 ± 0.02 O 30.5 ± 0.07
sp. ABC-001 has greater potential for use as a source of carbon biomass and biofuel because of its much higher levels of lipids and carbohydrates.
Dilute acid hydrolysis of Chlorella sp. ABC‑001.
Because Chlorella sp. ABC-001 has abundant carbo-hydrates, the optimal procedure for acid hydrolysis was determined. Numerous acids can effectively hydrolyze microalgal biomass, but some acids, such as hydrochloric acid and phosphoric acid, are unsuitable. Hydrochloric acid is highly toxic, volatile, corrosive, and difficult to use at an industrial-scale29; phosphoric acid is a triproticacid that generally produces a low sugar yield in the hydrolysis of microalgae13. H
2SO4 and HNO3 are therefore
often used for the hydrolysis of microalgal biomass6,9,30.
First, the effects of different acids (H2SO4 and HNO3), acid concentrations (0.5 to 2 N), and reaction times
(0 to 300 min) on the sugar production by hydrolysis of microalgal biomass were determined (Fig. 1). For each acid, when the concentration was 2 N, the initial rate of sugar production was more rapid and the maximum was achieved more rapidly, but the sugar concentration declined slightly for long reaction times (2 N H2SO4: 16.7 g/L
at 90 min and 15.1 g/L at 300 min; 2 N HNO3: 16.2 g/L at 30 min and 13.6 g/L at 300 min).
Use of 1 N H2SO4 led to a more gradual increase of sugar concentration to 17.0 g/L, and this level was
main-tained for 300 min. Similarly, use of 1 N HNO3 led to a gradual increase of sugar concentration to 16.4 g/L, and
this level was maintained for 300 min. Use of 0.5 N H2SO4 or HNO3 led to slower increases of sugar
concentra-tion (16.7 and 15.1 g/L, respectively) at 300 min. Considering that a concentraconcentra-tion of 0.5 N was not sufficient to hydrolyze all the carbohydrates and a concentration of 2 N led to a decreased amount of total sugars and the need to use additional alkali for the neutralization, a concentration of 1 N was chosen for both acids. In addi-tion, because there were no compositional changes in the total fermentable sugars when hydrolyzed by H2SO4
or HNO3 (Fig. A1), a reaction time of 150 min was selected.
In all cases, there were no detectable levels of HMF or organic acids produced during acid hydrolysis, com-pounds known to inhibit ethanol fermentation. The decrease of sugars caused by prolonged hydrolysis at high acid concentrations could be attributable to the Maillard reaction, in which reducing sugars react with amino acids to form a brown-colored complex, a reaction known to be promoted by high acid concentrations31,32. Figure 1. Time course of carbohydrate hydrolysis of Chlorella sp. ABC-001 in different concentrations of H2SO4
Although temperature is normally considered more important than acidity in promoting this reaction32, the
pro-duction of amino acids by protein hydrolysis can occur in the harsh conditions used for carbohydrate hydrolysis33.
Thus, for subsequent experiments, an acid concentration of 1 N and a hydrolysis time of 150 min was used. For H2SO4, this treatment led to a sugar concentration of 17.0 g/L (86.7% total carbohydrate) and 13.5 g/L
fer-mentable sugars. For HNO3, this treatment led to a sugar concentration of 16.3 g/L (83.2% total carbohydrate)
and 13.2 g/L fermentable sugars.
Post‑treatment processing of Chlorella sp. ABC‑001 hydrolysate.
Although the hydrolysates pro-duced from H2SO4 and HNO3 contained abundant fermentable sugars, these hydrolysates must be neutralizedbefore yeast cultivation because of their high acidity. Various alkalis can be used for neutralization, but these generate different salts that could adversely affect fermentation. NaOH is generally used for neutralization of microalgal hydrolysate17,34. Ca(OH)
2 is also suitable following H2SO4 hydrolysis because it neutralizes the
hydro-lysate and the Ca2+ removes SO
42− due to CaSO4 precipitation18,19. Therefore, the effects of neutralization using
NaOH or Ca(OH)2 on subsequent yeast fermentation were examined and compared with the results in which
neutralization was achieved by precipitation or ED.
A H2SO4 hydrolysate can be neutralized using Ca(OH)2 or NaOH. When Ca(OH)2 is used, CaSO4 precipitates
and there is no need for ED. However, when NaOH is used, the H2SO4 generates Na+ and SO42− and these must
be treated or removed. Although S. cerevisiae has a relatively high salt tolerance23, a growth medium with high
concentrations of salts negatively impacts fermentation13. HNO
3 hydrolysate does not form a precipitate when
treated with Ca(OH)2. Therefore, only NaOH and ED were used to prepare these hydrolysates.
First, the effect of ED time on the conductivity of different hydrolysate solutions was examined (Fig. A2). Immediately after neutralization using NaOH, the conductivities of the H2SO4 and HNO3 hydrolysates were
57.7 and 68.0 mS/cm, respectively. ED ultimately reduced the conductivity of both hydrolysates to 5 mS/cm, the same as YPD medium. Because the SO42− is larger than NO3− and close to the molecular cut-off size of the
ED membrane, the time for ED processing of the H2SO4 hydrolysate was longer. The ED procedure efficiently
removed Na2+, SO
42−, and NO3− but did not remove sugars from the hydrolysate.
Ethanol production using Chlorella sp. ABC‑001 hydrolysate as a growth medium.
Fermenta‑ tion of Chlorella sp. ABC‑001 hydrolysates. Next, the effect of using the different microalgal hydrolysates assubstrates for bioethanol production by S. cerevisiae KL17 was examined. In these experiments, different hydro-lysates were used as the sole culture medium and compared with YPD medium (control). S. cerevisiae KL17 was selected because it can ferment multiple sugars (including glucose, galactose, and mannose) that are present in the microalgal hydrolysate27 (Table 1).
First, cell growth, sugar consumption, and ethanol production by S. cerevisiae KL17 were examined using five different hydrolysates and YPD medium (Fig. 2). Most of the hydrolysates led to significantly reduced cell accumulation compared to YPD medium (3.47 g/L at 11 h, Fig. 2a). The H2SO4 + Ca(OH)2 hydrolysate
provided the best result (3.06 g/L at 11 h), followed by the H2SO4 + NaOH hydrolysate (1.11 g/L at 11 h). The
HNO3 + NaOH hydrolysates led to almost no growth (0.10 g/L at 11 h). In addition, ED clearly increased cell
growth at 11 h (1.80 g/L for H2SO4 + NaOH + ED: 62.6% increase; 0.32 g/L for HNO3 + NaOH + ED: 321.6%
increase). These results indicate that ED improved the fermentation of hydrolysates (presumably by removal of growth inhibitory compounds) and that the HNO3 hydrolysate contained growth inhibitory compounds that
were not removed by ED.
Each acid hydrolysate had about 13.5 g/L of fermentable sugars, the same amount used in the YPD medium. However, the consumption of fermentable sugars differed markedly among the different treatments (Fig. 2b). The fastest consumption was in the YPD (control) medium and the H2SO4 + Ca(OH)2 (1.69 g/L/h) hydrolysate,
and the yeast consumed all fermentable sugars by 8 h in these media. The third fastest consumption was in the H2SO4 + NaOH + ED hydrolysate, and the yeast consumed all fermentable sugars by 11 h in this medium.
How-ever, after 11 h, yeast consumed only 63.0% of sugars in the H2SO4 + NaOH hydrolysate, only 21.4% of sugars in
the HNO3 + NaOH + ED hydrolysate, and only 11.6% of sugars in the HNO3 + NaOH hydrolysate. As expected,
these data show that growth media that led to greater sugar consumption also led to greater cell growth. Also as expected, the measurements of ethanol yield indicated that growth media which supported greater cell growth and sugar consumption also led to greater ethanol production (Fig. 2c). In particular, the YPD and H2SO4 + Ca(OH)2 groups had maximal production ethanol (6.03 and 5.78 g/L, respectively) at 8 h. At this time,
all the sugars were consumed, and the ethanol yield from growth on YPD and H2SO4 + Ca(OH)2 hydrolysate
were 0.45 and 0.43 g ethanol/g fermentable sugar, respectively. For the other growth media, the ethanol yields were markedly lower, possibly due to the presence of inhibitory factors. The most important finding of these experiments is that the H2SO4 + Ca(OH)2 hydrolysate can function as an effective substitute for conventional
YPD medium for the fermentation of ethanol by S. cerevisiae KL17.
Effect of reactive oxygen and nitrogen species in the HNO3 hydrolysate of Chlorella sp. ABC‑001. S. cerevisiae
generally has a high salt tolerance23 and can be cultivated in acid hydrolysates following alkali treatment without
desalting. Thus, the effects of different hydrolysates on S. cerevisiae fermentation were examined. The possible negative effects of reactive oxygen species, reactive nitrogen species, and cations were investigated. The cell growth experiments indicated that the H2SO4 hydrolysate led to reasonable cell growth, sugar consumption,
and ethanol yield, but the HNO3 hydrolysate did not, even when the salts were removed by ED. Most studies
of the effects of hydrolysates on cell cultures used H2SO4 as the acid catalyst9,17–19. During acid catalysis, HNO3
produces more organic acids than other acids because of its strong oxidizing effect, and these organic acids could possibly inhibit the growth of S. cerevisiae. However, there were no measured organic acids in the HNO3
hydrolysates. Therefore it was hypothesized that HNO3 hydrolysis might have produced reactive oxygen species
(ROS) and reactive nitrogen species (RNS). These reactive species can cause exogenous oxidative and nitrosative stress to cells and even cause cell death22. Although S. cerevisiae has mechanisms that protect from these reactive
species, high concentrations of ROS and RNS are lethal35.
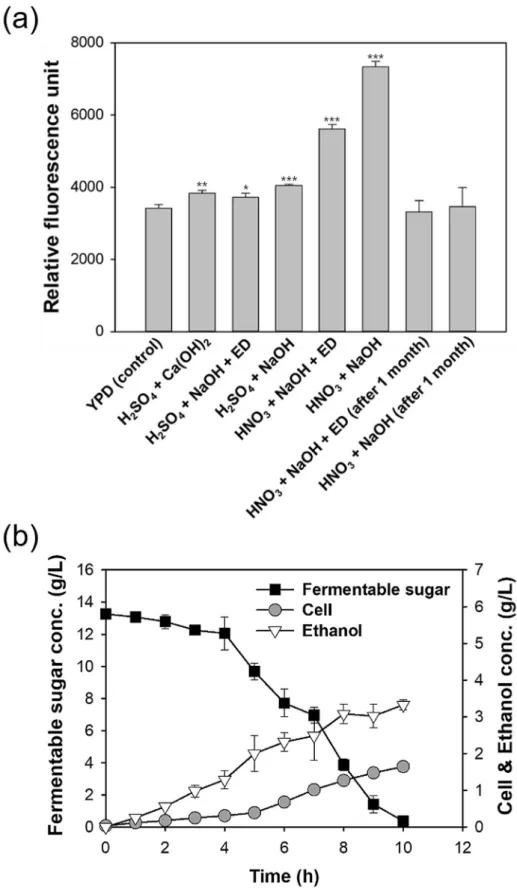
The levels of ROS and RNS were measured using a fluorescence-based assay (Fig. 3a). All H2SO4 hydrolysates
had fluorescence of approximately 4000 relative fluorescence units (RFUs) regardless of the post-treatment, and Figure 2. Time course of cell growth (a), consumption of fermentable sugars (b), and ethanol production (c) in S. cerevisiae KL17 using different Chlorella sp. ABC-001 hydrolysates or YPD. ANOVA tests at 8 h and 11 h indicated significant differences (P < 0.001). Student’s t test indicated significant differences from YPD (control), shown as ***P < 0.001, **P < 0.01, and *P < 0.05.
Figure 3. Total ROS and RNS levels (relative fluorescence units) in different freshly prepared Chlorella sp. ABC-001 hydrolysates and YPD, and in two hydrolysates after storage at 4 °C for 1 month (a) and fermentation (sugar utilization, cell growth, and ethanol production) of S. cerevisiae KL17 grown in 1 month-old
HNO3 + NaOH + ED hydrolysate (b). ANOVA tests for (a) indicated significant differences (P < 0.001). Student’s
this was similar to the level in the YPD medium (3421 RFU). However, the HNO3 hydrolysate had high
fluo-rescence (7333 RFU) and the level remained high (5618 RFU) even after ED. Notably, the fluofluo-rescence declined in both of these hydrolysates to about 3500 RFUs (similar to that with YPD) after storage at 4 °C for 1 month.
Thus, the effect of a HNO3 hydrolysate that was stored at 4 °C for 1 month on fermentation was tested
(Fig. 3b). This medium led to increased cell growth (0.32 vs. 1.64 g/L), sugar consumption (0.26 vs. 1.32 g/L/h), and ethanol yield (0.06 vs. 0.25 g ethanol/g fermentable sugar; Figs. 2 and 3b). These results suggest that the oxidative stress caused by ROS and RNS was partly responsible for the inhibitory effect of HNO3 hydrolysate
on fermentation. However, cell concentration, sugars consumption, and ethanol production were still greater in the H2SO4 + Ca(OH)2 hydrolysate (Fig. 2), suggesting the presence of additional inhibitory factors in the HNO3
hydrolysate.
Effects of depletion of cations in Chlorella sp. ABC‑001 hydrolysates treated by ED. The growth of S. cerevisiae
KL17 in the HNO3 hydrolysate increased when the levels of ROS and RNS were reduced (Figs. 2 and 3). However,
cell and ethanol concentrations remained higher in the H2SO4 + Ca(OH)2 hydrolysates compared with other
hydrolysates that were desalted using ED (Fig. 2). This might be because ED removed certain ions that were essential for yeast growth. In particular, the molecular weight cut-off of the ED membrane allowed small ions to pass through. Thus, ICP-OES was used to measure cation concentrations of the hydrolysates after ED (Fig. 4). When NaOH was used for neutralization and desalting was not applied, the Na+ concentration was higher than
15,000 mg/L. The H2SO4 + Ca(OH)2 hydrolysate (without desalting) had a low Ca2+ concentration (1,825 mg/L)
because of the low solubility of CaSO4. The K+ concentration in the YPD medium was 398 mg/L, and
hydro-lysates treated without ED had K+ concentrations of 450 to 750 mg/L. In contrast, hydrolysates desalted by ED
had less than 40 mg/L of K+. K+ has an important role in multiple cellular processes, including regulation of
intracellular pH, protein synthesis, and cell volume36,37. In addition, growth media with depleted K+ adversely
affects S. cerevisiae growth38. Therefore, the removal of potassium ion by ED in these experiments could be partly
responsible for inhibiting the growth of S. cerevisiae KL17.
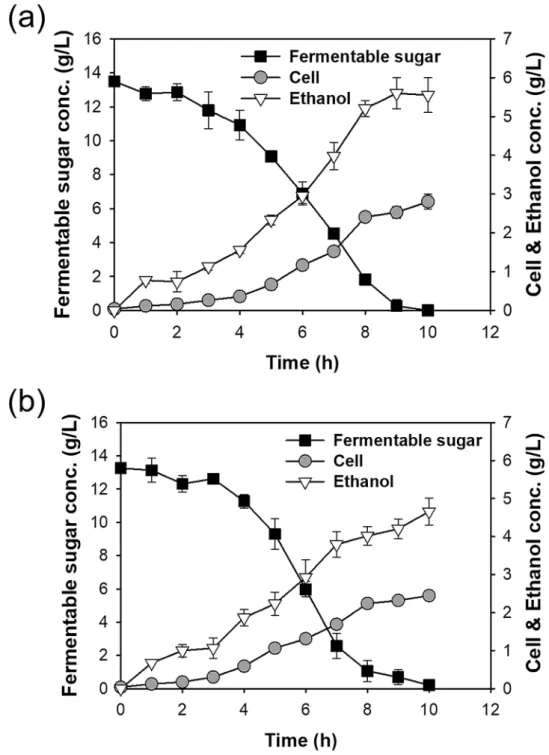
Thus, 1 g/L KCl (524 mg/L K+) was added to the desalted hydrolysate solutions and measured the effect on S.
cerevisiae KL17 fermentation (Fig. 5). When the H2SO4 + NaOH + ED hydrolysate was used, the cell and ethanol
concentrations at 10 h were 1.80 g/L and 4.66 g/L, respectively (Fig. 2). However, addition of 1 g/L KCl to this hydrolysate increased these values to 2.80 g/L and 5.60 g/L, respectively (Fig. 5a). These results are similar to those obtained from the H2SO4 + Ca(OH)2 hydrolysate (3.06 g/L and 5.78 g/L, respectively) (Fig. 2). Addition of 1 g/L
KCl also improved fermentation when using the HNO3 hydrolysate that had reduced ROS and RNS (Fig. 5b).
Therefore, the deletion of K+ by the desalting process appeared to adversely affect fermentation.
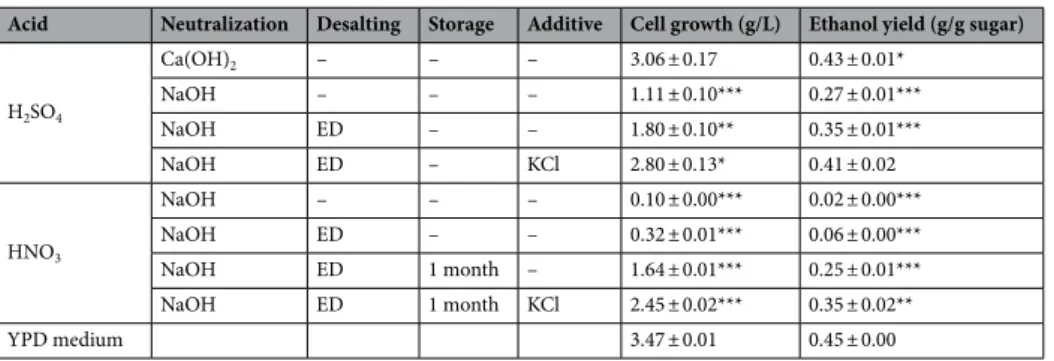
A comparison of the H2SO4 and HNO3 hydrolysates indicated that the fermentation performance depended
on the alkali that was used and the post-treatment processing (Table 2). Initially, only the H2SO4 + Ca(OH)2
hydrolysate provided meaningful growth (3.06 g/L) and ethanol yield (0.43 g ethanol/g sugar). When NaOH as the alkali was used, the hydrolysates from H2SO4 and HNO3 produced remarkably decreased growth (1.11 g/L
for H2SO4 + NaOH) or almost no growth (0.10 g/L for HNO3 + NaOH) and very little ethanol production (0.27
and 0.02 g ethanol/g sugar, respectively). This negative effect was partially reversed by the use of ED with H2SO4
(1.80 g/L and 0.35 g ethanol/g sugar), but not by use of ED with HNO3 (0.32 g/L and 0.06 g ethanol/g sugar). The
reduction of reactive chemical species led to a partial recovery of cell growth and ethanol production (1.64 g/L and 0.25 g ethanol/g sugar).
The effect of KCl supplementation on hydrolysates treated by ED was tested. KCl supplementation clearly increased the growth and ethanol production when the H2SO4 + NaOH + ED hydrolysate was used (2.80 g/L
and 0.41 g ethanol/g sugar), and these values were similar to those achieved by the H2SO4 + Ca(OH)2
hydro-lysate. However, supplementation of the HNO3 + NaOH + ED was less effective (2.45 g/L and 0.35 g ethanol/g
sugar). Overall, the ethanol yield was always greater in the H2SO4 hydrolysates than the HNO3 hydrolysates,
even when KCl was added (Table 2). This result suggests that additional factors in the HNO3 hydrolysates also
inhibit fermentation. Although the effects of many post-treatments were tested, the H2SO4 + Ca(OH)2 hydrolysate
provided optimal production of ethanol, and the results were even comparable to those from YPD medium. However, it seems likely that the optimal hydrolysis conditions and post-treatment processing will differ among Figure 4. Concentrations of cations in different Chlorella sp. ABC-001 hydrolysates. ANOVA tests for cation concentration indicated significant differences (P < 0.001). Student’s t test indicated significant differences from YPD (control), shown as ***P < 0.001 and **P < 0.01.
different strains of microalgae and yeasts. If optimal conditions indicate the use of HNO3, then cost analysis
and techno-economic analysis should compare the benefits from post-treatment processing, such as ED and reducing chemically reactive species.
Conclusion
In this study, the effects of post-treatment processing of a hydrolysate from Chlorella sp. ABC-001 on bioethanol production by Saccharomyces cerevisiae KL17 grown in this hydrolysate was examined. Hydrolysates produced using H2SO4 and HNO3 had similar yields of sugars; however, methods used to neutralize the acids, application
of ED, supplementation of K+, and the control of reactive species led to different bio-ethanol yields. For the
microalga and yeast examined here, a hydrolysate produced by H2SO4 + Ca(OH)2 provided the best yield. These
Figure 5. Fermentation (sugar utilization, cell growth, and ethanol production) of Chlorella sp. ABC-001 hydrolysate from H2SO4 + NaOH + ED + 1 g/L KCl (a) and hydrolysate from HNO3 + NaOH + ED + 1 month
post-treatment processes can easily be varied, and therefore the optimization of post-treatment processing, as well as hydrolysis, is necessary.
Materials and methods
Cell preparation.
The microalga Chlorella sp. ABC-001 was isolated and maintained by the Advanced Bio-mass R&D Center in Daejeon, Korea. The cells were stored in an incubation room (25 °C and continuous light of 120 µmol/m2/s) on N-8 agar plates that contained KNO3 (3 mM), KH2PO4 (5.44 mM), Na2HPO4 (1.83 mM),
MgSO4·7H2O (0.20 mM), CaCl2 (0.12 mM), FeNaEDTA (0.03 mM), ZnSO4·7H2O (0.01 mM), MnCl2·4H2O
(0.07 mM), CuSO4 (0.07 mM), Al2(SO4)3·18H2O (0.01 mM), and Bacto agar (15 g/L)20,39. Immediately before
experiments, cells were activated in the N-8 medium with a 1 L bubble column reactor supplied with 10% (v/v) CO2 under 120 µmol/m2/s at 30 °C. To achieve sufficient biomass, cells were cultivated in a Pyrex 6 L
bubble-column reactor equipped with 12 fluorescent lamps (80 µmol/m2/s) in N-8 medium at 30 °C. In addition, 10%
(v/v) CO2 was supplied to the reactor at a rate of 0.75 L/min40. After 7 days of cultivation, cells were harvested by
centrifugation at 4000 rpm for 1 min, washed with deionized (DI) water, and centrifuged again. Then, cells were lyophilized with a freeze dryer (FD8508, Il Shin Biobase Co., Korea) for 7 days, and the lyophilized cells were stored at − 20 °C prior to analysis. This process was repeated until sufficient microalgal biomass was collected. All lyophilized biomass was mixed evenly before its use in experiments.
Composition of Chlorella sp. ABC‑001 biomass.
The total carbohydrate content of the microalgal bio-mass was determined using the phenol–sulfuric acid method41. In particular, 1 mL of a biomass solution (1 g/L)was mixed with 1 mL phenol (5% by weight), and the solution was added to 5 mL of 72% (by weight) concen-trated H2SO4. The mixture was cooled to room temperature (25 °C) for 30 min in a water bath. The absorbance
of each sample was measured at 490 nm using a spectrophotometer (UV-1800, Shimazu, Japan), and total carbo-hydrate content was calculated based on a glucose standard solution using Eq. (1) (R2 = 0.999):
The analysis of sugar composition used the pre-treatment methods of the National Renewable Energy Laboratory42. First, a 50 mg sample of lyophilized cells was mixed with 0.5 mL of 72% (by weight) H
2SO4 for
30 min at 30 °C, diluted to 4% (by weight) H2SO4, and then autoclaved for 20 min at 121 °C. After cooling to
25 °C, the sugars were analyzed using high performance liquid chromatography (“HPLC” section). Inorganic ash content was determined by heating in a furnace (535 °C for 3.5 h). For measurement of total lipids, 0.1 g of biomass was sonicated for 1 h with 6 mL chloroform and 3 mL methanol, and the mixture was then centrifuged at 4000 rpm for phase separation. The organic solvent phase (containing lipid) was collected and dried using N2 gas purging until the weight was stable, and was then measured. Protein composition was calculated based
on the nitrogen-to-protein conversion factor of 4.7843. The elemental composition was determined using an
elemental analyzer (Flash 2000, Thermo-Scientific, USA) with a thermal conductivity detector. All chemicals were purchased from Sigma-Aldrich.
Dilute acid hydrolysis and post‑treatment of Chlorella sp. ABC‑001 solution.
The acid hydroly-sis of microalgae in H2SO4 (98% by weight, Sigma-Aldrich, USA) and HNO3 (70% by weight, Sigma-Aldrich,USA) were compared. For each test, 5 g biomass was added to 100 mL acid at different concentrations (0.5, 1, or 2 N) in an oil bath at 90 °C for 10 different reaction times (30 to 300 min). Then, the hydrolysate was cooled to 25 °C for post-treatment processing.
The post-treatment processing was used to determine the effect of chemicals generated from the hydrolyzing acids and neutralizing alkali on fermentation of ethanol by S. cerevisiae. For cells hydrolyzed by H2SO4, two
dif-ferent alkalis were compared: Ca(OH)2 (> 96%, Sigma-Aldrich, USA) and NaOH (> 97%, Sigma-Aldrich, USA).
(1) Carbohydrates concentration mg/L
=158.62 × OD490nm+0.37
Table 2. Cell growth and ethanol production by S. cerevisiae KL17 in different Chlorella sp. ABC-001 hydrolysates and YPD medium. ANOVA tests for cell growth and ethanol yield indicated significant differences (P < 0.001). Student’s t test indicated significant differences from the YPD (control), shown as ***P < 0.001, **P < 0.01, and *P < 0.05.
The CaSO4 was removed by sedimentation and the Na+ and SO42− ions were removed by ED. For cells hydrolyzed
by HNO3, only NaOH was used for alkalization and Na+ and NO3− ions were removed by ED.
Before the ED, the hydrolysate was passed through a membrane filter (pore diameter: 0.22 μm) for sterilization and removal of cell debris. Then, the filtered hydrolysate was desalted in the ED unit (Electro Dialyzer CJ-S3, Changjotechno Co., Korea) with an AC 110 membrane cartridge. The molecular weight (MW) cut-off size of the ED membrane was 110 (greater than the MW of SO42− or NO3− and less than the MW of mono-sugars). The
conductivity of the hydrolysate (an indicator of salt concentration) was measured using an electrical conductivity meter (F3, Mettler Toledo, USA). ED was continued until the conductivity of the hydrolysates was 5 mS/cm, the same as the YPD medium. Before hydrolysates were used for fermentation, they were adjusted to a pH of 5.5, and then filtered (as above) for sterilization.
Cultivation of S. cerevisiae KL17.
S. cerevisiae KL17, a strain isolated from soil in Korea28, was used forethanol fermentation. For seed cultivation, cells were cultivated in YPD medium that contained glucose (20 g/L), yeast extract (10 g/L), and peptone (20 g/L). The medium used for the control group (grown in YPD medium) had a glucose concentration of 13.5 g/L. The seed culture was prepared at 30 °C and 200 rpm in a 50 mL Fal-con tube Fal-containing 10 mL YPD medium. When the OD600nm of the culture was 10.0, 1 mL of the seed culture
medium was added to 49 mL of the main culture medium in a 250 mL flask. All main cultures were performed at 30 °C with shaking at 200 rpm. OD600nm was measured and cell concentration was calculated using Eq. 2
(R2 = 0.995):
Analysis of fermentable carbon sources, ethanol, cations, and oxidative stress.
The compo-sition and concentrations of sugars, organic acids, HMF, and ethanol in the hydrolysate were analyzed using HPLC (“HPLC” section). The concentrations of cations (Na+, K+, and Ca2+) in the hydrolysate were determinedusing an inductively coupled plasma optical emission spectrometer (ICP-OES, Spectroblue, Ametek, USA). To determine the oxidative stress of hydrolysates, total reactive oxygen species (ROS) and reactive nitrogen species (RNS) were analyzed using the OxiSelect™ in vitro ROS & RNS assay kit (STA-347, Cell Biolabs, USA) with a fluorescence microplate reader (λexcitation = 480 nm, λemission = 530 nm; SpectraMax M2e, Molecular Devices)44.
HPLC.
Sugars, organic acids, HMF, and ethanol were measured using an HPLC system (Ultimate 3000, Dionex, USA) that had a refractive index detector and a UV detector. The temperature of the Aminex HPX-87H column was set at 65 °C and the flow rate of the mobile phase (0.01 N H2SO4) was 0.6 mL/min. The levelsof galactose, xylose, and mannose were determined using an HPLC system (515 Pump, 717plus Autosampler, Waters, USA) that had an Asahipak NH2P-50 4E amine column and an evaporative light scattering detector (SEDEX 75, Sedere, France). The temperature of the column was kept at 30 °C, the mobile phase was a solution of acetonitrile and water (80:20), and the flow rate was 1.0 mL/min.
Statistical analysis.
All experiments were conducted in triplicate (n = 3) and the results were expressed as means ± SDs. A one-way analysis of variance (ANOVA) was used calculate the significance of individual differ-ences of parameters under different conditions. Student’s t test was used to determine differdiffer-ences from the YPD (control). All calculations were performed using Microsoft Excel.Received: 16 June 2020; Accepted: 24 August 2020
References
1. Tilman, D. et al. Beneficial biofuels-the food, energy, and environment trilemma. Science 325, 270–271 (2009). 2. Ragauskas, A. J. et al. The path forward for biofuels and biomaterials. Science 311, 484–489 (2006).
3. Ahmad, A. L., Yasin, N. H. M., Derek, C. J. C. & Lim, J. K. Microalgae as a sustainable energy source for biodiesel production: A review. Renew. Sustain. Energy Rev. 15, 584–593 (2011).
4. Singh, J. & Cu, S. Commercialization potential of microalgae for biofuels production. Renew. Sustain. Energy Rev. 14, 2596–2610 (2010).
5. Wijffels, R. H., Barbosa, M. J. & Eppink, M. H. M. Microalgae for the production of bulk chemicals and biofuels. Biofuels Bioprod.
Biorefin. Biofpr. 4, 287–295 (2010).
6. Ho, S. H. et al. Bioethanol production, using carbohydrate-rich microalgae biomass as feedstock. Bioresour. Technol. 135, 191–198 (2013).
7. John, R. P., Anisha, G. S., Nampoothiri, K. M. & Pandey, A. Micro and macroalgal biomass: A renewable source for bioethanol.
Bioresour. Technol. 102, 186–193 (2011).
8. Lee, O. K. et al. Chemo-enzymatic saccharification and bioethanol fermentation of lipid-extracted residual biomass of the micro-alga, Dunaliella tertiolecta. Bioresour. Technol. 132, 197–201 (2013).
9. Mirsiaghi, M. & Reardon, K. F. Conversion of lipid-extracted Nannochloropsis salina biomass into fermentable sugars. Algal Res.
Biomass Biofuels Bioprod. 8, 145–152 (2015).
10. Seon, G., Joo, H. W., Kim, Y. J., Park, J. & Chang, Y. K. Hydrolysis of lipid-extracted Chlorella vulgaris by simultaneous use of solid and liquid acids. Biotechnol. Progr. 35, e2729 (2019).
11. Markou, G., Wang, L., Ye, J. F. & Unc, A. Using agro-industrial wastes for the cultivation of microalgae and duckweeds: Contami-nation risks and biomass safety concerns. Biotechnol. Adv. 36, 1238–1254 (2018).
12. Kumar, S. P. J. et al. Green solvents and technologies for oil extraction from oilseeds. Chem. Cent. J. 11, 9 (2017).
(2) Cell concentration g/L
21. Kim, N. J., Li, H., Jung, K., Chang, H. N. & Lee, P. C. Ethanol production from marine algal hydrolysates using Escherichia coli KO11. Bioresour. Technol. 102, 7466–7469 (2011).
22. Collinson, L. P. & Dawes, I. W. Inducibility of the response of yeast-cells to peroxide stress. J. Gen. Microbiol. 138, 329–335 (1992). 23. Lewis, J. G., Learmonth, R. P. & Watson, K. Induction of heat, freezing and salt tolerance by heat and salt shock in Saccharomyces
cerevisiae. Microbiology‑Uk 141, 687–694 (1995).
24. Chen, C.-Y. et al. Microalgae-based carbohydrates for biofuel production. Biochem. Eng. J. 78, 1–10 (2013).
25. Cho, J. M., Oh, Y.-K., Park, W.-K. & Chang, Y. K. Effects of the status of nitrogen supplementation on CO2 biofixation and biofuel production of the promising microalga Chlorella sp. ABC-001. J. Microbiol. Biotechnol. 30, 1235–1243 (2020).
26. Chang, Y.K. et al. Chlorella sp. ABC-001 strain having excellent lipid productivity and cell growth rate under high carbon dioxide and salt concentration condition and uses thereof. Korean Intellectual Property Office. 10–1855733 (2018).
27. Park, J., Hong, S. K. & Chang, Y. K. Production of DagA and ethanol by sequential utilization of sugars in a mixed-sugar medium simulating microalgal hydrolysate. Bioresour. Technol. 191, 414–419 (2015).
28. Kim, J. H. et al. Ethanol production from galactose by a newly isolated Saccharomyces cerevisiae KL17. Bioprocess Biosyst. Eng. 37, 1871–1878 (2014).
29. Council, N. R. Assessment of Exposure‑Response Functions for Rocket‑Emission Toxicants (National Academies Press, Washington, 1998).
30. Scholz, M. J., Riley, M. R. & Cuello, J. L. Acid hydrolysis and fermentation of microalgal starches to ethanol by the yeast Saccha‑
romyces cerevisiae. Biomass Bioenerg. 48, 59–65 (2013).
31. Martins, S. & Van Boekel, M. A kinetic model for the glucose/glycine Maillard reaction pathways. Food Chem. 90, 257–269 (2005). 32. Nie, S. P. et al. Effect of pH, temperature and heating time on the formation of furan from typical carbohydrates and ascorbic acid.
J. Food Agric. Environ. 11, 121–125 (2013).
33. Blackburn, S. Amino acid determination. Methods and techniques (1968).
34. Park, C. et al. Enhancement of hydrolysis of Chlorella vulgaris by hydrochloric acid. Bioprocess Biosyst. Eng. 39, 1015–1021 (2016). 35. Jamieson, D. J. Saccharomyces cerevisiae has distinct adaptive responses to both hydrogen peroxide and menadione. J. Bacteriol.
174, 6678–6681 (1992).
36. Rodriguez-Navarro, A. Potassium transport in fungi and plants. Biochim. Biophysica Acta Rev. Biomembr. 1469, 1–30 (2000). 37. Gomez, M. J., Luyten, K. & Ramos, J. The capacity to transport potassium influences sodium tolerance in Saccharomyces cerevisiae.
FEMS Microbiol. Lett. 135, 157–160 (1996).
38. Hess, D. C., Lu, W. Y., Rabinowitz, J. D. & Botstein, D. Ammonium toxicity and potassium limitation in yeast. PLoS Biol. 4, 2012–2023 (2006).
39. Na, J. G. et al. Rapid estimation of triacylglycerol content of Chlorella sp. by thermogravimetric analysis. Biotechnol. Lett 33, 957–960 (2011).
40. Lee, Y. C. et al. Lipid extractions from docosahexaenoic acid (DHA)-rich and oleaginous Chlorella sp. biomasses by organic-nanoclays. Bioresour. Technol. 137, 74–81 (2013).
41. Laurens, L. M. L. et al. Algal biomass constituent analysis: Method uncertainties and investigation of the underlying measuring chemistries. Anal. Chem. 84, 1879–1887 (2012).
42. Moxley, G. & Zhang, Y. H. P. More accurate determination of acid-labile carbohydrates in lignocellulose by modified quantitative saccharification. Energy Fuels 21, 3684–3688 (2007).
43. Templeton, D. W. & Laurens, L. M. L. Nitrogen-to-protein conversion factors revisited for applications of microalgal biomass conversion to food, feed and fuel. Algal Res. Biomass Biofuels Bioprod. 11, 359–367 (2015).
44. Wang, H. Z. et al. The metabolic function of cyclin D3-CDK6 kinase in cancer cell survival. Nature 546, 426-+ (2017).
Acknowledgements
The authors would like to acknowledge the funding provided by the Advanced Biomass R&D Center (ABC) of the Global Frontier Project, funded by the Ministry of Science and ICT (ABC-2010-0029728) and the National Research Foundation of Korea (NRF) grant funded by the Korea Government (MSIT) (2019R1G1A1100253).
Author contributions
G.S conducted most of experiments, collected and interpreted the data, and wrote the manuscript. H.S.K did data analysis and supplied materials. J.M.C helped writing the manuscript. And M.K supported analysis of experimental results. Y.K.C and W.-K.P interpreted the overall study, revised the manuscript and approved final version for publication. All of authors read and approved for publication.
Competing interests
The authors declare no competing interests.
Additional information
Supplementary information is available for this paper at https ://doi.org/10.1038/s4159 8-020-73816 -4. Correspondence and requests for materials should be addressed to W.-K.P. or Y.K.C.
Publisher’s note Springer Nature remains neutral with regard to jurisdictional claims in published maps and institutional affiliations.
Open Access This article is licensed under a Creative Commons Attribution 4.0 International License, which permits use, sharing, adaptation, distribution and reproduction in any medium or format, as long as you give appropriate credit to the original author(s) and the source, provide a link to the Creative Commons licence, and indicate if changes were made. The images or other third party material in this article are included in the article’s Creative Commons licence, unless indicated otherwise in a credit line to the material. If material is not included in the article’s Creative Commons licence and your intended use is not permitted by statutory regulation or exceeds the permitted use, you will need to obtain permission directly from the copyright holder. To view a copy of this licence, visit http://creat iveco mmons .org/licen ses/by/4.0/.