© 2016 The Korean Academy of Medical Sciences.
This is an Open Access article distributed under the terms of the Creative Commons Attribution Non-Commercial License (http://creativecommons.org/licenses/by-nc/4.0) which permits unrestricted non-commercial use, distribution, and reproduction in any medium, provided the original work is properly cited.
pISSN 1011-8934 eISSN 1598-6357
Disability-Adjusted Life Years for 313 Diseases and Injuries:
the 2012 Korean Burden of Disease Study
This study is part of a 5-year research project on the national burden of diseases, injuries, and risk factors in Korea. Using disability-adjusted life years (DALYs), a metric introduced by the 1990 Global Burden of Disease (GBD) project, we performed a comprehensive and detailed assessment of the magnitude and distribution of both fatal and non-fatal health problems in the Korean population. The concept and general approach were consistent with the original GBD study, with some methodological modifications to make the study more suitable for Korea. We computed DALYs for 313 causes in both sexes and nine age groups using the entire population’s medical records and newly generated Korean disability weights. In 2012, the dominant disease burden was non-communicable diseases, which accounted for 85.21% of total DALYs, while injuries accounted for 7.77% and
communicable, maternal, neonatal, and nutritional disorders for 7.02%. Of the total DALYs, 88.67% were from years lived with disability and 11.32% were from years of life lost due to premature mortality. Diabetes mellitus was the leading cause of DALYs, followed by low back pain, chronic obstructive pulmonary disease, ischemic heart disease, ischemic stroke, cirrhosis of the liver, falls, osteoarthritis, motorized vehicle with three or more wheels, and self-harm. The results reported here identify key health challenges and opportunities for future health interventions and policy changes, and provide information that will help assess the major public health issues in Korea, a nation faced with one of the world’s most rapidly ageing populations.
Keywords: Burden of Disease; Disability-Adjusted Life Year (DALY); Population Health; Health Policy; Korea
Jihyun Yoon,1 In-Hwan Oh,2
Hyeyoung Seo,1 Eun-Jung Kim,3
Young-hoon Gong,4 Minsu Ock,5
Dohee Lim,6 Won Kyung Lee,7
Ye-Rin Lee,2 Dongwoo Kim,4
Min-Woo Jo,5 Hyesook Park,6
and Seok-Jun Yoon4
1Department of Public Health, Graduate School,
Korea University, Seoul, Korea; 2Department of
Preventive Medicine, School of Medicine, Kyung Hee University, Seoul, Korea; 3Department of
Nursing, Pyeongtaek University, Pyeongtaek, Korea;
4Department of Preventive Medicine, College of
Medicine, Korea University, Seoul, Korea;
5Department of Preventive Medicine, University of
Ulsan College of Medicine, Seoul, Korea;
6Department of Preventive Medicine, School of
Medicine, Ewha Womans University, Seoul, Korea;
7Department of Social and Preventive Medicine,
Inha University School of Medicine, Incheon, Korea Received: 13 March 2016
Accepted: 12 June 2016 Address for Correspondence: Seok-Jun Yoon, MD
Department of Preventive Medicine, College of Medicine, Korea University, 73 Inchon-ro, Seongbuk-gu, Seoul 02841, Korea E-mail: [email protected]
Funding: This study was supported by a grant from the Korean Health Technology R&D Project, Ministry of Health and Welfare, Republic of Korea (Study No. HI13C0729).
https://doi.org/10.3346/jkms.2016.31.S2.S146 • J Korean Med Sci 2016; 31: S146-157
INTRODUCTION
In the modern world, degenerative and life-style-related disea-ses have displaced infectious diseadisea-ses as the chief cause of mor-bidity and death (1). This epidemiologic transition is well-ad-vanced in developed countries and measures of mortality or health status alone do not provide a realistic view of public health. The disability-adjusted life year (DALY), a metric introduced by the 1990 Global Burden of Disease (GBD) project introduced, provides a unique perspective by quantifying gaps between ac-tual and ideal health conditions based on units of time lost (2). As the sum of years of life lost (YLLs) due to premature mortali-ty and years lived with disabilimortali-ty (YLDs) (3), DALY integrates disease-specific fatal and non-fatal outcomes into a single mea-sure while still allowing the two outcomes to be examined sep-arately (4,5). Thus, DALY enables comparisons between health losses due to mortality and morbidity and those due to
differ-ent diseases by considering the time lost due to individuals’ pre-mature death from each disease and the severity level associat-ed with different states of poor health causassociat-ed by each disease. DALY analysis can therefore be a useful tool for estimating which diseases and injuries contribute to health loss the most in a giv-en population, as well as for prioritizing health policy concerns, such as resource allocation, interventions, and research (2,3,6-9). With its low fertility rate and high life expectancy, Korean de-mographics are shifting rapidly. The number of people aged ≥ 65 years has tripled over the last 30 years and is projected to reach 32.30% of the population by 2040 (10). In this ageing pop-ulation, the prevalence and mortality rate of chronic diseases have grown continuously in last 10 years, and health spending, which as a share of GDP increased about 2% point since 2005, has outpaced the nation’s strong economic growth (11). Thus, understanding changes in diseases and major disorders and their risk factors is crucial, both for identifying opportunities to
http://jkms.org S147 https://doi.org/10.3346/jkms.2016.31.S2.S146
improve the nation’s health (12) and for reducing the socio-eco-nomic burden of illness. Since changes in health policy should be based on scientific evidence, the Ministry of Health and Wel-fare established a 5-year project supporting research on esti-mating and projecting the national burden due to diseases, in-juries, and their risk factors, as well as on the cost-effectiveness of potential health interventions. The project was implemented by four collaborating institutions (Korea University, University of Ulsan, Ewha Womans University, and Kyung Hee University). Here we summarize the key findings of the recently-completed first phase: assessing the national burden of diseases and inju-ries in 2012. The study examined more than 300 medical condi-tions using the best available sources, including the entire pop-ulation’s medical records. We hope that these findings provide a comprehensive view of the current level of health in Korea.
MATERIALS AND METHODS
The concept and approach were consistent with the original GBD study (3,13) with some modifications to make the study more suitable for the Korean population and comparable with other burden of disease studies.
Levels of analysis
Reference year & age groups
The reference year for this study is 2012. To be consistent with previous Korean burden of disease studies, we divided the sub-jects into nine age groups (0-9, 10-19, 20-29, … 70-79, ≥ 80 years) to use as base cases. In the analyses of maternal, neonatal, and nutritional conditions, we subdivided the age-groups depend-ing on the characteristics of the disease (14).
Disease and injury categories
To capture our population’s current health status and enable comparisons with other burden of disease studies, we modified the recently published GBD 2010 cause list using several local data sources. These sources included the 298 disease classifica-tions from the National Health Insurance Service (NHIS), the 53 infectious diseases in the Mandatory Surveillance System from the Korea Centers for Disease Control and Prevention (KC-DC), the 24 cancer lists from the Korea Central Cancer Registry (KCCR), and cause lists from the previous national burden of disease studies. Subdivision or grouping, or renaming of disea-ses was determined by an expert panel of clinicians from the divisions of gastroenterology, cardiology, infectious diseases, and psychiatry. The 27 causes from the GBD 2010 list were mod-ified, leading to agreement on the most disaggregated level of 260 mutually exclusive causes. The GBD 4-level hierarchical structure was maintained. Our list includes 3 level I causes, 21 level II causes, 166 level III causes, and 123 level IV causes. Of the 166 level III causes, 137 do not have any level IV causes
be-low them in the hierarchy. The three broad level I causes were 1) communicable, maternal, neonatal, and nutritional condi-tions; 2) non-communicable diseases; and 3) injuries. A com-plete list of causes with ICD-10 codes will be provided upon re-quest.
Database
We used national representative data sources to estimate na-tional epidemiologic parameters and to sustain reliability. These sources included the database of residents registered in 2012 from the Ministry of the Interior, the 2012 Causes of Death Sta-tistics and Life Expectancy Table from the StaSta-tistics Korea, NHIS claims data for 2007-2012, the 2012 Health Insurance Statistical Yearbook, 2008-2012 National Cancer Registration and Statis-tics from the KCCR, survey data from the Korea National Health & Nutrition Examination Survey, the list of 53 infectious diseas-es in the Mandatory Surveillance System, the 2012 Infectious Diseases Surveillance Yearbook, and 2010 Korea National Hos-pital Discharge Injury Surveillance data from KCDC.
Social value choices
Life expectancy
The Statistics Korea publishes age- and sex-specific life tables annually (10). Here we used the life expectancies provided in the 2012 tables as the ideal health status, allowing us to estimate how many years of life are lost when death occurs at any given age (3). According to the table, the Korean life expectancy at birth is 77.95 years for males and 84.64 years for females (15). Time discounting & age weights
The original 1990 GBD study and World Health Organization (WHO) DALY updates applied a 3% time discount rate to future lost years of healthy life for one data set and a 0% discount to an alternative data set, and incorporated age-weighting into all heal-th outcome measures in heal-their base case analyses (16). There are arguments for and against discounting future health and age-weighting in Korean burden of disease studies, but we tend to agree with the recent arguments that a year of healthy life is eq-ually important in terms of population health regardless of age and the year in which it is lived, particularly where the DALY quantifies loss of health rather than the social value of loss of health (16,17). Given the lack of consensus on the issue, we fol-lowed the original WHO guide for national burden of disease studies (13) and computed a set with standard age-weighting (C = 0.1658, β = 0.04) and 3% time discounting and another with no age-weighting and 0% time discounting. The set with standard age-weighting and 3% time discounting constitutes the main reporting of results here.
Disability weights
S148 http://jkms.org https://doi.org/10.3346/jkms.2016.31.S2.S146 228 diseases and injuries in Korea. A total of 496 medical
pro-fessionals (specialists, physicians, and third- and fourth-year medical students) conducted discrete choice experiments and estimated the weights of the 228 most disaggregated disabili-ties, scaled from 0 (perfect health) to 1 (equivalent to death) us-ing methods described elsewhere (18). Disability weights for residual categories, such as “other diarrheal disease” and “other lower respiratory infection”, were not estimated because those categories were part of a collection of detailed causes and there-fore could not be described clearly enough for proper quantifi-cation. Instead, we applied the mean value of the superordinate category for the target subject where the residual category be-longed in the hierarchy. For some non-communicable diseases where outpatients accounted for more than 95% of cases but were weighted relatively high, we considered the severity level by dividing each category into outpatient and inpatient cases and applied the lowest disability weight value in its superordi-nate category to outpatient cases and its own estimated value to inpatient cases.
Cause of death
By law, all deaths in Korea must be reported to the Statistics Ko-rea within one month, and causes of death are coded according to the 6th Korean Classification of Diseases (KCD-6), which is based on the 10th revision of the International Classification of Causes of Death (ICD-10). The Statistics Korea collects death data from death certificates transmitted by the family of the de-ceased and verifies any questionable information from other administrative sources. The Statistics Korea allows registration to be delayed up to 4-month period until April of the following year. Infant deaths, which are often unregistered, are adjusted through cremation reports and neonatal mortality data produc-ed by the Mother and Child Health Law. Wrongful or external causes (e.g., accidents) are confirmed by data from the National Cancer Center, the NHIS, the National Forensic Service, the Ko-rean National Police Agency, the Ministry of National Defense, or the maritime police (10). Still, a problem remains due to the direct-input system, which is associated with the registration of ambiguous or vague codes (“garbage codes” [3]). Senility (ICD-10, R54), for example, accounts for 22% of garbage codes. Alth-ough Korea’s garbage code rate is lower than that of other coun-tries, it is still high (19). In order to address incomplete data and to ensure the accuracy of cause of death estimates, we modified the GBD 2010 study’s algorithms and redistributed the proble-matic underlying causes of death (19).
Estimating epidemiologic parameters
To quantify burden of non-fatal health outcomes on the popu-lation, several epidemiologic parameters needed to be estimat-ed. Since the Korean national insurance system, NHIS, is the single insurer covering approximately 97% of the population
(20) and is supposed to maintain complete medical records for the insured as well as for medical aid beneficiaries, we mainly used NHIS data to estimate prevalence and incidence rates for each disease. Diagnoses were coded using KCD-6 organized according to ICD-10. We decided on an extraction range of whe-ther to include secondary diagnosis with the principal diagno-sis through consultation with health professionals, and we de-veloped case definitions for each disease by considering fre-quency of attendance at a health care facility and whether there was a hospital admission in 2012. Incidence cases were extract-ed from prevalence cases and were definextract-ed as those with no prior diagnosis in a time period of 1-5 years (from 2007 up until 2011), depending on the nature of the disease. Thus, through analyses for every possible combination of prevalence and inci-dence cases, literature reviews, and professional consultations, we determined final case definitions and were thereby able to estimate prevalence and incidence rates for each cause. In or-der to ensure the accuracy of cancer cases, we asked the KCCR to extract the number of prevalence and incidence cases for each type of cancer by age and sex according to the ICD-10 codes classified in this study’s disease categories. Details of the KC-CR’s Korea National Cancer Incidence Database and estima-tion method for prevalence cases were previously published (21). For injuries, we used 7th Korea National Hospital Discharge Injury Surveillance data to capture more reliable mechanisms and complex types of injuries that would not be covered in the NHIS claims data. Details on the characteristics of data and anal-ysis method for injuries are described elsewhere (22). We esti-mated the duration and average age at onset through the DIS-MOD II program (23) and carefully examined the outputs and adjusted duration values for overestimated cases. For infectious diseases, such as lower respiratory infections that have a mor-bidity period of less than a month and commonly recur, we re-placed values by recalculations based on information in the Health Insurance Statistical Yearbook 2012 (24). When the esti-mated disease duration exceeded the life expectancy at that age, we replaced the case’s estimated duration with the life ex-pectancy.
Calculation of YLLs, YLDs, and DALYs
For each cause, we computed YLLs by multiplying the number of deaths at a given age by the standard life expectancy at that age, and we computed incidence YLDs by multiplying the num-ber of incident cases by their mean duration and the disability weight of the disease (25). For both, we incorporated 3% time discounting and age-weighting and, for an alternative set, 0% time discounting and no age weighting. DALYs were calculated as the sum of the YLLs and YLDs.
Final ranking lists
po-http://jkms.org S149 https://doi.org/10.3346/jkms.2016.31.S2.S146
tential influence on health interventions and policy. Because residual categories (e.g., other musculoskeletal disorders, other chronic respiratory diseases, other digestive diseases) do not provide a clear basis for decision making or interventions, we excluded the 18 residual categories from the final ranking list. Therefore, the final ranking contains 242 of the 260 most disag-gregated, mutually exclusive causes.
Ethics statement
The study protocol was reviewed and approved by Korea Uni-versity’s institutional review board, 1040548-KU-IRB-13-164-A-1(E-A-1)(E-A-1). Informed consent was waived by the board.
RESULTS
Non-communicable diseases (NCDs) comprised the predomi-nant burden of disease in Korea in 2012, accounting for 85.21% of total DALYs, compared with 7.77% for injuries and 7.02% for
communicable, maternal, neonatal, and nutritional disorders (Fig. 1). Of the total DALYs, 88.67% were from YLDs and 11.32% from YLLs. Females contributed a larger proportion of YLDs than males across all three broad level I cause groups. In both sexes, those aged 50-59 years had the highest level of DALYs, followed by those aged 40-49 years, 60-69 years, 30-39 years, and 70-79 years. In all age groups except 80+ years, YLDs ac-counted for at least 71.72% of DALYs in both sexes, and in the 80+ year age group they accounted for 48.74% in men and 49.03% in women (Fig. 2).
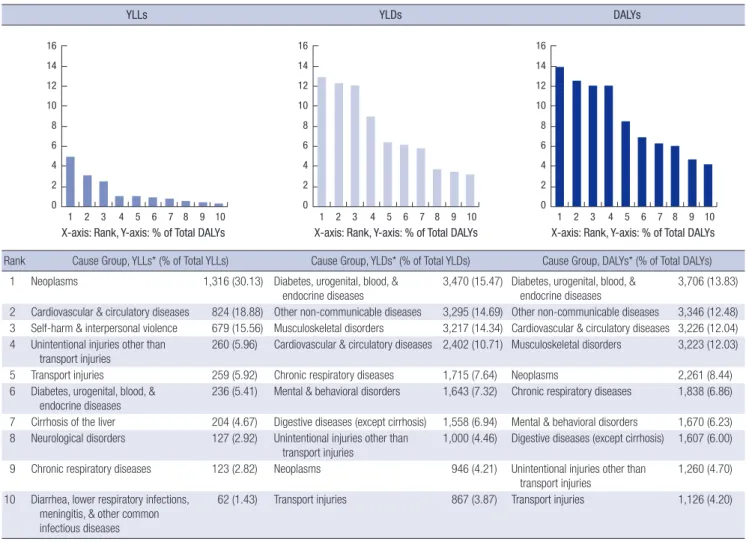
Among level II broad cause groups (Fig. 3), diabetes, urogen-ital, blood, and endocrine diseases accounted for 13.83% of to-tal DALYs and ranked first. Other non-communicable diseases, which included periodontal disease, refraction and accommo-dation disorders, vision loss, and glaucoma accounted for 12.48%; cardiovascular and circulatory diseases for 12.04%; and muscu-loskeletal disorders for 12.03%. All neoplasms collectively caus-ed 8.44% of total DALYs. Of the 31 types of cancers includcaus-ed in
Fig. 1. DALY shares by broad cause groups (A) and YLL & YLD composition of total DALYs by sex and broad cause groups (B), 2012.
DALYs, disability-adjusted life years; YLLs, years of life lost due to premature mortality; YLDs, years lived with disability; NCD, non-communicable diseases; CMMN, communi-cable, maternal, neonatal, and nutritional disorders; INJ, injuries.
Non-communicable diseases
85.21% Communicable, maternal, neonatal & nutritional disorders
7.02% Injuries 7.77% A 0 0.5 1 NCD CMMN INJ Males YLL YLD 0 0.5 1 NCD CMMN INJ Females YLL YLD B Fig. 2.
Total disability-adjusted life years (DALYs), by sex and age group, 2012. DALYs per 100,000 population. 0-9 10-19 20-29 30-39 40-49 50-59 60-69 70-79 80+ (Year) 6,000 5,000 4,000 3,000 2,000 1,000 0 Males YLL YLD 0 1,000 2,000 3,000 4,000 5,000 6,000 Females
S150 http://jkms.org https://doi.org/10.3346/jkms.2016.31.S2.S146 the analysis, the five top-ranked cancers accounted for more
than 60% of the burden of all neoplasms – cancer of the trachea, bronchus, and lung (14.05%); stomach (13.55%); liver (12.74%); colon and rectum (12.08%); and thyroid (8.48%). Within chron-ic respiratory diseases (6.86%), chronchron-ic obstructive pulmonary disease (COPD) accounted for more than two-thirds and asth-ma nearly one-third. Mental and behavioral disorders caused 6.23% of total DALYs and digestive diseases accounted for 6.00%. Within injuries, unintentional injuries other than transport in-juries made up the largest portion (4.70%), followed by trans-port injuries (4.20%) then self-harm and interpersonal violence (2.87%). The top 10 level II cause groups accounted for about 86.80% of total DALYs. All of the communicable, maternal, neo-natal and nutritional disorders ranked low and are not shown in the figures. Within that category, the major causes were ma-ternal disorders (1.40%); diarrhea, lower respiratory infections, meningitis, and other common infectious diseases (0.99%); HIV/ AIDS and tuberculosis (0.56%); and neonatal disorders (0.24%). YLLs contributed relatively little to the total burden. Neoplasms,
cardiovascular and circulatory diseases, and self-harm and in-terpersonal violence were dominant causes of total YLLs, ac-counting collectively for about 64.57%.
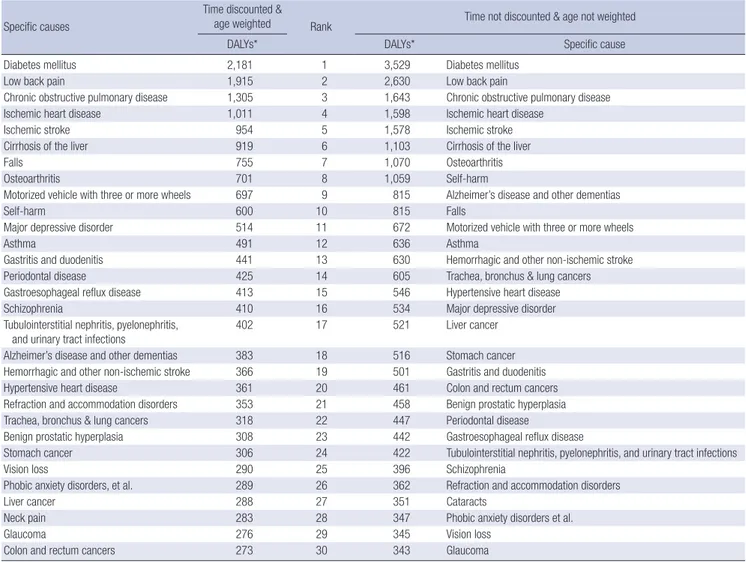
Table 1 shows the 30 leading conditions with and without age-weighting and time discounting. Diabetes mellitus (DM) was the leading specific cause of total DALYs, followed by low back pain, COPD, ischemic heart disease, and ischemic stroke. The top 30 specific causes accounted for about 68.01% of all DALYs. In the set with neither age-weighting nor time discount-ing, three of the top 30 causes – motorized vehicle with three or more wheels, schizophrenia, and neck pain – declined slightly while nearly all others increased; Alzheimer’s disease and other dementias more than doubled. The results seem fairly consistent, and there was no noticeable re-ranking effect in the highest rank-ed causes. Fig. 4 presents a graphical comparison of ranks for causes of DALYs calculated with and without age-weighting and time discounting. No age-weighting and 0% discounting gave more importance to causes with the greatest burden in children, such as preterm birth complications and sepsis and
YLLs YLDs DALYs
Rank Cause Group, YLLs* (% of Total YLLs) Cause Group, YLDs* (% of Total YLDs) Cause Group, DALYs* (% of Total DALYs) 1 Neoplasms 1,316 (30.13) Diabetes, urogenital, blood, &
endocrine diseases
3,470 (15.47) Diabetes, urogenital, blood, & endocrine diseases
3,706 (13.83) 2 Cardiovascular & circulatory diseases 824 (18.88) Other non-communicable diseases 3,295 (14.69) Other non-communicable diseases 3,346 (12.48) 3 Self-harm & interpersonal violence 679 (15.56) Musculoskeletal disorders 3,217 (14.34) Cardiovascular & circulatory diseases 3,226 (12.04) 4 Unintentional injuries other than
transport injuries
260 (5.96) Cardiovascular & circulatory diseases 2,402 (10.71) Musculoskeletal disorders 3,223 (12.03) 5 Transport injuries 259 (5.92) Chronic respiratory diseases 1,715 (7.64) Neoplasms 2,261 (8.44) 6 Diabetes, urogenital, blood, &
endocrine diseases
236 (5.41) Mental & behavioral disorders 1,643 (7.32) Chronic respiratory diseases 1,838 (6.86) 7 Cirrhosis of the liver 204 (4.67) Digestive diseases (except cirrhosis) 1,558 (6.94) Mental & behavioral disorders 1,670 (6.23) 8 Neurological disorders 127 (2.92) Unintentional injuries other than
transport injuries
1,000 (4.46) Digestive diseases (except cirrhosis) 1,607 (6.00) 9 Chronic respiratory diseases 123 (2.82) Neoplasms 946 (4.21) Unintentional injuries other than
transport injuries 1,260 (4.70) 10 Diarrhea, lower respiratory infections,
meningitis, & other common infectious diseases
62 (1.43) Transport injuries 867 (3.87) Transport injuries 1,126 (4.20)
1 2 3 4 5 6 7 8 9 10 16 14 12 10 8 6 4 2 0 1 2 3 4 5 6 7 8 9 10 16 14 12 10 8 6 4 2 0 1 2 3 4 5 6 7 8 9 10 16 14 12 10 8 6 4 2 0
X-axis: Rank, Y-axis: % of Total DALYs X-axis: Rank, Y-axis: % of Total DALYs X-axis: Rank, Y-axis: % of Total DALYs
Fig. 3. Ten leading broad cause groups of YLLs, YLDs and DALYs, 2012. YLLs*, YLDs*, and DALYs* per 100,000 population. Sums may not add up to exact total due to round-ing. 18 residual categories were excluded in calculation of percentages of YLLs, YLDs, and DALYs.
http://jkms.org S151 https://doi.org/10.3346/jkms.2016.31.S2.S146
other infectious disorders of the newborn baby, while giving less importance to causes largely affecting middle-aged wom-en, such as iron-deficiency anemia. Overall, these results con-firmed that the application of age-weighting and discounting did not cause any large changes in the rank ordering of diseases and injuries included in the analysis.
Fig. 5 shows the 30 leading conditions by sex. The burden in females was about 2.19 times that for males for major depres-sive disorder, 2.23 for Alzheimer’s disease and other dementias, and 3.35 for osteoarthritis. Conversely, the burden of cirrhosis of the liver in men was 2.22 times that in women. Some cancers were only ranked within the top 30 in males, including tracheal, bronchial, and lung; liver; stomach; and colon and rectum can-cers.
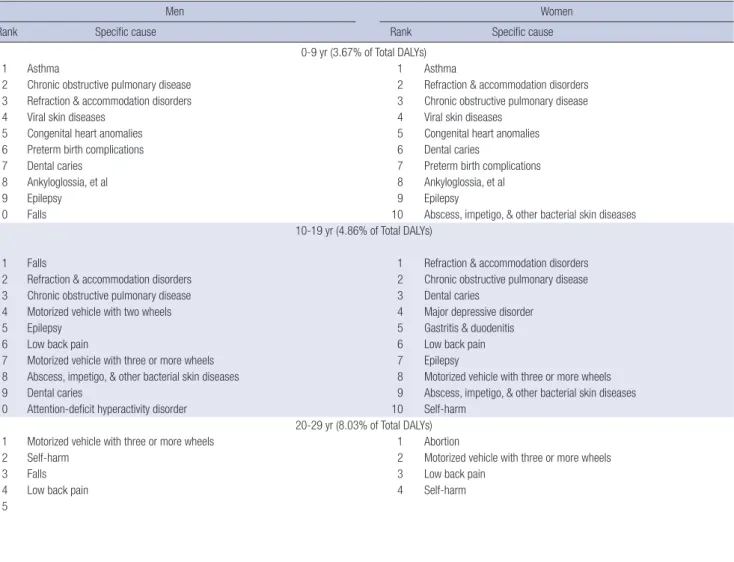
Table 2 shows the top 10 leading causes by sex and age group. For children aged 0-9 years, asthma, COPD, refraction and ac-commodation disorders, viral skin diseases, and congenital heart anomalies were highest ranked. Major causes of DALYs in those 10-19 years old included falls, refraction and accommodation Table 1. Top 30 leading specific causes of disability-adjusted life years (DALYs), with and without discounting and age weighting, in total, 2012
Specific causes
Time discounted &
age weighted Rank Time not discounted & age not weighted
DALYs* DALYs* Specific cause
Diabetes mellitus 2,181 1 3,529 Diabetes mellitus
Low back pain 1,915 2 2,630 Low back pain
Chronic obstructive pulmonary disease 1,305 3 1,643 Chronic obstructive pulmonary disease
Ischemic heart disease 1,011 4 1,598 Ischemic heart disease
Ischemic stroke 954 5 1,578 Ischemic stroke
Cirrhosis of the liver 919 6 1,103 Cirrhosis of the liver
Falls 755 7 1,070 Osteoarthritis
Osteoarthritis 701 8 1,059 Self-harm
Motorized vehicle with three or more wheels 697 9 815 Alzheimer’s disease and other dementias
Self-harm 600 10 815 Falls
Major depressive disorder 514 11 672 Motorized vehicle with three or more wheels
Asthma 491 12 636 Asthma
Gastritis and duodenitis 441 13 630 Hemorrhagic and other non-ischemic stroke Periodontal disease 425 14 605 Trachea, bronchus & lung cancers Gastroesophageal reflux disease 413 15 546 Hypertensive heart disease
Schizophrenia 410 16 534 Major depressive disorder
Tubulointerstitial nephritis, pyelonephritis,
and urinary tract infections 402 17 521 Liver cancer
Alzheimer’s disease and other dementias 383 18 516 Stomach cancer Hemorrhagic and other non-ischemic stroke 366 19 501 Gastritis and duodenitis Hypertensive heart disease 361 20 461 Colon and rectum cancers Refraction and accommodation disorders 353 21 458 Benign prostatic hyperplasia Trachea, bronchus & lung cancers 318 22 447 Periodontal disease
Benign prostatic hyperplasia 308 23 442 Gastroesophageal reflux disease
Stomach cancer 306 24 422 Tubulointerstitial nephritis, pyelonephritis, and urinary tract infections
Vision loss 290 25 396 Schizophrenia
Phobic anxiety disorders, et al. 289 26 362 Refraction and accommodation disorders
Liver cancer 288 27 351 Cataracts
Neck pain 283 28 347 Phobic anxiety disorders et al.
Glaucoma 276 29 345 Vision loss
Colon and rectum cancers 273 30 343 Glaucoma
*DALYs per 100,000 population.
Fig. 4. Relationship between the rank of causes of disability-adjusted life years (DALYs) with and without age weighting and discounting, 2012. Rank 1 is the largest cause.
DAL
Y Rank (no a
ge-weights,
0% discount)
DALY Rank (standard age-weights, 3% discount) 250 200 150 100 50 0 0 50 100 150 200 250 Preterm birth complications Sepsis and other
infectious disorders of the newborn
Iron-deficiency anemia
S152 http://jkms.org https://doi.org/10.3346/jkms.2016.31.S2.S146 disorders, COPD, accidents with motorized vehicles with two
wheels, and epilepsy in boys; and refraction and accommoda-tion disorders, COPD, dental caries, major depressive disorder, gastritis and duodenitis in girls. For men and women aged 20-29, injuries, including motorized vehicle with three or more wheels and self-harm, were included in the top-ranked causes of DALYs. In women of childbearing age (20-39 years), abortion and fe-male infertility were among the highest causes of burden. For the three decadal groups between 30 and 59 years of age, DM, low back pain, and cirrhosis of the liver were consistently ranked in the top three for men while low back pain, COPD, DM and osteoarthritis were ranked highly for women. DM was the most important cause for men and women in their 60s, and cardio-vascular and circulatory diseases started to be highly ranked for men in their 40s and women in their 50s. Alzheimer’s disease and other dementias appeared important for both men and
wo-men in their 70s, but the burden was higher in wowo-men.
DISCUSSION
As improved living conditions and advances in medical tech-nology and treatment have lowered death rates due to infec-tious diseases globally, the relative importance of NCDs as a cause of death have increased (26). Korea is no exception to this epidemiologic transition. As can be predicted in a population with a rapidly rising mean age, NCDs formed the predominant burden of disease in Korea in 2012, accounting for 85.21% of to-tal DALYs, and contributing 87.27% of toto-tal YLD. Because age-related causes are main contributors to this burden, this phe-nomenon is likely to persist or increase in the near future, as it has in other high-income countries. Compared to the top ranked causes in 2002 and 2007 population-based Korean burden of Fig. 5. Top 30 specific causes of disability-adjusted life years (DALYs) by sex with fraction of years of life lost (YLLs) and years lived with disability (YLDs), 2012. DALYs per 100,000 population.
Cirrhosis-, cirrhosis of the liver; IHD, ischemic heart disease; COPD, chronic obstructive pulmonary disease; motorized v. 3+, motorized vehicle with three or more wheels; BPH, benign prostatic hyperplasia; c, cancer(s); hemorrhagic-, hemorrhagic and other non-ischemic stroke; gastroesophageal-, gastroesophageal reflux disease; major depressive-, major depressive disorder; hypertensive HD, hypertensive heart disease; gastritis-, gastritis and duodenitis; refraction-, refraction and accommodation disorders; mechanical forces, mechanical forces (other); motorized v. 2+, motorized vehicle with two wheels; Alzheimer’s-, Alzheimer’s disease and other dementias; tubulointerstitial-, tubulointersti-tial nephritis; pyelonephritis, and urinary tract infections, phobic anxiety-, phobic anxiety disorders, et al.
Males
0 500 1,000 1,500 2,000 2,500
Diabetes mellitus Low back pain Cirrhosis-IHD COPD Ischemic stroke Falls Motorized v. 3+ Self-harm BPH Periodontal disease TBL c. Liver c. Asthma Schizophrenia Hemorrhagic-Stomach c. Gastroesophageal-Colon & rectum c. Osteoarthritis Major depressive-Hypertensive HD Gastritis- Refraction-Mechanical forces Glaucoma Vision loss Motorized v. 2+ Epilepsy Alzheimer’s YLL YLD Females 0 500 1,000 1,500 2,000 2,500
Low back pain Diabetes mellitus COPD Osteoarthritis Ischemic stroke IHD Major depressive-Falls Tubulointerstitial-Motorized v. 3+ Cirrhosis- Gastritis-Asthma Alzheimer’s- Gastroesophageal-Abortion Self-harm Refraction-Schizophrenia Hypertensive HD Periodontal disease Phobic anxiety-Neck pain Hemorrhagic-Breast c. Thyroid c. Vision loss Rheumatoid arthritis Female infertility Glaucoma YLL YLD
http://jkms.org S153 https://doi.org/10.3346/jkms.2016.31.S2.S146
Table 2. Top 10 specific causes of disability-adjusted life years (DALYs) by sex and age group, 2012
Men Women
Rank Specific cause Rank Specific cause
0-9 yr (3.67% of Total DALYs)
1 Asthma 1 Asthma
2 Chronic obstructive pulmonary disease 2 Refraction & accommodation disorders 3 Refraction & accommodation disorders 3 Chronic obstructive pulmonary disease
4 Viral skin diseases 4 Viral skin diseases
5 Congenital heart anomalies 5 Congenital heart anomalies
6 Preterm birth complications 6 Dental caries
7 Dental caries 7 Preterm birth complications
8 Ankyloglossia, et al 8 Ankyloglossia, et al
9 Epilepsy 9 Epilepsy
10 Falls 10 Abscess, impetigo, & other bacterial skin diseases
10-19 yr (4.86% of Total DALYs)
1 Falls 1 Refraction & accommodation disorders
2 Refraction & accommodation disorders 2 Chronic obstructive pulmonary disease 3 Chronic obstructive pulmonary disease 3 Dental caries
4 Motorized vehicle with two wheels 4 Major depressive disorder
5 Epilepsy 5 Gastritis & duodenitis
6 Low back pain 6 Low back pain
7 Motorized vehicle with three or more wheels 7 Epilepsy
8 Abscess, impetigo, & other bacterial skin diseases 8 Motorized vehicle with three or more wheels 9 Dental caries 9 Abscess, impetigo, & other bacterial skin diseases 10 Attention-deficit hyperactivity disorder 10 Self-harm
20-29 yr (8.03% of Total DALYs) 1 Motorized vehicle with three or more wheels 1 Abortion
2 Self-harm 2 Motorized vehicle with three or more wheels
3 Falls 3 Low back pain
4 Low back pain 4 Self-harm
5 Schizophrenia 5 Chronic obstructive pulmonary disease
S154 http://jkms.org https://doi.org/10.3346/jkms.2016.31.S2.S146
Men Women
Rank Specific cause Rank Specific cause
50-59 yr (22.02% of Total DALYs)
1 Diabetes mellitus 1 Low back pain
2 Low back pain 2 Diabetes mellitus
3 Cirrhosis of the liver 3 Osteoarthritis
4 Ischemic heart disease 4 Chronic obstructive pulmonary disease
5 Ischemic stroke 5 Ischemic heart disease
6 Chronic obstructive pulmonary disease 6 Ischemic stroke
7 Benign prostatic hyperplasia 7 Cirrhosis of the liver
8 Liver cancer 8 Major depressive disorder
9 Falls 9 Gastroesophageal reflux disease
10 Stomach cancer 10 Gastritis & duodenitis
60-69 yr (14.87% of Total DALYs)
1 Diabetes mellitus 1 Diabetes mellitus
2 Ischemic heart disease 2 Low back pain
3 Ischemic stroke 3 Osteoarthritis
4 Chronic obstructive pulmonary disease 4 Ischemic heart disease
5 Low back pain 5 Ischemic stroke
6 Benign prostatic hyperplasia 6 Chronic obstructive pulmonary disease
7 Trachea, bronchus & lung cancers 7 Falls
8 Cirrhosis of the liver 8 Major depressive disorder
9 Stomach cancer 9 Hypertensive heart disease
10 Liver cancer 10 Cataracts
70-79 yr (11.16% of Total DALYs)
1 Ischemic stroke 1 Ischemic stroke
2 Ischemic heart disease 2 Alzheimer’s disease & other dementias 3 Chronic obstructive pulmonary disease 3 Diabetes mellitus
4 Diabetes mellitus 4 Ischemic heart disease
5 Trachea, bronchus & lung cancers 5 Chronic obstructive pulmonary disease 6 Alzheimer’s disease & other dementias 6 Low back pain
7 Benign prostatic hyperplasia 7 Osteoarthritis
8 Low back pain 8 Falls
9 Stomach cancer 9 Cataracts
10 Cataracts 10 Hypertensive heart disease
80+ yr (2.98% of Total DALYs)
1 Ischemic stroke 1 Alzheimer’s disease & other dementias
2 Chronic obstructive pulmonary disease 2 Ischemic stroke
3 Ischemic heart disease 3 Ischemic heart disease
4 Alzheimer’s disease & other dementias 4 Chronic obstructive pulmonary disease 5 Trachea, bronchus & lung cancers 5 Diabetes mellitus
6 Diabetes mellitus 6 Falls
7 Stomach cancer 7 Hypertensive heart disease
8 Colon & rectum cancers 8 Hemorrhagic & other non-ischemic stroke
9 Hypertensive heart disease 9 Parkinson’s disease
10 Hemorrhagic & other non-ischemic stroke 10 Trachea, bronchus & lung cancers Table 2. Continued
disease studies (27,28), the present study showed that DM, cere-brovascular disease, IHD, cirrhosis of the liver, asthma, and CO-PD had become consistently greater causes of DALYs in both sexes. The most noticeable difference in 2012 was the appear-ance of low back pain among the top 10 DALY causes. This re-sult could be partially attributed to the frequency of treatments and the fact that traditional medical treatment records, which contain a great portion of musculoskeletal disorders, have been included in NHIS claims data since 2010. However, the abso-lute number of low back pain patients was indeed high, even in young ages groups (29), owing to the lack of exercise, bad
pos-ture habits, and obesity that have become increasingly common in modern life. Due to differences in methodology, data sourc-es, and years of reference, the present study is not directly com-parable to the recent GBD study, but the latter reported back pain, neck pain, and other musculoskeletal diseases as the most important three contributors for Korean DALYs in 2013 (30). These conditions generate a considerable cost to both individu-als and society through life-long disability and substantial health care needs, and it is therefore urgent to develop strategies for dealing with such age-related conditions, especially consider-ing our rapidly ageconsider-ing population and the associated increase
http://jkms.org S155 https://doi.org/10.3346/jkms.2016.31.S2.S146
in health care expenditures (6,31,32).
Injuries including accidents with motorized vehicles and self-harm were ranked within the top 10 for ages 10-19 and were con-sistently important causes of DALYs for the proceeding three decades of age. As the burden from those causes is largely relat-ed to social factors, multi-sectoral policy options should be ad-dressed for targeted intervention.
Time discounting is applied to future health loss while age-weighting values a year lived by young and middle-aged adults more highly than a year lived by a child or older adults (8,13). In our analysis, when no discounts or age-weights were applied, some causes with high incidence cases in young and middle-aged adults, such as motorized vehicle with three or more wheels, schizophrenia, and neck pain, became slightly less important. In contrast to those causes, Alzheimer’s disease and other de-mentias, which were highly ranked in those aged ≥ 70 years in both sexes, more than doubled when age-weighting and dis-counting were eliminated, especially in women. For most spe-cific causes, however, we found no dramatic changes between the two data sets in values or rank orders. As for the overall in-crease after no discounting and no age-weighting, the incidence rates by age groups were considered relatively stable.
Over the course of this study, it became apparent that a num-ber of methodological issues need to be addressed to improve the validity and applicability of the DALY metric in Korea. Here we briefly summarize those issues.
Discrepancies existed between actual and recorded causes of death in Korea. About 25% of the codes were inappropriate and had to be redistributed to validate the age-sex-cause spe-cific mortality and fatality rates for this study. We modified the GBD 2010 study’s garbage code redistribution algorithm to be more suitable for the Korean disease classification system, but this needs further work to approach the target accuracy (19). Our main source for disease prevalence and incidence data in this study was NHIS claims data. Although NHIS is a national database that helps us understand health care utilization at the population level, it has limitations. The accuracy of diagnoses has been questioned. NHIS also does not provide data on peo-ple with unmet medical needs and therefore prevalence and incidence rates could have been underestimated, especially for conditions such as mental and behavioral disorders (33). To improve the utility of the database for defining disease preva-lence and incidence cases more specifically, combining treat-ment or prescription information with the main diagnosis codes in NHIS claims data analyses could be performed as part of a revision process. Since we analyzed the different case defini-tions and consulted with clinical experts, however, we are fairly confident in our results. Consistent longitudinal epidemiologic studies and population-based surveys are always important and can provide supplementary information to help validate the epidemiologic indicators as well as to judge how the NHIS
claims data can be adjusted to reflect population estimates more precisely.
Adjustments were not made in disability weighting and YLD computations for individuals with comorbidities. Modelling the comorbidity combinations and their effect on future progres-sion of conditions is challenging, but we plan to address this in the 2017 follow-up study.
If diseases were divided into severity levels and disability wei-ghts were available for each level, the validity of the results would be greater. Further analytical methods would be required. A meaningful and accurate assessment of trends and of the relative magnitude of a population’s burden of disease over time requires strictly consistent methodology and reliance on the same data sources (9,17). The DALY estimates we report here are not directly comparable with those of the previous Korean burden of disease studies mainly due to differences in disease categories, database, and newly estimated disability weights (34). To continue providing the comprehensive, comparative, and consistent evidence required to appropriately guide policy and practice priorities (30), such estimates should be produced and updated on a regular basis with consistent data and met-rics, for a wide range of health problems rather than for a limit-ed set. This would strengthen future assessments of health in Korea, enhancing their value for policy and program develop-ment (12).
Despite these limitations in methodology and data, the re-sults reported here identify key health challenges and opportu-nities for improving health in Korea. As the first comprehensive study covering 313 causes and making full use of the best na-tional representative databases, this study presents a substan-tially different picture from the previous studies, which included limited disease categories. In our current analysis using DALY as a metric, causes that did not receive much attention previously because they are not directly related to mortality – such as low back pain, osteoarthritis, and major depressive disorder – were evaluated on equal terms with all other causes and given a place among health priorities. Thus, we provide a broad base of evi-dence for assessing the major public health issues that can in-form decision making on policy options or health interventions. The next steps of our project involve mainly risk factor and cost effectiveness analyses. Linking our study results to such analyses will provide insights into how best to investigate avoid-able burdens of disease and to evaluate the relative impact of health interventions. After the follow-up assessment of disease burden, the forces driving changes in population health pat-terns should be identified. Because disease patpat-terns are con-stantly changing, population-level burden of disease studies should be regularly updated. When that is done with consistent methodology, our DALY estimates, by broadly characterizing disease transition, will be strengthened as a tool for setting pri-orities for health policy, interventions, and research topics.
S156 http://jkms.org https://doi.org/10.3346/jkms.2016.31.S2.S146 DISCLOSURE
The authors have no potential conflicts of interest to disclose.
AUTHOR CONTRIBUTION
Study supervision: Yoon SJ. Study conception and design: Yoon J, Oh IH, Jo MW, Park H, Yoon SJ. Acquisition of data: Yoon J, Seo H. Analysis and interpretation of data: Yoon J, Oh IH, Seo H, Kim EJ, Ock M, Lim D, Lee WK, Lee YR, Jo MW, Park H, Yoon SJ. Preparation of the first draft: Yoon J. Critical revision: Oh IH, Seo H, Kim EJ, Gong YH, Kim D, Jo MW, Park H, Yoon SJ. Final-ization of the manuscript: Yoon J, Yoon SJ. Approval of the final version of the manuscript: all authors.
ORCID
Jihyun Yoon http://orcid.org/0000-0001-7758-4794 In-Hwan Oh http://orcid.org/0000-0002-5450-9887 Hyeyoung Seo http://orcid.org/0000-0001-8668-8384 Eun-Jung Kim http://orcid.org/0000-0003-2352-5267 Young-hoon Gong http://orcid.org/0000-0002-2146-9399 Minsu Ock http://orcid.org/0000-0001-9949-9224 Dohee Lim http://orcid.org/0000-0002-0549-8704 Won Kyung Lee http://orcid.org/0000-0002-6014-8854 Ye-Rin Lee http://orcid.org/0000-0002-4507-4877 Dongwoo Kim http://orcid.org/0000-0001-7731-4081 Min-Woo Jo http://orcid.org/0000-0002-4574-1318 Hyesook Park http://orcid.org/0000-0002-9359-6522 Seok-Jun Yoon http://orcid.org/0000-0003-3297-0071
REFERENCES
1. Omran AR. The epidemiologic transition. A theory of the epidemiology of population change. Milbank Mem Fund Q 1971; 49: 509-38.
2. Murray CJ. Summary Measures of Population Health: Concepts, Ethics, Measurement and Applications. Geneva: World Health Organization, 2002. 3. Murray CJ, Lopez AD. The Global Burden of Disease: a Comprehensive
Assessment of Mortality and Disability from Diseases, Injuries and Risk Factors in 1990 and Projected to 2020. Cambridge, MA: Harvard Univer-sity Press, 1996.
4. Lopez AD, Mathers CD, Ezzati M, Jamison DT, Murray CJ. Global Burden of Disease and Risk Factors. Washington, D.C.: The International Bank for Reconstruction and Development/The World Bank, 2006.
5. Mathers CD, Vos ET, Stevenson CE, Begg SJ. The burden of disease and injury in Australia. Bull World Health Organ 2001; 79: 1076-84.
6. Murray CJ, Vos T, Lozano R, Naghavi M, Flaxman AD, Michaud C, Ezzati M, Shibuya K, Salomon JA, Abdalla S, et al. Disability-adjusted life years (DALYs) for 291 diseases and injuries in 21 regions, 1990-2010: a system-atic analysis for the global burden of disease study 2010. Lancet 2012; 380: 2197-223.
7. Melse JM, Essink-Bot ML, Kramers PG, Hoeymans N; Dutch Burden of
Disease Group. A national burden of disease calculation: Dutch disabili-ty-adjusted life-years. Am J Public Health 2000; 90: 1241-7.
8. Murray CJ, Lopez AD. Global Comparative Assessments in the Health Sector: Disease Burden, Expenditures, and Intervention Packages. Gene-va: World Health Organization, 1994.
9. Murray CJ, Lopez AD. Measuring the global burden of disease. N Engl J Med 2013; 369: 448-57.
10. Statistics Korea. Korean statistical information service [Internet]. Avail-able at http://kosis.kr/ [accessed on 11 November 2015].
11. Organisation for Economic Co-operation and Development. OECD health statistics 2015: how dose health spending in Korea compare? [Internet]. Available at http://www.oecd.org/els/health-systems/Country-Note-KO-REA-OECD-Health-Statistics-2015.pdf [accessed on 11 November 2015]. 12. Begg SJ, Vos T, Barker B, Stanley L, Lopez AD. Burden of disease and inju-ry in Australia in the new millennium: measuring health loss from disea-ses, injuries and risk factors. Med J Aust 2008; 188: 36-40.
13. Mathers CD, Vos T, Lopez AD, Salomon J, Ezzati M. National Burden of Disease Studies: a Practical Guide; Edition 2.0. Geneva: World Health Or-ganization, 2001.
14. Kim SH, Lee HJ, Ock M, Go DS, Kim HJ, Lee JY, Jo MW. Disability-Adjust-ed Life Years for Maternal, Neonatal, and Nutritional Disorders in Korea. J Korean Med Sci 2016;31 Suppl 2:S184-90.
15. Statistics Korea. Korean statistical information service: life table [Internet]. Available at http://kosis.kr/statisticsList/statisticsList_01List.jsp?vwcd= MT_ZTITLE&parentId=A#SubCont [accessed on 17 November 2015]. 16. World Health Organization. WHO Methods and Data Sources for Global
Burden of Disease Estimates 2000-2011. Geneva: World Health Organi-zation, 2013.
17. Murray CJ, Ezzati M, Flaxman AD, Lim S, Lozano R, Michaud C, Naghavi M, Salomon JA, Shibuya K, Vos T, et al. GBD 2010: design, definitions, and metrics. Lancet 2012; 380: 2063-6.
18. Ock M, Lee JY, Oh IH, Park H, Yoon SJ, Jo MW. Disability Weights Measure-ment for 228 Causes of Disease in the Korean Burden of Disease Study 2012. J Korean Med Sci 2016;31 Suppl 2:S129-38.
19. Lee YR, Kim YA, Park SY, Oh CM, Kim YE, Oh IH. Application of a Modi-fied Garbage Code Algorithm to Estimate Cause-Specific Mortality and Years of Life Lost in Korea. J Korean Med Sci 2016;31 Suppl 2:S121-8. 20. National Health Insurance Services (KR). Major statistics on national health
insurance services: 2012 [Internet]. Available at http://www.nhis.or.kr [accessed on 11 November 2015].
21. National Cancer Center (KR). Annual Report of Cancer Statistics in Korea in 2012. Ilsan: National Cancer Center, 2014.
22. Lee WK, Lim D, Park H. Disability-Adjusted Life Years (DALYs) for Injuries Using Death Certificates and Hospital Discharge Survey by the Korean Burden of Disease Study 2012. J Korean Med Sci 2016;31 Suppl 2:S200-7. 23. Barendregt JJ, Van Oortmarssen GJ, Vos T, Murray CJ. A generic model for
the assessment of disease epidemiology: the computational basis of Dis-Mod II. Popul Health Metr 2003; 1: 4.
24. National Health Insurance Service (KR); Health Insurance Review & As-sessment Service (KR). Health Insurance Statistical Yearbook 2012. Na-tional Health Insurance Service; Health Insurance Review & Assessment Service, 2013.
25. World Health Organization. Metrics: disability-adjusted life year (DALY) [Internet]. Available at http://www.who.int/healthinfo/global_burden_ disease/metrics_daly/en/ [accessed on 30 November 2015].
http://jkms.org S157 https://doi.org/10.3346/jkms.2016.31.S2.S146
26. Ezzati M, Riboli E. Can noncommunicable diseases be prevented? Lessons from studies of populations and individuals. Science 2012; 337: 1482-7. 27. Kim EJ, Yoon SJ, Jo MW, Kim HJ. Measuring the burden of chronic
diseas-es in Korea in 2007. Public Health 2013; 127: 806-13.
28. Yoon SJ, Bae SC, Lee SI, Chang H, Jo HS, Sung JH, Park JH, Lee JY, Shin Y. Measuring the burden of disease in Korea. J Korean Med Sci 2007; 22: 518-23.
29. Yoon J, Seo H, Oh IH, Yoon SJ. The Non-Communicable Disease Burden in Korea: Findings from the 2012 Korean Burden of Disease Study. J Ko-rean Med Sci 2016;31 Suppl 2:S158-67.
30. Vos T, Barber RM, Bell B, Bertozzi-Villa A, Biryukov S, Bolliger I, Charlson F, Davis A, Degenhardt L, Dicker D. Global, regional, and national incidence, prevalence, and years lived with disability for 301 acute and chronic dis-eases and injuries in 188 countries, 1990-2013: a systematic analysis for
the global burden of disease study 2013. Lancet 2015; 386: 743-800. 31. March L, Smith EU, Hoy DG, Cross MJ, Sanchez-Riera L, Blyth F,
Buchbin-der R, Vos T, Woolf AD. Burden of disability due to musculoskeletal (MSK) disorders. Best Pract Res Clin Rheumatol 2014; 28: 353-66.
32. Hoy D, Geere JA, Davatchi F, Meggitt B, Barrero LH. A time for action: op-portunities for preventing the growing burden and disability from mus-culoskeletal conditions in low- and middle-income countries. Best Pract Res Clin Rheumatol 2014; 28: 377-93.
33. Lim D, Lee WK, Park H. Disability-adjusted Life Years (DALYs) for Mental and Substance Use Disorders in the Korean Burden of Disease Study 2012. J Korean Med Sci 2016;31 Suppl 2:S191-9.
34. Yoon J, Yoon SJ. Quantifying Burden of Disease to Measure Population Health in Korea. J Korean Med Sci 2016;31 Suppl 2:S101-7.