40
HIRA 빅데이터 브리프COVID-19의 감염여부와 감염 시
중증도에 영향을 미치는 동반상병
1
1. 분석배경
1
중증 급성 호흡기 바이러스 증후군 코로나바이러스-2 (SARS-CoV-2)에 의해서 일어나는 코로나
바이러스 감염증-19(이하 Coronavirus disease 2019; COVID-19)는 2019년 12월부터 급격히
확산하여 전 세계적으로 엄청난 감염자와 사망자를 야기하고 있다.
사회적 거리 두기, 마스크 착용 등의 방역대책이 전파속도를 줄일 수 있고, 한국 등 일부 국가에서는
성공적으로 확산을 저지하고 있으나, 전 세계적으로 2020년 7월 현재 2차 유행(Second wave)이
진행 중이다.
COVID-19의 신속한 진료와 예방대책 수립을 위해서는 COVID-19의 감염여부와 감염 시 중등도에
영향을 미치는 위험요인을 알아내고, 특히 만성질환 중 취약한 집단을 찾아야 한다.
이 연구는 건강보험심사평가원의 COVID-19 데이터베이스를 활용하여 우리나라 성인 COVID-19
감염자와 핵산증폭검사 음성 대조군을 비교하여 감염 여부에 영향을 미치는 동반상병을 확인하고,
COVID-19에 걸린 확진자에서 산소호흡기 치료 이상을 요구하는 중증환자의 발생 위험 요인을
파악하기 위해 수행되었다.
1. 본고는 Journal of Korean Medical Science지에 출판된 ‘Effect of Underlying Comorbidities on
the Infection and Severity of COVID-19 in Korea: a Nationwide Case-Control Study’, 2020 Jun 29;35(25):e237, https://doi.org/10.3346/jkms.2020.35.e237, eISSN 1598-6357·pISSN 1011-8934 에 기초하고 있음
정재훈 교수
41
I. 보건의료 빅데이터 동향 Ⅱ. 보건의료 빅데이터 분석 사례 Ⅲ. 전문가 기고2. 분석대상과 내용
2.1 자료원
대한민국의 건강보험은 단일 보험자에 의한 보편적 의료보장을 달성하고 있으며, 전 국민의 97% 이상의
의료이용이 기록되는 대규모 데이터베이스를 운영하고 있다.
건강보험심사평가원은 급여항목에 대하여 의료이용 시 진단명과 주요 처치내용 등을 심사하여 저장하고
있으며, COVID-19 환자는 대한민국 국민의 경우 전체 의료행위가 급여대상으로 동일하게 의료이용
내역이 수집된다.[그림 1]
건강보험심사평가원은 중앙사고수습본부가 심평원에 위탁하여 수집중인 확진자 DB에서 COVID-19
확진자 및 사망여부 정보를 건강보험 청구자료에 결합하고, COVID-19로 인해 진단검사를 받은 국민은
국가 재난 코드인 MT043을 활용하여 확진자와 검사 음성 비확진자의 데이터베이스를 구축하였다.
[ 그림 1 ] 건강보험심사평가원의 COVID-19 데이터 획득 과정
이 연구는 이러한 COVID-19 확진자 정보와 RT-PCR 검사 음성 대조군의 정의를 활용하여
건강보험청구자료를 통해 사례를 정의하였으며, 중증 사례는 COVID-19로 인한 입원기간 중
산소요법, 기계환기, ECMO 등을 시행한 환자로 정의하였다.
2.2 연구 설계
이 연구는 크게 두 개의 후향적 사례-대조군 연구로 설계되었다. 첫 번째 연구는 확진자와 비확진자의
COVID-19 감염 이전 동반상병의 유무와 감염의 관련성을 추적하였으며, 두 번째 연구는 확진자 내에서
중증사례와 경증사례를 구분하여 동반상병의 유무와 관련성을 검증하였다.[그림 2]
동반상병은 COVID-19 확진 3년 이전, 미리 정의된 KCD-7코드를 주진단으로 최소 2회 이상 의료이용을
할 경우 해당 상병이 존재하는 것으로 정의하였다. 동반상병은 감염내과 전문의와 호흡기내과 전문의의
Patient visit Medical utilization Claim with list of services and diagnosis (ICD-10)
Payment with review of medical care cost
Review for claims
Automatic review
General review
Expert review
Data collection and distribution
42
HIRA 빅데이터 브리프검토를 거쳐 총 56군으로 구분하였다.
또한 다양한 교란변수를 통제하기 위하여, 성별, 연령 이외에도 발생 지역(대구/경북 등), 요양 병원
장기 입원 여부, 환자의 건강 상태를 간접적으로 추정하기 위한 최근 1년간 입원횟수, 외래 횟수, 응급실
횟수 등을 공변량으로 설정하였다.
위에서 제시된 동반상병과 공변량 이외에도 엄밀한 분석을 위해 대구. 경북지역, 장기입원 여부에 따른
세부 단위 분석도 수행하였다.
[ 그림 2 ] 연구 설계
2.3. 통계분석
확진자와 대조군, 중증환자와 경증환자의 기초특성 분석을 위해서 카이제곱 분석과, T검정을 사용하였으며,
동반상병에 따른 감염과 중증화 위험은 로지스틱 회귀 모형을 적용하였다.
로지스틱 회귀모형에는 연령, 성별, 거주지역, 찰슨의 동반상병지수, 최근 1년간 의료이용 내역 등이
포함되었다. 분리(Separation)와 과적합(Overfitting)을 방지하기 위해 로지스틱 모형은 후진제거를
적용한 모형과 적용하지 않은 모형을 별도로 구축하였다.
Patients who had negative result of COVID-19 (test negative controls)
(n = 212,620)
1st stage case-control study for development of COVID-19
2nd stage case-control study for severity of COVID-19 Yes Yes No No Patients wiht severe COVID-19 (n = 954) Patients wiht severe COVID-19 (n = 954)
Participants who received laboratory test of COVID-19 at the Korean HIRA database
(n = 234,427)
Adult participants who received laboratory test of COVID-19 at the Korean HIRA database
(n = 219,961)
Exclusion:
Under 18 years old (n = 14,466)
Laboratory confirmed COVID-19 Patients who were diagnosed
laboratory confirmed COVID-19 (cases) (n = 7,341)
Severe COVID-19 who received more than oxygen therapy
43
I. 보건의료 빅데이터 동향 Ⅱ. 보건의료 빅데이터 분석 사례 Ⅲ. 전문가 기고2.4 윤리적 고려
이 연구는 후향적 연구로 가천대 길병원 연구윤리심의위원회의 동의면제를 획득하였다.
(GFIRB2020-134)
3. 분석결과
3.1 기초 특성
2020년 5월 15일까지 COVID-19 검사를 받은 총 219,961명의 18세 이상 성인이 연구에 포함되었다.
해당 기간 중 COVID-19 확진자는 7,341명이 있으며, 중증환자는 954명이었다.
연구대상자의 기초 특성은 [표 1, 2]와 같다.
확진자에 비교하여 검사 음성대조군이 오히려 더 연령이 높으며, 동반상병 점수가 높은 것이 특징적이다.
이는 우리나라에서 이루어지는 COVID-19 검사가 비교적 건강상태가 좋지 않은 집단에서 더욱더
빈번하게 이루어졌음을 의미한다.
3.2 COVID-19의 감염에 영향을 미치는 동반상병
이 연구는 총 120번 이상의 독립적인 로지스틱 회귀모형으로 이루어져 있기 때문에 이를 표로 제시하기
어렵다. 또한 로지스틱 모형을 통해서는 보정된 비차비(Adjusted Odds Ratio; aOR)가 얻어진다.
저자들은 한 질환에 대한 여러 모형에서 제시된 비차비의 범위를 그림으로 제시하였다.
[그림 3]은 감염여부에 영향을 미치는 동반상병의 aOR의 범위를 색으로 나타낸 것이다. 붉은색이
진해질수록 비차비가 1보다 커짐을 의미하고, 녹색이 진해질수록 비차비가 1보다 작아짐을 의미한다.
대부분의 질환에서 단변량 분석 시 오히려 비차비가 1보다 적어지는 경향을 보인다. 이는 대조군이
상대적으로 나이가 많고, 동반상병이 많기 때문에 나타나는 현상이다. 그러나 다변수 모형을 통해
교란변수를 통제하면 주요 위험요인을 가진 상병이 나타난다.
당뇨병은 감염위험을 일관되게 높이며, 사구체성 신질환과 류마티스성 관절염 또한 감염의 위험을
높인다.[그림 3]
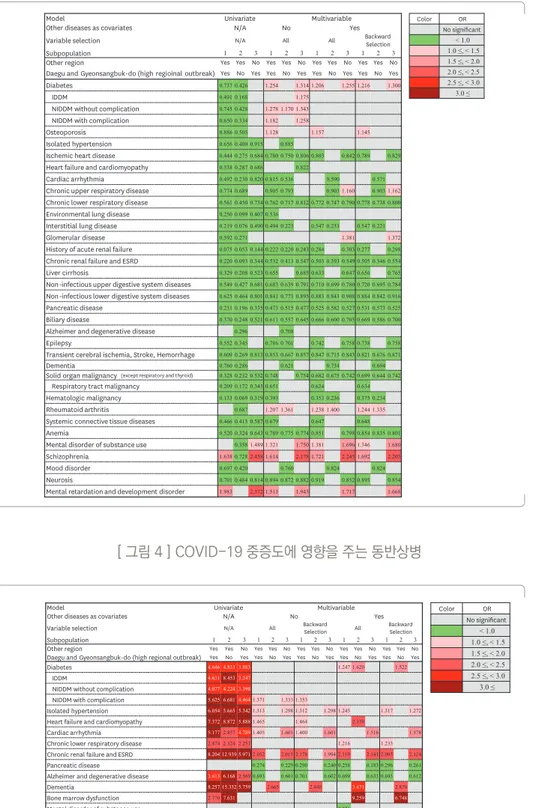
3.3 COVID-19 중증도에 영향을 미치는 동반상병
COVID-19 감염여부에 영향을 미치는 동반상병과는 상반되게 대부분의 동반상병은 단변량분석에서
중증도를 높이는 것처럼 보인다. 그러나 이것은 중증 COVID-19 환자의 나이가 상대적으로 더 많고,
동반질환을 많이 가지고 있는 특성 때문이다. 이를 보정하면 COVID-19의 중증도에 영향을 주는 상병을
44
HIRA 빅데이터 브리프확인할 수 있다.
당뇨병, 고혈압, 심부전 등의 만성질환과 부정맥, 만성하기도질환, 신장질환은 중증 COVID-19와 높은
관련성을 보였다.[그림 4]
4. 결론
이 연구를 통해 전 세계적인 위기를 초래한 COVID-19의 감염여부와 중증도에 영향을 주는 다양한
동반상병을 확인할 수 있었다. 당뇨병은 COVID-19 감염과 중증도 모두에 영향을 주는 중요한
위험요인이며, 고혈압, 심부전 등의 순환기계 질환도 COVID-19의 중증도에 영향을 주었다.
고혈압, 당뇨병을 가진 국민은 각별히 COVID-19의 감염예방을 위해 노력해야 하며, 마스크쓰기,
손 씻기, 사회적 거리 두기 등의 개인 위생대책을 준수해야한다.
5. 건강보험 청구자료를 활용한 COVID-19 연구 시 유의점
COVID-19를 대상으로 한 청구자료 연구를 할 때는 다음과 같은 점을 주의해야한다.
■COVID-19는 감염병으로 감염여부에 영향을 미치는 요인은 건강보험 청구자료에서 파악할 수 있는
정보보다 다른 외부요인에 더 영향을 많이 받는다. 즉 밀접접촉여부, 의료시설, 요양시설 이용 여부 등의
역학적 정보에 대해서 반드시 고려해야한다.
■COVID-19는 현재 진행 중인 상태로 환자의 상태가 지속해서 변화할 수 있으므로, 가급적 일정한
추적관찰 기간을 각 개인에게 부여해야 한다.
■COVID-19 자료 통합 시 배제상병을 명확하게 정의해야 하며, 배제상병 정의를 하지 않을 경우
확진자 변수를 반드시 사용해야 한다.
■검사 음성 대조군의 경우 반복 검사로 인해 확진자로 판정되는 경우가 다수 있어, 최초 검사로만
판단할 경우 중복 집계의 가능성이 있다. 확진일 직전 1~2일의 의료정보는 확진 전 의료 이용과
확진 후 의료이용이 겹칠 수 있어 이에 대한 고려가 반드시 필요하다
■확진자와 음성대조군, 중증환자와 경증환자의 기초 특성이 매우 상이하여, 분석 역학적 연구를 수행할
경우 반드시 성향점수 짝짓기 등 기초 특성을 고려할 수 있는 연구 방법론 선택이 필요하다.
■경증 환자를 위한 생활치료센터의 경우 특정 변수를 활용할 경우 식별이 가능하나, 전원 등에 대한
고려가 필요하다.
45
I. 보건의료 빅데이터 동향 Ⅱ. 보건의료 빅데이터 분석 사례 Ⅲ. 전문가 기고[ 그림 3 ] COVID-19 감염여부에 영향을 주는 동반상병
[ 그림 4 ] COVID-19 중증도에 영향을 주는 동반상병
whole group analysis except ischemic heart disease, history of ARF, liver cirrhosis, epilepsy,systemic connective tissue diseases, and neurosis.
7/15
https://jkms.org https://doi.org/10.3346/jkms.2020.35.e237 Underlying Comorbidities and COVID-19
Model Univariate Multivariable
Other diseases as covariates N/A No Yes
Variable selection N/A All All Backward Selection
Subpopulation 1 2 3 1 2 3 1 2 3 1 2 3
Other region Yes Yes No Yes Yes No Yes Yes No Yes Yes No
Daegu and Gyeonsangbuk-do (high regioinal outbreak) Yes No Yes Yes No Yes Yes No Yes Yes No Yes
Diabetes 0.737 0.426 1.254 1.314 1.206 1.255 1.216 1.300
IDDM 0.491 0.168 1.175
NIDDM without complication 0.745 0.428 1.278 1.170 1.343
NIDDM with complication 0.650 0.334 1.182 1.258
Osteoporosis 0.886 0.505 1.128 1.157 1.145
Isolated hypertension 0.656 0.400 0.915 0.885
Ischemic heart disease 0.444 0.275 0.684 0.780 0.750 0.806 0.803 0.842 0.789 0.829 Heart failure and cardiomyopathy 0.538 0.287 0.686 0.822
Cardiac arrhythmia 0.492 0.230 0.820 0.815 0.536 0.590 0.571
Chronic upper respiratory disease 0.774 0.689 0.905 0.793 0.903 1.160 0.903 1.162 Chronic lower respiratory disease 0.561 0.450 0.734 0.762 0.717 0.812 0.772 0.747 0.790 0.778 0.738 0.800 Environmental lung disease 0.250 0.099 0.407 0.536
Interstitial lung disease 0.219 0.076 0.490 0.494 0.223 0.547 0.233 0.547 0.221
Glomerular disease 0.592 0.271 1.381 1.372
History of acute renal failure 0.075 0.053 0.144 0.222 0.220 0.243 0.284 0.303 0.277 0.298 Chronic renal failure and ESRD 0.220 0.093 0.344 0.532 0.413 0.547 0.503 0.393 0.549 0.505 0.346 0.554 Liver cirrhosis 0.329 0.208 0.523 0.655 0.685 0.633 0.647 0.656 0.765 Non-infectious upper digestive system diseases 0.549 0.427 0.681 0.683 0.639 0.791 0.710 0.699 0.780 0.720 0.695 0.784 Non-infectious lower digestive system diseases 0.625 0.464 0.801 0.841 0.773 0.895 0.883 0.843 0.908 0.884 0.842 0.916 Pancreatic disease 0.231 0.196 0.335 0.473 0.515 0.477 0.525 0.582 0.527 0.531 0.573 0.525 Biliary disease 0.370 0.248 0.521 0.611 0.557 0.645 0.666 0.600 0.705 0.669 0.586 0.700
Alzheimer and degenerative disease 0.296 0.708
Epilepsy 0.552 0.345 0.786 0.701 0.742 0.758 0.738 0.758
Transient cerebral ischemia, Stroke, Hemorrhage 0.609 0.269 0.813 0.853 0.667 0.857 0.847 0.715 0.843 0.821 0.676 0.871
Dementia 0.760 0.286 0.621 0.734 0.694
Solid organ malignancy (except respiratory and thyroid) 0.328 0.232 0.532 0.748 0.754 0.682 0.675 0.742 0.699 0.644 0.742 Respiratory tract malignancy 0.209 0.172 0.345 0.651 0.624 0.634 Hematologic malignancy 0.133 0.069 0.319 0.393 0.353 0.236 0.375 0.234
Rheumatoid arthritis 0.687 1.207 1.361 1.238 1.400 1.244 1.335
Systemic connective tissue diseases 0.466 0.413 0.587 0.679 0.647 0.648 Anemia 0.520 0.324 0.643 0.789 0.775 0.774 0.851 0.798 0.854 0.835 0.801 Mental disorder of substance use 0.358 1.489 1.321 1.750 1.381 1.696 1.346 1.680 Schizophrenia 1.638 0.728 2.458 1.614 2.178 1.721 2.245 1.692 2.205
Mood disorder 0.697 0.420 0.760 0.824 0.824
Neurosis 0.701 0.484 0.814 0.894 0.872 0.882 0.919 0.852 0.895 0.854 Mental retardation and development disorder 1.983 2.372 1.511 1.943 1.717 1.668
Color OR No significant < 1.0 1.0 ≤, < 1.5 1.5 ≤, < 2.0 2.0 ≤, < 2.5 2.5 ≤, < 3.0 3.0 ≤
Fig. 3. Analysis of relationship between comorbidities and infection of COVID-19.
COVID-19 = coronavirus disease 2019, N/A = not applicable, IDDN = insulin-dependent diabetes mellitus, NIDDM = non-insulin dependent diabetes mellitus, ESRD = end-stage renal disease, OR = odds ratio.
Comorbidities associated with severity of COVID-19
Result of overall analysis
The ORs for the severity of COVID-19 according to the 56 categories of comorbidities are shown in Fig. 4 and Supplementary Table 7. Most disease categories except Cushing syndrome, chronic upper respiratory diseases, hepatitis C, hepatic failure, pancreatic diseases, multiple sclerosis, thyroid cancer, hematologic malignancy, rheumatoid arthritis, systemic connective tissue disease, substance use, mental retardation, and immune deficiency were associated with an increased risk of severe COVID-19 in univariate analysis. Isolated hypertension (ORR, 1.245–1.317), CRF and ESRD (ORR, 2.052–2.178) were significantly associated with an increased risk of severe COVID-19, while pancreatic diseases (ORR, 0.258–0.296), Alzheimer's and degenerative diseases (ORR, 0.693–0.701) were associated with a decreased risk of severe COVID-19 in all multivariate analysis. NIDDM without complication (ORR, 1.353–1.371), heart failure, and cardiomyopathy (ORR, 1.464–1.465), and cardiac arrhythmia (ORR, 1.400–1.405) showed an increased risk of severe COVID-19 in multivariate analysis with single disease category, while diabetes (OR, 1.247; 95% CI, 1.009–1.543), chronic respiratory diseases (ORR, 1.216–1.233) showed an increased risk of COVID-19 in multivariate analysis with all comorbidities.
Analysis of subpopulation which excluded high regional outbreak area (DG area) In multivariate analysis, dementia (ORR, 2.440–3.471) was significantly associated with severe COVID-19 in all multivariate analysis, while diabetes (ORR, 1.522–1.620), bone marrow dysfunction (ORR, 6.748–9.259) showed an increased risk of severe disease only in multivariate analysis with all comorbidities (Supplementary Table 8).
Analysis of subpopulation in high regional outbreak area (DG area)
In multivariate analysis, the overall pattern of association was consistent with the whole group analysis except diabetes, heart failure and cardiomyopathy, and chronic lower respiratory disease (Supplementary Table 9).
10/15
https://jkms.org https://doi.org/10.3346/jkms.2020.35.e237 Underlying Comorbidities and COVID-19
Color OR No significant < 1.0 1.0 ≤, < 1.5 1.5 ≤, < 2.0 2.0 ≤, < 2.5 2.5 ≤, < 3.0 3.0 ≤
Model Univariate Multivariable
Other diseases as covariates N/A No Yes
Variable selection N/A All Backward Selection All Backward Selection
Subpopulation 1 2 3 1 2 3 1 2 3 1 2 3 1 2 3
Other region Yes Yes No Yes Yes No Yes Yes No Yes Yes No Yes Yes No
Daegu and Gyeonsangbuk-do (high regional outbreak) Yes No Yes Yes No Yes Yes No Yes Yes No Yes Yes No Yes
Diabetes 4.646 4.833 3.883 1.247 1.620 1.522
IDDM 4.631 8.453 3.247
NIDDM without complication 4.077 4.224 3.398
NIDDM with complication 5.625 6.681 4.4641.371 1.333 1.353
Isolated hypertension 6.054 5.665 5.3421.313 1.298 1.312 1.298 1.245 1.317 1.272 Heart failure and cardiomyopathy 7.372 8.872 5.8881.465 1.464 2.359
Cardiac arrhythmia 5.1772.8574.7891.405 1.601 1.400 1.601 1.516 1.578
Chronic lower respiratory disease 2.474 2.324 2.251 1.216 1.233
Chronic renal failure and ESRD 8.204 12.939 5.9712.052 2.015 2.178 1.994 2.110 2.141 2.095 2.124
Pancreatic disease 0.274 0.229 0.290 0.240 0.258 0.183 0.296 0.261
Alzheimer and degenerative disease 3.613 6.1682.569 0.693 0.601 0.701 0.602 0.699 0.633 0.693 0.612
Dementia 8.257 15.332 5.759 2.665 2.440 3.471 2.870
Bone marrow dysfunction 2.7707.631 9.259 6.748
Mental disorder of substance use 0.521
Fig. 4. Analysis of relationship between comorbidities on severity of COVID-19.
COVID-19 = coronavirus disease 2019, N/A = not applicable, IDDN = insulin-dependent diabetes mellitus, NIDDM = non-insulin dependent diabetes mellitus, ESRD = end-stage renal disease, OR = odds ratio.
46
HIRA 빅데이터 브리프
[ 표 1 ] COVID-19 확진자와 COVID-19 음성대조군의 기초특성비교
Variables Cases (n = 7,341) Controls (n = 212,620) P value
Demographic characteristics Sex, male 2,970 (40.5) 101,361 (47.7) < 0.001 Age, yr 47.05 ± 19.0 49.48 (±19.9) < 0.001 18-49 3,819 (52.0) 113,734 (53.5) 50-64 2,159 (29.4) 44,652 (21.0) 65-79 992 (13.5) 34,080 (16.0) ≥ 80 373 (5.1) 20,154 (9.5) Residence DG area 4,027 (54.9) 31,259 (14.7) < 0.001 Except DG 3,314 (45.1) 181,361 (85.3)
Charlson comorbidity index 1.23 ± 1.6 1.94 ± 2.4 < 0.001
Healthcare utilization within 1 years before diagnosis of COVID-19
No. of hospitalization 0.25 ± 0.9 0.83 ± 2.1 < 0.001
No. of outpatient visit 17.19 ± 21.4 25.46 ± 31.9 < 0.001
No. of ED visit 0.12 ± 0.5 0.44 ± 1.6 < 0.001 Medical aids 619 (8.4) 12,031 (5.7) < 0.001 Underlying diseases Endocrinopathy Diabetes 1,043 (14.2) 39,037 (18.4) < 0.001 Thyroid disease 434 (5.9) 13,491 (6.4) 0.134 Cushing syndrome 2 (0.03) 215 (0.1) 0.047 Osteoporosis 633 (8.6) 20,467 (9.6) 0.004 Cardiac disease Isolated hypertension 1,628 (22.2) 64,412 (30.3) < 0.001
Ischemic heart disease 306 (4.2) 18,971 (8.9) < 0.001
Heart failure and cardiomyopathy 266 (3.62) 13,881 (6.5) < 0.001
Valvular heart disease 28 (0.4) 1,960 (0.9) < 0.001
Cardiac arrhythmia 201 (2.7) 11,517 (5.4) < 0.001
Chronic respiratory disease
Chronic upper respiratory disease 4,430 (60.4) 140,924 (66.3) < 0.001
Chronic lower respiratory disease 1,639 (22.3) 72,058 (33.9) < 0.001
Environmental lung disease 11 (0.2) 1,267 (0.6) < 0.001
Interstitial lung disease 12 (0.2) 1580 (0.7) < 0.001
Chronic respiratory failure and
1 (0.01) 261 (0.1) 0.008
diaphragm palsy
Pulmonary vascular disease 11 (0.2) 1,279 (0.6) < 0.001
Renal disease and ESRD
Hypertensive renal disease 19 (0.3) 1,611 (0.8) < 0.001
Glomerular disease 76 (1.0) 3,690 (1.7) < 0.001
Renal tubule-interstitial disease 37 (0.5) 1,811 (0.9) 0.001
History of acute renal failure 6 (0.1) 2,282 (1.1) < 0.001
Chronic renal failure and ESRD 72 (1.0) 9,149 (4.3) < 0.001
Urolithiasis 85 (1.2) 3,814 (1.8) < 0.001
Viral hepatitis and chronic liver disease
47
I. 보건의료 빅데이터 동향 Ⅱ. 보건의료 빅데이터 분석 사례 Ⅲ. 전문가 기고HCV, acute and chronic 17 (0.2) 954 (0.5) 0.006
Non-B, non-C hepatitis 612 (8.3) 22,196 (10.4) < 0.001
Liver cirrhosis 44 (0.6) 3,833 (1.8) < 0.001
Hepatic failure 6 (0.1) 751 (0.4) < 0.001
Disease of digestive system
Non-infectious disease of upper digestive system 6,388 (87.0) 196,527 (92.4) < 0.001
Non-infectious disease of lower digestive system 2,013 (27.4) 80,096 (37.7) < 0.001
Pancreatic disease 40 (0.5) 4,933 (2.3) < 0.001
Biliary disease 129 (1.8) 9,813 (4.6) < 0.001
Chronic neurologic disease
Systemic atrophy 3 (0.04) 320 (0.2) 0.016
Parkinsonism and movement disorder 265 (3.6) 8,890 (4.2) 0.016
Alzheimer and degenerative disease 207 (2.8) 9,266 (4.4) < 0.001
Multiple sclerosis 6 (0.08) 190 (0.09) 0.830
Epilepsy 131 (1.8) 6,776 (3.2) < 0.001
Transient cerebral ischemia
487 (6.6) 22,223 (10.5) < 0.001
Stroke, cerebral hemorrhage
Dementia 368 (5.0) 13,809 (6.5) < 0.001
Malignancy
Solid organ, except respiratory, thyroid 223 (3.0) 18,556 (8.7) < 0.001
Respiratory tract 28 (0.4) 3,822 (1.8) < 0.001 Thyroid cancer 80 (1.1) 2,473 (1.2) 0.564 Hematologic 8 (0.1) 1,731 (0.8) < 0.001 Rheumatologic disease Rheumatoid arthritis 186 (2.5) 5,853 (2.8) 0.259 SLE 0 (0.0) 0 (0.0)
Systemic connective tissue disease 39 (0.5) 2,410 (1.1) < 0.001
Hematologic disease
Anemia 505 (6.9) 26,462 (12.5) < 0.001
Coagulopathy 35 (0.5) 2,839 (1.3) < 0.001
Bone marrow dysfunction 24 (0.3) 2,298 (1.1) < 0.001
Obesity 3 (0.04) 339 (0.2) 0.011
Nutritional deficiency 287 (3.9) 15,128 (7.1) < 0.001
Mental and Behavioral disorders
Substance use 86 (1.2) 2,504 (1.2) 0.962
Schizophrenia 263 (3.6) 4,717 (2.2) < 0.001
Mood disorder 769 (10.8) 31,575 (14.9) < 0.001
Neurosis 931 (12.7) 36,488 (17.2) < 0.001
Personality disorder 13 (0.2) 415 (0.2) 0.729
Mental retardation, development disorder 37 (0.5) 542 (0.3) < 0.001
Immune deficiency, HIV infection 4 (0.1) 320 (0.2) 0.035
Data are presented as mean ± standard deviation or number (%).
DG = Daegu city and Gyeongsangbuk-do province area, COVID-19 =
coronavi-rus disease 2019, ESRD = end-stage renal disease, HBV = hepatitis B vicoronavi-rus, HCV
= hepatitis C virus, SLE = systemic lupus erythematosus, HIV = human
immu-nodeficiency virus.
48
HIRA 빅데이터 브리프
[ 표 2 ] COVID-19 확진자중 중증환자와 경증환자의 기초특성
Variables Severe (n = 954) Non-Severe (n = 6,387) P value
Demographic characteristics Sex, male 458 (48.1) 2,512 (39.3) < 0.001 Age, yr 67.01 ± 15.1 44.07 ± 17.7 < 0.001 18-49 99 (10.4) 3,720 (58.2) 50-64 295 (30.9) 1,862 (29.2) 65-79 350 (36.7) 642 (10.1) ≥ 80 210 (22.0) 163 (2.6) Residence DG area 710 (74.4) 3,317 (51.9) < 0.001 Except DG 244 (25.6) 3,070 (48.1)
Charlson comorbidity index 2.68 (± 2.2) 1.01 (± 1.4) < 0.001
Healthcare utilization within 1 years before diagnosis of COVID-19
No. of hospitalization 0.67 (± 1.5) 0.19 (± 0.8) < 0.001
No. of outpatient visit 29.44 (± 35.3) 15.36 (± 17.7) < 0.001
Number of ED visit 0.25 (± 0.7) 0.10 (± 0.4) < 0.001 Medical aids 120 (12.6) 499 (7.8) < 0.001 Underlying diseases Endocrinopathy Diabetes 346 (36.3) 697 (10.9) < 0.001 Thyroid disease 89 (9.3) 345 (5.4) < 0.001 Cushing syndrome 1 (0.1) 1 (0.02) 0.120 Osteoporosis 184 (19.3) 449 (7.0) < 0.001 Cardiac disease Isolated hypertension 531 (55.7) 1,097 (17.2) < 0.001
Ischemic heart disease 115 (12.1) 191 (3.0) < 0.001
Heart failure and cardiomyopathy 131 (13.7) 135 (2.1) < 0.001
Valvular heart disease 9 (0.9) 19 (0.3) 0.007
Cardiac arrhythmia 84 (8.8) 117 (1.8) < 0.001
Chronic respiratory disease
Chronic upper respiratory disease 589 (61.7) 3,841 (60.1) 0.345
Chronic lower respiratory disease 364 (38.2) 1,275 (20.0) < 0.001
Environmental lung disease 7 (0.7) 4 (0.1) < 0.001
Interstitial lung disease 10 (1.1) 2 (0.03) < 0.001
Chronic respiratory failure and
0 (0.0) 1 (0.02) 1
Diaphragm palsy
Pulmonary vascular disease 4 (0.4) 7 (0.1) 0.044
Renal disease and ESRD
Hypertensive renal disease 7 (0.7) 12 (0.2) 0.008
Glomerular disease 22 (2.3) 54 (0.9) < 0.001
Renal tubule-interstitial disease 12 (1.3) 25 (0.4) 0.002
History of acute renal failure 0 (0.0) 6 (0.1) 1.000
Chronic renal failure and ESRD 39 (4.1) 33 (0.5) < 0.001
Urolithiasis 19 (2.0) 66 (1.0) 0.010
49
I. 보건의료 빅데이터 동향 Ⅱ. 보건의료 빅데이터 분석 사례 Ⅲ. 전문가 기고HBV, acute and chronic 26 (2.7) 89 (1.4) 0.002
HCV, acute and chronic 4 (0.4) 13 (0.2) 0.264
Non-B, non-C hepatitis 129 (13.5) 483 (7.6) < 0.001
Liver cirrhosis 14 (1.5) 30 (0.5) < 0.001
Hepatic failure 2 (0.2) 4 (0.1) 0.178
Disease of digestive system
Non-infectious disease of upper digestive system 879 (92.1) 5,509 (86.3) < 0.001
Non-infectious disease of lower digestive system 418 (43.8) 1,595 (25.0) < 0.001
Pancreatic disease 6 (0.6) 34 (0.5) 0.705
Biliary disease 42 (4.4) 87 (1.4) < 0.001
Chronic neurologic disease
Systemic atrophy 0 (0.0) 3 (0.1) 1.000
Parkinsonism and movement disorder 72 (7.6) 193 (3.0) < 0.001
Alzheimer and degenerative disease 70 (7.3) 137 (2.1) < 0.001
Multiple sclerosis 2 (0.2) 4 (0.1) 0.178
Epilepsy 35 (3.7) 96 (1.5) < 0.001
Transient cerebral ischemia
184 (19.3) 303 (4.7) < 0.001
Stroke, cerebral hemorrhage
Dementia 186 (19.5) 182 (2.9) < 0.001
Malignancy
Solid organ, except respiratory, thyroid 70 (7.3) 153 (2.4) < 0.001
Respiratory tract 15 (1.6) 13 (0.2) < 0.001 Thyroid cancer 12 (1.3) 68 (1.1) 0.592 Hematologic 2 (0.2) 6 (0.1) 0.279 Rheumatologic disease Rheumatoid arthritis 33 (3.5) 153 (2.4) 0.051 SLE 0 (0.0) 0 (0.0)
Systemic connective tissue disease 7 (0.7) 32 (0.5) 0.356
Hematologic disease
Anemia 140 (14.7) 365 (5.7) < 0.001
Coagulopathy 9 (0.9) 26 (0.4) 0.039
Bone marrow dysfunction 7 (0.7) 17 (0.3) 0.029
Obesity 0 (0.0) 3 (0.1) 1.000
Nutritional deficiency 69 (7.2) 218 (3.4) < 0.001
Mental and Behavioral disorders
Substance use 15 (1.6) 71 (1.0) 0.217
Schizophrenia 51 (5.4) 212 (3.3) 0.002
Mood disorder 203 (21.3) 593 (9.3) < 0.001
Neurosis 228 (23.9) 703 (11.0) < 0.001
Personality disorder 5 (0.5) 8 (0.1) 0.019
Mental retardation, Development disorder 4 (0.4) 33 (0.5) 1.000
Immune deficiency, HIV infection 1 (0.1) 3 (0.1) 0.427