저작자표시-비영리-변경금지 2.0 대한민국 이용자는 아래의 조건을 따르는 경우에 한하여 자유롭게 l 이 저작물을 복제, 배포, 전송, 전시, 공연 및 방송할 수 있습니다. 다음과 같은 조건을 따라야 합니다: l 귀하는, 이 저작물의 재이용이나 배포의 경우, 이 저작물에 적용된 이용허락조건 을 명확하게 나타내어야 합니다. l 저작권자로부터 별도의 허가를 받으면 이러한 조건들은 적용되지 않습니다. 저작권법에 따른 이용자의 권리는 위의 내용에 의하여 영향을 받지 않습니다. 이것은 이용허락규약(Legal Code)을 이해하기 쉽게 요약한 것입니다. Disclaimer 저작자표시. 귀하는 원저작자를 표시하여야 합니다. 비영리. 귀하는 이 저작물을 영리 목적으로 이용할 수 없습니다. 변경금지. 귀하는 이 저작물을 개작, 변형 또는 가공할 수 없습니다.
A THESIS
FOR THE DEGREE OF MASTER OF SCIENCE
Protective effect of a freshwater algae Spirogyra sp.
against skin aging induced by ultraviolet-B
irradiation
Lei Wang
Department of Marine Life Science
GRADUATE SCHOOL
JEJU NATIONAL UNIVERSITY
CONTENTS
ABSTRACT ... 1
LIST OF FIGURES ... 2
LIST OF TABLES ... 8
1. INTRODUCTION ... 9
2. METERIALS AND METHODS ... 15
2.1. Chemicals and reagents ... 15
2.2. Sample collection and pre-processing ... 16
2.3. Extraction of 70% crude ethanol extract ... 16
2.4. Sample preparation ... 18
2.5. Determination of total phenolic content of samples ... 18
2.6. Determination of DPPH radical scavenging activity of samples ... 19
2.7. Determination of alkyl radical scavenging activity of samples ... 19
2.8. Determination of hydroxyl radical scavenging activity of samples ... 20
2.9. Determination of hydrogen peroxide scavenging activity of samples ... 20
2.10. Determination of ABTS radical scavenging activity of SPE by on-line High Performance Liquid Chromatography (HPLC) system ... 21
2.11. Cell culture ... 22
2.12. Determination of cytotoxicity of samples in HaCaT cells ... 22
2.13. Determination of intracellular ROS generation induced by UV-B irradiation in HaCaT cells ... 23
2.14. Determination of cytoprotective effect of samples against UV-B irradiation in HaCaT cells ... 23
2.15. Fractionation of SPE using different solvents ... 24
2.16. Determination of ABTS radical scavenging activity of SPEE by on-line HPLC system ... 24
2.17. Determination of apoptotic body formation by nuclear staining with Hoechest
33342. ... 25
2.18. Cell cycle analysis ... 26
2.19. Origin and maintenance of parental zebrafish... 26
2.20. Determination of UV-B protection effect of SPEE in vivo / in zebrafish mode ... 27
2.21. Optimisation the Centrifugal Partition Chromatographic solvent system ... 27
2.22. Seperation of active compounds from SPEE by CPC ... 28
2.23. Analysis of fractions collected by CPC using HPLC ... 29
2.24. NMR spectroscopy of the target compounds ... 29
2.25. Statistical analysis ... 30
3. RESULTS AND DISCUSSION ... 31
3.1. Sample extraction - 70% crude ethanol extract (SPE) ... 31
3.2. Total phenolic content of SPE ... 31
3.3. Free radical and hydrogen peroxide scavenging activity of SPE ... 33
3.4 . On-line HPLC analysis of SPE ... 39
3.5. Cytotoxicity of SPE in HaCaT cells ... 41
3.6. Intracellular ROS scacvenging activity of SPE in HaCaT cells ... 43
3.7. Cytoprotective effect of SPE against UV-B irradiation in HaCaT cells ... 45
3.8. Fractionation of SPE using different solvents ... 47
3.9. Total phenolic contents of each fractions of SPEE ... 49
3.10. Free radicals and hydrogen peroxide scavenging activities of SPEE ... 51
3.11. On-line HPLC analysis of SPEE ... 57
3.12. Cytotoxicity analysis of SPEE in HaCaT cells ... 59
3.13. Intracellular ROS sacvenging activity of SPEE in HaCaT cells ... 61
3.14. Cytoprotective effect of SPEE against UV-B irradiation in HaCaT cells ... 63
3.16. Cell cycle analysis ... 67
3.17. Determination of ROS generation induced by UV-B irradiation in zebrafish 69 3.18. Optimisation of the Centrifugal Partition Chromatographic solvent system .. 71
3.19. Seperation bioactivity compounds from SPEE by CPC... 73
3.20. Analysis of the fractions collected by CPC using HPLC ... 75
3.21. Free radicals and hydrogen peroxide scavenging activities of the tragets fractions collected by CPC. ... 78
3.22.NMR spectroscopy of the target compound ... 84
4. CONCLUSION ... 87
REFERENCES ... 88
1
Abstract
Spirogyra sp. a freshwater algae, was collected during Januray to March in Kongju,
South Korea. The lyophilized sample was extracted by 70% ethanol and obtained the 70% ethanol crude extract (SPE). The free radical scavenging activities and protective effects against skin aging induced by UV-B irradiation of SPE were evaluated in vitro on HaCaT cell line. The results suggests that SPE have protective effects against skin aging. Then, SPE was fractionated by organic solvets based on polarity. The ethyl actate fraction (SPEE) was found to contain a higher phenolic content than the other fractions, so it was selected for futher studies. The protective effects of SPEE against skin aging induced by UV-B irradiation were evaluated in vitro on HaCaT cell line and in vivo on zebrafish model. Anti-aging compounds of SPEE were seperated by one step using preparative centrifugal partition chromatography (CPC). This study suggests that Spirogyra sp. was rich in phenolic content and have strong radical scavenging activities and anti-UV-B irradiation activity. It has the potential to be used as a promising ingredient in cosmetic industry.
2
List of figures
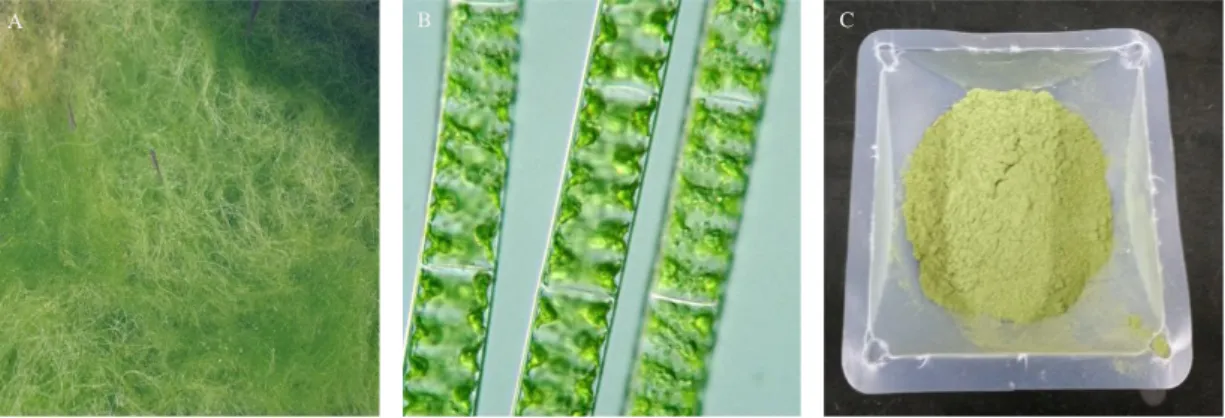
Fig. 1. The photograph of Spirogyra sp.. A. Spirogyra sp. in the shallow pond.
B. Spirogyra sp. at microscope. C. The lyophilized powder of Spirogyra sp.
Fig. 2. The extraction procedure. Lyophilized algae was extracted with 70% EtOH, and concentrated by using rotary evaporator at a low pressure. The crude extract named as SPE.
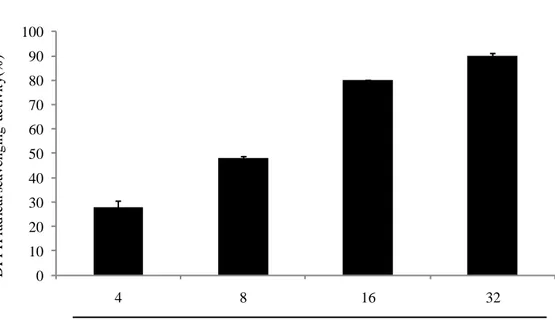
Fig. 3. DPPH radical scavenging activity of SPE. DPPH radical scavenging activity was determined by ESR. Experiments were performed in triplicate and the data are expressed as mean ± SE.
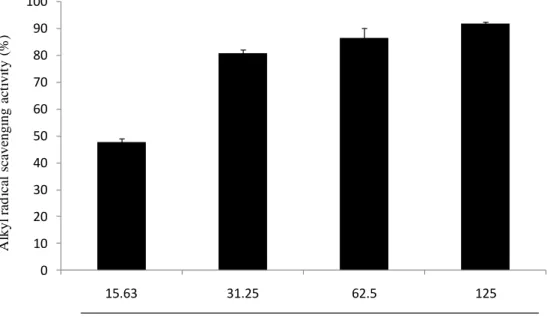
Fig. 4. Alkyl radical scavenging activity of SPE. Alkyl radical scavenging activity was determined by ESR. Experiments were performed in triplicate and the data are expressed as mean ± SE.
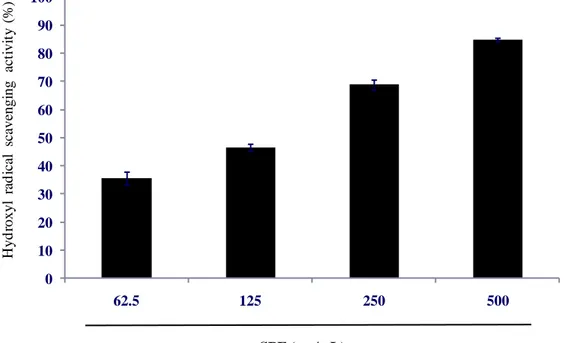
Fig. 5. Hydroxyl radical scavenging activity of SPE. Hydroxyl radical scavenging activity was determined by ESR. Experiments were performed in triplicate and the data are expressed as mean ± SE.
Fig. 6. Hydrogen peroxide scavenging activity of SPE. Hydrogen peroxide
scavenging activity was determined by colorimetric method. Experiments were performed in triplicate and the data are expressed as mean ± SE.
Fig. 7. On-line HPLC analysis of SPE. (A) HPLC chromatogram, (B) ABTS+
absorption sepectrum. Colunm: Atalantis T3 3 μm ODS column (3.0 × 150 mm i.d.); mobile phase: acetonitrile-distilled water solvent system (0-10 min: 0:100 v/v; 10-30
3
min: 25:75 v/v ; 30-80 min: 50:50 v/v ; 80-90 min: 100:0 v/v; 90-110 min: 100:0 v/v); flow rate 0.3 mL/min ; detected wave length was 220 nm. ABTS solution eluted at flow rate 1.0 mL/min and measured as negative peak by UV/Vis detector at a wave length of 680 nm.
Fig. 8. Cell viability of HaCaT cells after treated SPE. HaCaT cells were seeded in
96-well plate at a concentration of 1.0 × 10⁵ cells/mL. Cell viability was determined
by MTT assay. Experiments were performed in triplicate and the data are expressed as mean ± SE.
Fig. 9. Intracellular ROS scavenging activity of SPE in HaCaT cells, HaCaT cells
were seeded into a 24-well plate at a concentration of 2.0 × 10⁵ cells/mL. Cellular
ROS level were determined by DCF-DA analysis. Experiments were performed in triplicates and the data are expressed as mean ± SE. * p<0.05.
Fig. 10. Cytoprotective effect of SPE in HaCaT cells. HaCaT cells were seeded into a
24-well plate at a concentration of 2.0 × 10⁵ cells/mL. Cell damage degree and
viability were determined by LDH and MTT analysis. (A): LDH release level, (B): cell viability. Experiments were performed in triplicate and the data are expressed as mean ± SE. * p<0.05. ** p<0.001.
Fig. 11. The procedure of fractionation of SPE using different solvents. After fractionation, the 4 fractions were collected and named as SPEH, SPEC, SPEE and SPEW respectively.
Fig. 12. DPPH radical scavenging activity of SPEE. DPPH radical scavenging activity was determined by ESR. Experiments were performed in triplicate and the data are expressed as mean ± SE.
4
Fig. 13. Alkyl radical scavenging activity of SPEE. Alkyl radical scavenging activity was determined by ESR. Experiments were performed in triplicate and the data are expressed as mean ± SE.
Fig. 14. Hydroxyl radical scavenging activity of SPEE. Hydroxyl radical scavenging activity was determined by ESR. Experiments were performed in triplicate and the data are expressed as mean ± SE.
Fig. 15. Hydrogen peroxide scavenging activity of SPEE. Hydrogen peroxide scavenging activity was determined by colorimetic method. Experiments were performed in triplicate and the data are expressed as mean ± SE.
Fig. 16. On-line HPLC analysis of SPEE. (A) HPLC chromatogram, (B) ABTS+
absorption sepectrum. Colunm: SunFire 5μm ODS column (4.6 × 250 mm i.d.); mobile phase: acetonitrile-distilled water solvent system(0-10 min: 20:80 v/v; 10-30 min: 25:75 v/v ; 30-50 min: 27:73 v/v ; 50-60 min: 30:70 v/v; 60-70 min:50:50 v/v; 70-80 min:100:0 v/v); flow rate 1.0 mL/min; detected wave length was 290 nm. ABTS solution eluted at flow rate 1.0 mL/min and measured as negative peak by UV/Vis detector at a wave length of 680 nm.
Fig. 17. Cytotoxicity analysis of SPEE. HaCaT cells were seeded in 96-well plate at a
concentration of 1.0 × 10⁵ cells/mL. Cell viability was determined by MTT assay.
Experiments were performed in triplicate and the data are expressed as mean ± SE.
Fig. 18. Intracellular ROS sacvenging activity of SPEE in HaCaT cells. HaCaT cells
were seeded in a 24-well plate at a concentration of 2.0 × 10⁵ cells/mL. Cellular ROS
level was determined by DCF-DA analysis. Experiments were performed in triplicate and the data are expressed as mean ± SE. * p<0.05.
5
Fig. 19. Cytoprotective effect of SPEE in HaCaT cells. HaCaT cells were seeded in a
24-well plate at a concentration of 2.0 × 10⁵ cells/mL. Cell damage degree and
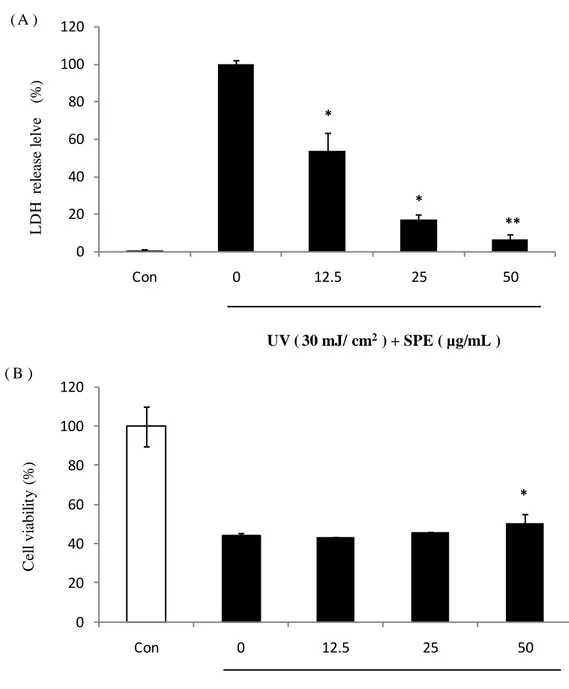
viability were determined by LDH and MTT analysis. (A): LDH release level, (B): cell viability. Experiments were performed in triplicate and the data are expressed as mean ± SE. * p<0.05.
Fig. 20. Apototic body formation under UV-B irradiation. HaCaT cells were seeded
in a 24-well plate at a concentration of 2.0 × 10⁵ cells/mL. After 24 h incubation cells
were pretreated with sample. After 2 h incubation, cells were exposed to 30 mJ/cm2
UV-B and incubated 6 h. After incubation, cells were stained with Hoechest 33342, then, the nuclear morphology of cells were examined by microscope.
Fig. 21. Cell cycle analysis. HaCaT cells were seeded in a 24-well plate at a
concentration of 2.0 × 10⁵ cells/mL. After 24 h incubation cells were pretreated with
sample. After 2 h incubation, cell were exposed to 30 mJ/cm2 UV-B and incubated 6
h. After incubation, cells were collected and fixed by 70 % ethanol, Then the cells were incubated in dark with 1 mL EDTA which contained 100 μg PI and 100 μg Rnase A for 30 min at 37 ℃. Cell cycle analysis was conducted with FACS calibur flow cytometer.
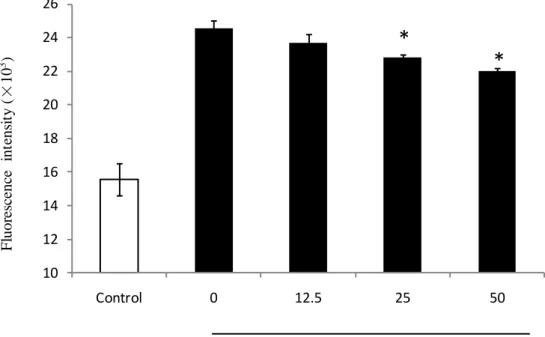
Fig. 22. ROS generation in SPEE pre-treated zebrafish. The 2 dpf zebrafish embryos were used for the anti-UV-B study. At 2 dpf, the embryos were treated with sample.
After 1 hour, the embryos were exposed to 50 mJ/cm2 UV-B per individual. After
irradiating embryos with UV-B, the embryos were treated with DCFH-DA solution (20 μg/mL) and incubated for 1 hour in the dark at 28.5°C. After anesthetized, the embyros were photographed under the microscope. The individual zebrafish larvae fluorescence intensity was quantified using an image J program. (A): The phptograph
6
under fluorescence microscop, (B): The level of ROS generation in zebrafish. Experiments were performed in triplicates and data were expressed as mean ± SE. * p<0.05.
Fig. 23. The HPLC chromatogram of SPEE. Colunm: SunFire 5μm ODS column (4.6 × 250 mm i.d.); mobile phase: acetonitrile-distilled water solvent system(0-10 min: 20:80 v/v; 10-30 min: 25:75 v/v ; 30-50 min: 27:73 v/v ; 50-60 min: 30:70 v/v; 60-70 min:50:50 v/v; 70-80 min:100:0 v/v); flow rate 1.0 mL/min; detected wave length was 290 nm.
Fig. 24. The CPC chromatogram of SPEE. Solvent condition: stationary phase, bottom aqueous; mobile phase, top organic phase; rotation speed: 1000 rpm; flow rate: 2 mL/min; sample: a weight of 500 mg of sample dissolved in 6 mL misture of top and bottom phases (1:1,v/v) of the solvent system; UV detector at a wave length of 254 nm; fractions from the CPC were collected in to text tubes using a fraction collector.
Fig. 25. Analysis of the fractions collected by CPC using HPLC (A) SPEE, (B) traget-1,(C) traget-2, (D) traget-3, (E) traget-4, (F) traget-5, (G) traget-6, (H) traget-7.
Fig. 26. The chemical structure of gallic acid and methyl gallate. (A) Gallic acid, (B) methyl gallate.
Fig. 27. DPPH radical scavenging activity of SPE. DPPH radical scavenging activity was determined by ESR. Experiments were performed in triplicates and data are expressed as mean ± SE.
7
Fig. 28. Alkyl radical scavenging activity of SPE. Alkyl radical scavenging activity was determined by ESR. Experiments were performed in triplicates and the data are expressed as mean ± SE.
Fig. 29. Hydroxyl radical scavenging activity of SPE. Hydroxyl radical scavenging activity was determined by ESR. Experiments were performed in triplicate and the data are expressed as mean ± SE.
Fig. 30. Hydrogen peroxide scavenging activity of SPE. Hydrogen peroxide scavenging activity was determined by colorimetric method. Experiments were performed in triplicate and the data are expressed as mean ± SE.
Fig. 31. Proton NMR spectrum of traget-1.
8
List of tables
Table 1. The yield and total phenolic content of Spirogyra sp. 70% EtOH extract
Table 2. IC50 values of free radicals and hydrogen peroxide scavenging activities of
SPE
Table 3. The yield and total phenolic content of each fractions of SPE
Table 4. IC50 values of free radicals and hydrogen peroxide scavenging activities of
SPE and SPEE
Table 5. Determination of partition coefficent of each and every peak appear in HPLC chromatogram between top phase and bottom phase of different types of CPC solvent system
Table 6. IC50 values of free radicals and hydrogen peroxide scavenging activities of
9
1. Introduction
Microalgae are a group of algae that grows in freshwater and marine eco-systems. They are also being cultured in freshwater or seawater conditions mainly for the purpose of industrial or academic research. Microalgae are unicellular organisms that can exist individually, or in chains or groups. Microalgae have been found to produce a variety of primary and secondary metabolites similer to that of plants. Because they produce a variety of secondary metabolites, they are being utilized in many kinds of areas such as biodiesel production, phamaceutical applications and functional food applications. Extensive research have been carried out about biodiesel production using microalgae during the past few decades (Li Y et al., 2008, Li Y et al, 2008, Sheehan J et al., 1998). This has become an interesting area of research due to the higher consumption and reduction of natural oil resource worldwide. Secondary metabolites synthesized by microalgea that includes sterols, fatty acids, polyphenols and terpenoids have been found to indicate antioxidant, anticancer, antiflammatory and a range of other bioactivities (VALERIE J. PAUL et al., 1986, Zhongshan Zhang et al., 2010). According to Mayalen Zubia, phenolic content and antioxidant activities of 48 species of marine microalgae were evaluated. Some research suggest that some microalgae which were rich in phenolic composition have a good antioxidant activities (Mayalen Zubia et al., 2007). Many studies have focused on the use of microalgae as functional food material and according to several reports many microalgae had been used as ingredients in food items (Merichel Plaza et al., 2008). Due to the fact that microalgae indicates potential biological functionalities they are attaining an increased interest in a various type of research areas as potential candidates for pharmaceutical, functional food and other industrial applications.
10
Spirogyra sp. is a freshwater green alga that commonly inhabit freshwater areas such
as shallow ponds. There are more than 400 species of Spirogyra organisms, such as
Spirogyra charophyta, Spirogyra zygenmaceae, Spirogyra acumbentis and other
species. Morphologically, Spirogyra sp. are filamentous and exists in shallow ponds. Because of the special structure characteristic of Spirogyra sp., they were used as a biosorbent to remove heavy metal ions from wastewaters. Many research demonstrates that Spirogyra sp. is capable of absorbing and accumulating heavy metals like plumbum, chromium, copper, zinc and fluorides (V.K. Gupta et al., 2006, V.K. Gupta et al., 2006, V.K. Gupta et al., 2001, N.R. Bishnoi et al., 2005, S. Venkatamohan et al., 2007). Many research reports the use of Spirogyra sp. as a material in producing bioenergy. Fuad Salem Eshaq et al. cultured and used
Spirogyra sp. as a material for the production of biofuel (Fuad Salem Eshaq et al.,
2010). According to Rameshprabu Ramaraj et al., Spirogyra ellipsospora was cultured and used for the production of biogas by anaerobic fermentation (Rameshprabu Ramaraj et al., 2015). The chemical composition of Spirogyra sp. indicates a great diversity such as sterols, pigments, carbohydrates, monosaccharides, polysaccharides, and other compounds (Maya Iv. Mitova et al.,1999). Several of these compounds have been used in medical and functional food areas. Ji-Hyeok Lee et al. isolated two phenolic compounds that includes gallic acid and methyl gallate from
Spirogyra sp. and evaluated the protective effects of Spirogyra sp. against lipid
peroxidation (Ji-Hyeok Lee et al., 2015). Nalea Kang et al. investigated the effects of
Spirogyra sp. to improve cardiovascular diseases (Nalae Kang, et al., 2015). Several
research suggest the use of Spirogyra sp. as a potential ingredient in biomedical research that can be used in pharmaceutical and functional food applications.
11
Fig. 1. The photograph of Spirogyra sp.. A. Spirogyra sp. in the shallow pond.
B. Spirogyra sp. at microscope. C. The lyophilized powder of Spirogyra sp.
12
Oxidative stress, is a state in which there is an imbalance between cellular pro-oxidant and antioxidant levels. In aerobic organisms, reactive oxygen species (ROS) are the most abundant pro-oxidant generated due to the body respiration and metabolism (E.Herrero et al., 2008, Kasidit Rattanawong et al., 2015). ROS, such as superoxide
anion radical (O2-), hydrogen peroxide peroxide (H2O2), hydroxyl radical (OH-) and
singlet oxygen (1O2), plays an important role in oxidative stress (S.S. Gill et al., 2010).
The effects of ROS can be thought of as a double-edged sword, whereas on the one hand it reduces the amount of intracellular ROS that regulate cellular functions, and as on the other hand, it induces oxidative stress (Guan-qun Chen et al., 2015). Normally, it is a dynamic balance between ROS generation and degradation in the normal physiological condition of human bodies because of the endogenic antioxidant system of cells. But in some pathological conditions, this balance will be broken. Cells generated and accumulated with many ROS are central to oxidative stress-related metabolism (Guan-qun Chen et al., 2015). Overproduction of ROS induces oxidative stress. Because of ROS damage many cellular composition and cellular structures, including DNA, proteins, lipids and cell membranes. Thus, ROS have been found to induce a large number of disease conditions such as cancer, inflammation, aging and some metabolic syndromes (Hyemin Kim et al., 2013, Mingjing Gao et al., 2015, Nassima Chaher et al., 2016). Because of the imbalance of ROS generation and degration that brings harmful effects on human bodies, more researchers are interested in funding ROS scavengers as exogenous antioxidants to scavenge spare ROS generated in cells due to some pathological conditions.
13
Ultraviolet (UV), is a natural component of sunlight. It is an electromagnetic radiation spanning within the wavelength region from 400 nm to 100 nm. Normally, it is invisible and can be separate to 3 subtypes based on the wavelength. The wavelength region from 320 to 400 nm can be called UV-A, the wavelength region from 280 to 320 nm is UV-B and wavelength region from 100 to 280 nm is UV-C (Song-Zhi Kong et al., 2015). From this three subtypes, UV-B is the one which attract more attention that brings stress to plants and animals including human (Moirangthem Kameshwor Singh et al., 2015). Of this three subtypes of UV, UV-B is the one that have a medium wavelength which plays an important role in skin aging and some skin diseases. UV-B irradiation can directly damage the epidermis of skin by inducing cellular ROS generation and damage cellular compositions and structures such as protein, lipid, DNA. Normally, most of UV-B coming from sunlight can be abosorbed by the ozone layer. But, the ozone layer is becoming thinner due to anthropogenic activities. Nowadays, the UV-B irradiation intensities in the biosphere has increased compared with previous times (Meiling Liu, et al., 2015). With increased amounts of UV-B irradiation in biosphere, there is increased issues. For humans, it already become one of a serious threat for their health.
Human, skin is one of the most important organ in the body because of its important protective functions. Skin plays a protective function in the human bodies. Aging is a serious and prominent problem of skin (Sushil Raut et al., 2012). The factors which induced skin aging can be distinguished as two types based on the characteristics of those factors as intrinsic and extrinsic factors (Farage et al., 2008, A. Kammeyer and R.M.Luiten, 2015). All of those factors are leading to reduce the structural integrity of skin because of the increasing ROS generation, thus loss of physiological functions (Landau, 2007). Skin aging is mainly induced by ROS, as these ROS are involved in
14
stimulating intracellular and extracellular oxidative stress (Masaki, H. ,2010). Intrinsic oxidative stress is a natural aging process that brings degenerative effects to the human body induced by the genetic factors and hormonal changes. Extrinsic oxidative stress is induced by many enviromental factors such as smoking, UV exposure, air pollutants, illnesses, lack of nutrition and other factors (Farage et al., 2008; Pinnell, 2003). UV-exposure and smoking are two typical extrinsic factors for skin aging. Especially for the individuals who are not engaged in smoking, UV- exposure is a harmful extrinsic factor that induce skin aging.
15
2. Meterials and methods
2.1. Chemicals and reagents
The fluorescent probe 2’, 7’-dichlorodihydroflurescin diacetate (DCFH-DA) and 3-(4-5- dimethyl-2yl)-2-3-(4-5-diphynyltetrasolium bromide (MTT), Dimethyl sulfoxide (DMSO) and phosphate buffered saline (PBS), standard gallic acid, Neohesperidin1, 1-diphenyl-2-picrylhydrazyl (DPPH), 2,2-azobis (2-amidinopropane) hydrochloride
(AAPH), 5,5-dimethyl-1-pyrolin N-oxide (DMPO),
2,2'-azino-bis(3-ethylbenzothiazoline-6-sulphonic acid (ABTS) and α-(4-Pyridyl-1-oxcide)-N-ter-butylnitrone (POBN) were purchased from Sigma Co. (St. Louis, MO, USA). HPLC-grade acetonitrile was purchased from Burdick & Jackson (USA). The Dulbecco's modified Eagle medium (DMEM), Penicillin / streptomycin and fetal bovine serum
(FBS) were purchased from Sigma Co. (St. Louis, MO, USA). FeSO4·7H2O and H2O2
and the sovents used for CPC were purchased from Fluka Co. (Buchs, Switzerland). All other chemicals used in this study were of analytical grade.
16
2.2. Sample collection and pre-processing
Spirogyra sp. sample was collected in spring season, in January 2014, in shallow
ponds of Kongju, South Korea (36°20′34″, 127°12′ 28″). The algae were washed with fresh water to remove other impurities. After washing, the algae were freeze-dried and then ground, and sifted through a 50-mesh standard testing sieve. The dried algae powder were stored at -20℃ in refrigerator until use.
2.3. Extraction of 70% crude ethanol extract
Lyophilized algae powder with a weight of 10 g was mixed with 1 L 70 % ethanol under continuous shaking at 120 rpm for 24 hours at 25℃ without light and filtered though Whatman No:4 filter paper. The above procedure was repeated until the extract is colorless. All the extracts were combined, and the extracts were concentrated by rotary evaporator at a low pressure. Finaly obtained the 70 % ethanol crude extract of Spirogyra sp. which will be reffered to as SPE.
17
Fig. 2. The extraction procedure. Lyophilized algae was extracted with 70% EtOH, and concentrated by using rotary evaporator at a low pressure. The crude extract named as SPE.
Spirogyra sp. powder (10 g)
70% EtOH (1000 mL)
Shaking until colorless (25 ℃, 120 rpm,24h )
Filtration and concentration
18
2.4. Sample preparation
Sampes were dissolved in dimethy sulfoxide (DMSO) to prepare a 100 mg/mL stock solutions. Stock solutions were diluted with distilled water (D.W) to get the serious of concentractions which were used during the study. For cell experiments, samples were diluted with 1X phosphate buffer (PBS) from stock solution and filtered using a 0.45 μm syringe filter.
2.5. Determination of total phenolic content of samples
The total phenolic content of the samples were deterimined based on the method described by Chandler and Dodds with slight modifications (Chandler, S.F.,1983; Mahinda Senevirathne et al, 2015). Beiefly, one milliliter of 0.1 mg/mL of sample solutions were mixed in a test tube containing 1 mL of 95% ethanol, 5 mL of distilled water. Then, 0.5 mL of 50% Folin–Ciocalteu reagent was added to the test tubes sequentially and mixed thoroughly using the vortex mixer. The mixture was allowed
to reaction for 5 minutes in the dark, and 1 mL of 5% Na2CO3 solution was added
to each test tube, after it was mixed thoroughly using a vortex mixer, it was kept in dark for 1 hour. The absorbance was recorded at 700 nm using an enzyme-linked immunosorbent assay (ELISA) microplate reader (Sunrise,Tecan Co.Ltd., Australia). Gallic acid was used as the reference phenolic compound to construct the standard curve to calculation the phenolic content of samples.
19
2.6. Determination of DPPH radical scavenging activity of samples
The DPPH radical scavenging activity of the samples were determined by Electron Spin Resonance (ESR) spectrometry (JES-FA machine, JOEL, Tokyo, Japan). The experimental method was adupted from the method described by Nanjo et al with slight modifications (Nanjo, F., Goto, K. 1996). Briefly, DPPH was dissolved in methanol at a concentration 60 µmol/L. A 40 µL of freshly prepared DPPH was added to the same volume of samples with different concentrations separately. After 10 seconds of vortexing, the solutions were kept at room temprature for 2 min for the reaction. After incubation, the solutions were transferred to a 50 µL glass capillary tube and fitted into the cavity of the ESR spectrometer. The measurements were taken under following conditions, central field 3475 G; modulation frequency 100 kHz; modulation width 0.8 mT; amplitude 1000 mT; sweep width 10 mT; microwave power 1 mW and temperature 298 K.
2.7. Determination of alkyl radical scavenging activity of samples
The alkyl radicals were generated by 2,2-azobis (2-amidinopropane) hydrochloride (AAPH). The reaction mixture was composed of 20 µL of distilled water, 20 µL of sample solutions with a different concentration, 20 µL of 40 mM AAPH and 20 µL of 40 mM POBN. The solutions were mixed by vortexing and incubated at 37 ℃ in a water bath for 30 min. After that, the reactants were transferred into 50 µL glass capillary tubes and placed in the ESR spectrometer. The measurement conditions were as follows: central field 3475 G, modulation frequency 100 kHz, modulation width 0.2 mT, amplitude 1000 mT, sweep width 10 mT, microwave power 1 mW and temperature 298 K.
20
2.8. Determination of hydroxyl radical scavenging activity of samples
Hydroxyl dadicals were generated by the Fenton reaction (Fe2++H2O2→HO·+OH-),
and reacted rapidly with nitrone spin trap DMPO, the product DMPO-OH adducts is detectable with ESR spectrometer. The reaction system was composed of 20 µL of
sample, 20 µL of 0.3 M DMPO, 20 µL of 10mM FeSO4·7H2O and 20 µL of 10 mM
H2O2. After mixing the contents thoroughly by vortex, the reactants were allowed
react for 2.5 min at room temperature. Then the ESR spectrum of the remaining DMPO-OH adducts of each sample mixture was recorded using the following ESR conditions, central field 3475 G, modulation frequency 100 kHz, modulation width 0.1 mT, amplitude 200 mT, sweep width 10 mT, microwave power 1 mW and temperature 298 K.
2.9. Determination of hydrogen peroxide scavenging activity of samples
The hydrogen peroxide scavenging activity of samples were determined by colorimetric methods. The reaction mixture containing 50 μL of 0.1 M phosphate buffer (PH = 5), 50 μL sample solutions was mixed with different concentrations and 10 μL of 10 mM hydrogen peroxide peroxide. After filled above solution in 96-well plate, the plate was incubate at 37 ℃ for 5 min. After incubation, 15 μL of 1.25 mM ABTS and 15 μL of peroxidase were added into the plate, and incubate at 37 ℃ for 10 min. After incubation, the absorbance was recorded at 405 nm using an ELISA microplate reader (Sunrise,Tecan Co.Ltd., Australia).
21
2.10. Determination of ABTS radical scavenging activity of SPE by on-line High Performance Liquid Chromatography (HPLC) system
The ABTS radical scavenging activity of SPE was analysed by on-line HPLC system. 2 mM ABTS radical solvent that containing 2.5 mM potassium persulfate was prepared and incubated for 24 hours to stabilized the radical befor using. HPLC system equipted with binary Waters 515 pump, Waters 2489 UV/Vis and 2998 photodiode array (PDA) detector and Waters 2707 autosampler. HPLC system is
coupled with the interface ABTS+ radical analyzer (Waters, Mailford, MA 01757,
USA). SPE was dissolved in methanol as a concentration of 5 mg/mL. 10 μL of sample was injected to a Atalantis T3 3 μm 3.0 × 150 mm column (Waters, USA) and run at 0.3 mL/min flow rate using a gradient of Acetonitrile (ACN) and distilled water (D.W) solvent system, 0-10 min: 0 % ACN and 100 % D.W, 10-30 min 25 % ACN and 75 % D.W, 30-80 min 50 % ACN and 50 % D.W, 80-90 min 100 % ACN and 0 % D.W, 90-110 min 100 % ACN and 0 % D.W and detected wave length was 220 nm. The sample was eluted though the column, the elution was go to react with ABTS radical in the reaction coil at 40℃. Absorbance of the reaction mixture was measured as negative peak by UV/Vis detector at a wave length of 680 nm.
22
2.11. Cell culture
Human Keratinocytes (HaCaT) cell line was purchased from Korean Cell Line Bank. The HaCaT cells were maintained in DMEM supplemented with 10% heat-inactivated
FBS, streptomycin (100 µg/mL), penicillin (100 unit·mL−1) at 37℃ in an incubator
under humidified atmosphere containing 5% CO2.
2.12. Determination of cytotoxicity of samples in HaCaT cells
The cytotoxicity of samples were evaluated by MTT assay described by Mosmann Rosen, G.M., Rauckman (Rosen,G.M., Rauckman, 1980). The HaCaT cells were
seeded in 96-well plate at a concentration of 1.0 × 10⁵ cells/mL. After 24 h of
incubation at 37℃, the cells were treated with 10 µL of samples which carried a final concentration of 6.25, 12.5, 25, 50, 100 and 200 µg/mL and the control groups were treated with same volume of 1X PBS. After sample treatment, the cells were incubated for 24 h at 37℃. Then, a volume of 50 µL of MTT stock solution (2 mg/mL) was applied to each well. After 3 h incubation, the supernatant was aspirated. The formazan crystals in each well were dissolved in 150 µL DMSO, and the absorbance was meassured by ELISA microplate reader at 540 nm wave length. The cell viability of control groups were be thought as 100 %.
23
2.13. Determination of intracellular ROS generation induced by UV-B irradiation in HaCaT cells
HaCaT cells were seeded in a 24-well plate at a concentration of 2.0 × 10⁵ cells/mL
and incubated at 37℃ for 24 h. After incubation, cells were treated with sample solutions that carries a final concentration of 12.5, 25, 50 and 100 µg/mL and incubated for 30 min at 37℃. Then, the cells were treated with DCFH-DA (500 µg/mL) and incubated 30 min at 37℃. After incubation, medium was removed, and cells were washed with 1X PBS two times. After washing, cells were repleced with
200 mL fresh 1X PBS and exposed to 30 mJ/cm2 of UV-B light using a UV-B meter
(UV Lamp, VL-6LM, Vilber Lourmat, France) and the fluorescence emission of DCF-DA was detected at an excitation wavelength of 485 nm and emission wavelength of 535 nm, using a spectrofluorometer.
2.14. Determination of cytoprotective effect of samples against UV-B irradiation in HaCaT cells
HaCaT cells were seeded in a 24-well plate at a concentration of 2.0 × 10⁵ cells/mL
and incubation at 37 ℃ for 24 h. After incubation, cells were treated with sample solutions that carries a final concentration of 12.5, 25, 50 and 100 µg/mL and incubated for 2 hours at 37 ℃. After incubation, the medium was removed, and cells were washed with 1X PBS two times. After washing, cell were repleced with 200 mL
fresh 1X PBS and exposure to 30 mJ/cm2 of UV-B light using a UV-B meter (UV
Lamp, VL-6LM, Vilber Lourmat, France). Then, the PBS was removed and serum free DMEM medium was filled into each well and incubation for 24 hours. After incubation 24 hours, 50 μL supernatant of each well were transfred to a 96-well plate for LDH level analysis, and a volume of 100 µL of MTT stock solution (2 mg/mL)
24
was applied to each of each well. After 3 h incubation, the supernatant was aspirated and 400 µL DMSO was filled to each well to dissolved formazan crystals. The absorbance by ELISA microplate reader at wave length of 540 nm. The cell viability of control groups were be thought as 100 %.
2.15. Fractionation of SPE using different solvents
Dry SPE was fractionated by different polarity organic solvents that includes hexane, chloroform, ethyl acetate. The dry SPE sample, 1.9205 g was dissolved in distilled water and shaken with hexane for severals times until the hexane layer was colorless and combined all of hexane fractions together and concentrated by rotary evaporator at a low pressure. The remaining water layer continue shaken with chloroform for several times until the chloroform was colorless and combined all of chloroform fractions together and concentrated by rotary evaporator at a low pressure. And the remaining water layer fractionated by ethyl acetate and remaining water was considered as the water fraction. The hexane, chloroform, ethyl acetate and water fractions of SPE were named SPEH, SPEC, SPEE and SPEW respectively. All fractions were dried and keep in -20 ℃ refrigerator until used for further research.
2.16. Determination of ABTS radical scavenging activity of SPEE by on-line HPLC system
The ATBS radical scavenging activity of SPEE was evaluated by the ABTS+ Online
HPLC system. SPEE was dissolved in methanol as a concentration of 5 mg/mL. valume of 10 μL of sample was injected to a SunFire 5μm 4.6 × 250 mm column
25
(Waters, Ireland) and run at 1.0 mL/min flow rate using a gradient of ACN and D.W solvent system, 0-10 min: 20 % ACN and 80 % D.W, 10-30 min 25 % ACN and 75 % D.W, 30-50 min 27 % ACN and 73 % D.W, 50-60 min 30 % ACN and 70 % D.W, 60-70 min 50 % ACN and 50 % D.W, 70-80 min 100 % ACN and 0 % D.W and detected wave length was 290 nm. The sample was eluted though the column, the elution was go to reacted with ABTS radical in the reaction coil at 40 ℃. Absorbance of the reaction mixture was measured as negative peak by UV/Vis detector at a wave length of 680 nm.
2.17. Determination of apoptotic body formation by nuclear staining with Hoechest 33342.
HaCaT cells were seeded in a 24-well plate at a concentration of 2.0 × 10⁵ cells/mL
and incubated at 37℃ for 24 h. After incubation, cells were treated with SPEE solutions of final concentrations 25, 50 and 100 µg/mL and incubated for 2 hours at 37℃. After incubation, the medium was removed, and cells were washed with 1X PBS two times. After washing, cell were repleced with 200 mL fresh 1X PBS and
exposure to 30 mJ/cm2 of UV-B light using a UV-B meter. Then, the PBS was
removed and serum free DMEM medium was filled into each well and incubated for 6 hours. Then, cells were treated with 25 μL of Hoechest 33342 (stock 10 mg/mL) and incubated for 10 min at 37℃. The stained cells were observed using a fluorescence microscope to examine apoptotic body formation.
26
2.18. Cell cycle analysis
HaCaT cells were seeded in a 6-well plate at a concentration of 4.0 × 10⁵ cells/mL
and incubated at 37 ℃ for 24 h. After incubation, cells were treated with SPEE solutions that carries a final concentrations of 25, 50 and 100 µg/mL and incubated for 2 hours at 37 ℃. After incubation, the medium was removed, and cells were washed with 1X PBS two times. After washing, cell were repleced with 200 mL fresh
1X PBS and exposedto 30 mJ/cm2 of UV-B light using a UV-B meter. Then, the
PBS was removed and serum free DMEM medium was filled into each well and incubated for 6 hours. The cells were harvested and washed two times with 1X PBS. After washing, cells were fixed in 1 mL 70 % ethanol for 30 min at 4℃. After cells were fixed by 70 % ethanol, cells were washed two times with 2 mM EDTA. Then the cells were incubated in dark with 1 mL EDTA containing 100 μg PI and 100 μg Rnase A for 30 min at 37℃. Cell cycle analysis was conducted with FACS calibur flow cytometer (Becton-Dickinson, San Jose ,CA,USA). The cell cycle phases were analysed by histograms given by the Quest and Mod-Fit computer programs (Sung-Myung Kang et al, 2012). The anti-apoptotic activity of SPEE on cell cycle was evaluated by change in the perentage of cell distribution at each cell cycle phase.
2.19. Origin and maintenance of parental zebrafish
The adult zebrafish were purchased from a commercial dealer (Seoul aquarium, Korea). And the fishe were separately kept in 3 Lacrylic tank in 28.5 ℃, with a 14/10 h light/dark cycle. Zebrafishes were fed 3 times/day, 6 days/week, with tetramin flake food supplemented with live brine shrimps. Embryos were obtained from natural
27
spawning that was induced in the morning by turning on the light. Collection of embryos were completed within 30 min.
2.20. Determination of UV-B protection effect of SPEE in vivo / in zebrafish mode
The ROS generation of zebrafish was analyzed using DCFH-DA that is an oxidantion sensitive flourescent probe dye. The 2 dpf embryos were used for the anti-UV-B study. At 2 dpf, the embryos were treated with SPEE solutions with a final concentration of 25, 50 and 100 µg/mL. After 1 hour, the embryos were washed with embryo media
and exposed at 50 mJ/cm2 UV-B individual. After irradiating embryos with UV-B,
the embryos were transferred into 96-well plate and treated with DCFH-DA solution (20 μg/mL) and incubated for 1 hour in the dark at 28.5°C. Then , the embryos were washed two times with embryo media and anesthetized phenoxyethanol before visualization (Seok-Chun Ko et al, 2011). After anesthetized, the embyros were photographed under the microscope Cool SNAP-Procolor digital camera (Olympus, Japan). And the individual zebrafish larvae fluorescence intensity was quantified using an image J program.
2.21. Optimisation the Centrifugal Partition Chromatographic solvent system
The solvent system contained hexane, ethyl acetate, methanol and water with different ratio (H:EA:Me:W), the total valume of solvent system is 2 mL. Solvent of H:EA:Me:W were mixed with different ratio and kept some time until two phases reach the equilibrium. A volume of 500 μL of top phase and 500 μL of bottom phase
28
transferred into a micro tubes. Weight of 5 mg of SPEE was dissolved in the seperated solvent and mixed well. The micro tubes were centrifuged for 10 min and 200 μL of top phase and 200 μL of bottom phase were seperated in to different vials and dried by the rotary evaporator at a low pressure. The dry sample of each vials were dissolved in 500 μL methanol and analysed by HPLC. Volume of 10 μL of sample was injected to a SunFire 5 μm 4.6 × 250 mm column (Waters, Ireland) and run at 1.0 mL/min flow rate using a gradient of ACN and D.W solvent system, 0-10 min: 20 % ACN and 80 % D.W, 10-30 min 25 % ACN and 75 % D.W, 30-50 min 27 % ACN and 73 % D.W, 50-60 min 30 % ACN and 70 % D.W, 60-70 min 50 % ACN and 50 % D.W, 70-80 min 100 % ACN and 0 % D.W and detected wave length was 290 nm. The area under the curve was calculated for each separete peak. The distribution coeffecient (K-value) was calculate for each seperated chromatographic peak accroding to equation to find the best solvent condition for HPCPC separation.
K= [Area under the curve in top phase] / [Area under the curve in bottom phase]
2.22. Seperation of active compounds from SPEE by CPC
Centrifugal partition chomatography (CPC) was used to seperate the active compounds from SPEE. In this study, the solvent of H:EA:Me:W of 1:13:4:7 was used as the solvent system for seperation. The top phase was used as the mobile phase, whereas the bottom phase was used as the stationary phase. The column of CPC was initially filled with the top phase and the mobile phase was pumped into the column while the CPC column was rotating at a speed of 1000 rpm. The CPC was operated in the ascending mode with a flow rate of 2 ml/min and changed to descending mode after operation 300 min. A sample weight of 500 mg of SPEE was introduced in to the
29
column and the effluents were monitored using an UV detector at a wave length of 254 nm. The fractions from the CPC were collected in to text tubes using a fraction collector (Gilson FC 203 B).
2.23. Analysis of fractions collected by CPC using HPLC
The fractions collected by CPC were analyzed using HPLC. The dry samples of each fractions were dissolved in 500 μL methanol and analysed by HPLC. Volume of 10 μL of sample was injected to a SunFire 5μm 4.6 × 250 mm column (Waters, Ireland) and run at 1.0 mL/min flow rate using a gradient of ACN and D.W solvent system, 0-10 min: 20 % ACN and 80 % D.W, 10-40 min 25 % ACN and 75 % D.W, 40-50 min 100 % ACN and 0 % D.W, 50-60 min 100 % ACN and 0 % D.W and detected wave length was 290 nm. Sample fractions were pooled together.
2.24. NMR spectroscopy of the target compounds
The chemical structures of target compounds were analysed by the spectroscopic data given by the fourier-transform nuclear magnetic resonance spectroscopy. The
magnetic properties 1H isotope of hydrogen peroxide and 13C isotope of carbon were
used for nuclear magnetic resonance spectroscopy to record the spectrum. The 1H and
13
C spectrums were recorded on JEOL DELTA-400 (400 Hz) spectrometer. Target compounds were dessolved in the deuterated MeOH, the chemical shift of the spectrum were reported as δ relative to tetramethylsilane as an internal standard.
30
2.25. Statistical analysis
The experiments were performed in triplicate. The data were expressed as the mean ± standard error (SE), and one-way ANOVA test (using SPSS 11.5 statistical software) was used to compare the mean values of each treatment. Significant differences between the means of parameters were determined by the student’s t-test ( * p < 0.05, ** p < 0.001).
31
3. Results and discussion
3.1. Sample extraction - 70% crude ethanol extract (SPE)
A weight of 10 g of lyophilized Spirogyra sp. powder was extracted by 70 % ethanol and filtered though Whatman No:4 filter paper. Then, the extracts were concentrated by rotary evaporator at a low pressure. A valume of 1 mL of 70 % ethanol extract was used to check the yield of extraction. The yield of extract was recorded as 19.33 ± 2.23 % (Table 1). The obtained crude extract was 19.28 g (SPE). SPE was stored at -20 ℃ in refrigerator until further use.
3.2. Total phenolic content of SPE
The total phenolic content of SPE was determined by the method described in 2.5. The result (Table.1) indicated that the phenolic content of SPE is 22.74 ± 1.03 %. The results suggests a higher phenolic content in SPE. Sugesting that the green algae
Spirogyra sp. is rich in phenolic content. Normally, extracts rich in phenolic content
indicates strong radical scavenging and antioxidant activities. These results suggests that SPE can be selected as a material for anti-aging research.
32
Table 1. The yield and total phenolic content of Spirogyra sp. 70% EtOH extract
Sample SPE
Yield (%) 19.33± 2.23
33
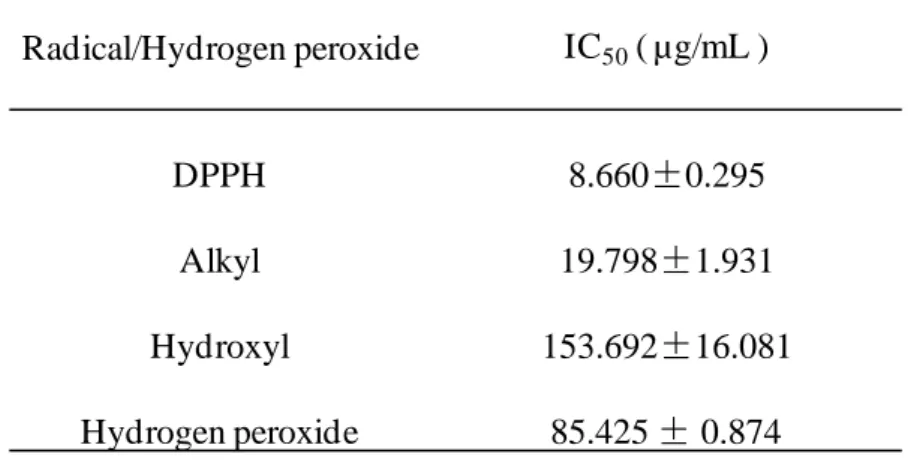
3.3. Free radical and hydrogen peroxide scavenging activity of SPE
Many studies reportes that plants or seaweeds which have a high phenolic content which have a strong free radical scavenging activity. Spirogyra sp. is a freshwater microalgae, which contains a high phenolic content as reported by our provious study(Ji-Hyeok Lee, 2015). Accroding to the result of phenolic content analysis of SPE, we can guess that SPE will show a strong radical scavenging activity. Free radicals and hydrogen peroxide scavenging activity of SPE were deterimined by ESR and colorimetric method. The methods described at 2.6, 2.7, 2.8 and 2.9. The results shown as Fig. 3, Fig. 4, Fig. 5 and Fig. 6. The result suggest that SPE show a strong free radicals and hydrogen perxide scavenging activity, excepially DPPH radical
scavenging activity. The IC50 values of DPPH, alkyl, hydroxyl radicals and hydrogen
peroxide scavenging activities of SPE are 8.660 ± 0.295, 19.798 ± 1.931, 153.692 ±
16.081 and 85.425 ± 0.874 μg/mL respectively (Table 2). Those results suggest SPE
34
Fig. 3. DPPH radical scavenging activity of SPE. DPPH radical scavenging activity was determined by ESR. Experiments were performed in triplicate and the data are expressed as mean ± SE.
SPE ( µg/mL) 0 10 20 30 40 50 60 70 80 90 100 4 8 16 32 D P P H r ad ic al s ca ve ngi ng ac ti vi ty( % )
35
Fig. 4. Alkyl radical scavenging activity of SPE. Alkyl radical scavenging activity was determined by ESR. Experiments were performed in triplicate and the data are expressed as mean ± SE.
SPE ( µg/mL) 0 10 20 30 40 50 60 70 80 90 100 15.63 31.25 62.5 125 A lkyl r ad ic al s ca ve ngi ng ac ti vi ty (% )
36
Fig. 5. Hydroxyl radical scavenging activity of SPE. Hydroxyl radical scavenging activity was determined by ESR. Experiments were performed in triplicate and the data are expressed as mean ± SE.
0 10 20 30 40 50 60 70 80 90 100 62.5 125 250 500 H yd roxy l ra d ic al sc ave ngi ng a ct ivi ty (% ) SPE ( µg/mL)
37
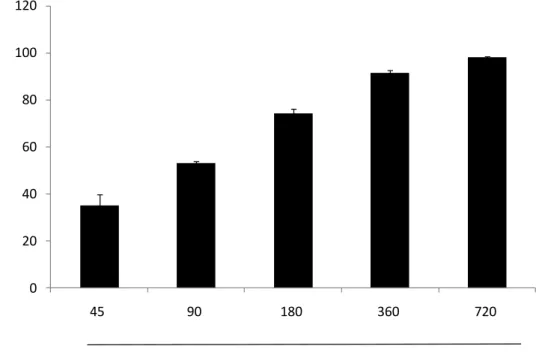
Fig. 6.Hydrogen peroxide scavenging activity of SPE. Hydrogen peroxide
scavenging activity was determined by colorimetric method. Experiments were performed in triplicate and the data are expressed as mean ± SE.
SPE ( µg/mL) 0 20 40 60 80 100 120 45 90 180 360 720 H yd roge n pe roxi d e sc ave ngi ng ac ti vi ty (% )
38
Table 2. IC50 values of free radicals and hydrogen peroxide scavenging activities of
SPE Radical/Hydrogen peroxide IC50( µg/mL ) DPPH 8.660±0.295 Alkyl 19.798±1.931 Hydroxyl 153.692±16.081 Hydrogen peroxide 85.425 ± 0.874
39
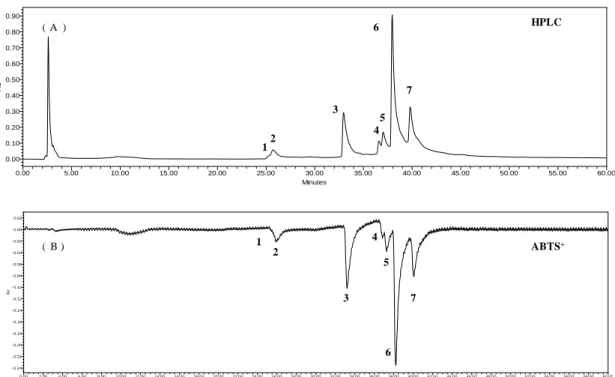
3.4 . On-line HPLC analysis of SPE
On-line HPLC analysis of SPE was determined by the method described in 2.10. The chromatograph of online HPLC in Fig. 7 (A), there are 7 main peaks at the wave length of 220 nm shown as the chromatograph and named as peak-1, peak-2, peak-3,
peak-4, peak-5, peak-6 and peak-7 respectively. The ABTS+ absorbance curve was
shown in Fig. 7 (B). According to the result, the peak area of peak-6 is higher than
other pearks, It means that peak-6 is the main compound of SPE. The ABTS+
absorbance of peak-6 is the strongest of this 7 peaks . It means that peak-6 shown the strongest ATBS radical scavenging activity of those 7 peaks. This result suggest that SPE has a strong ABTS radical scavenging activity and peak-6 is the main ABTS radical compound of SPE.
40
Fig. 7. On-line HPLC analysis of SPE. (A) HPLC chromatogram, (B) ABTS+
absorption sepectrum. Colunm: Atalantis T3 3 μm ODS column (3.0 × 150 mm i.d.); mobile phase: acetonitrile-distilled water solvent system (0-10 min: 0:100 v/v; 10-30 min: 25:75 v/v ; 30-80 min: 50:50 v/v ; 80-90 min: 100:0 v/v; 90-110 min: 100:0 v/v); flow rate 0.3 mL/min ; detected wave length was 220 nm. ABTS solution eluted at flow rate 1.0 mL/min and measured as negative peak by UV/Vis detector at a wave length of 680 nm. AU 0.00 0.10 0.20 0.30 0.40 0.50 0.60 0.70 0.80 0.90 Minutes 0.00 5.00 10.00 15.00 20.00 25.00 30.00 35.00 40.00 45.00 50.00 55.00 60.00 AU -0.24 -0.22 -0.20 -0.18 -0.16 -0.14 -0.12 -0.10 -0.08 -0.06 -0.04 -0.02 0.00 0.02 Minutes 0.00 2.00 4.00 6.00 8.00 10.00 12.00 14.00 16.00 18.00 20.00 22.00 24.00 26.00 28.00 30.00 32.00 34.00 36.00 38.00 40.00 42.00 44.00 46.00 48.00 50.00 52.00 54.00 56.00 58.00 60.00 12 3 4 5 6 7 2 3 4 5 6 7 HPLC ABTS+ 1 ( A ) ( B )
41
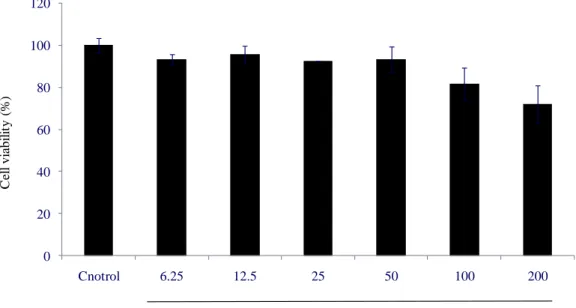
3.5. Cytotoxicity of SPE on HaCaT cells
It is necessary to analys cytotoxicity of sample before check bioactivity in vitro in cell lines. In this study, cytotoxicity of SPE was determinated by MTT analysis, the method described at 2.12. The cell viability of the cellsnot treated with SPE was considerd as 100 % viable. The cell viability of cells treated with SPE is shown as Fig. 8. The cell viability of the cells treated with 100 and 200 μg/mL of SPE were decreased with the concentration increasing. The cell viability of the cells treated with a final concentration of 200 μg/mL SPE is around 80%. It means that a high concentration of SPE has some toxicity for HaCaT cells. The cell viability were not decrased when the cells were treated with SPE below 50μg/mL. It means that the maximun safe concentration treatment to HaCaT cells of SPE is 50 μg/mL. So, 50 μg/mL of SPE was considered as hightest concentration treatment for HaCaT cells in futher research.
42
Fig. 8. Cell viability of HaCaT cells after treated SPE. HaCaT cells were seeded in
96-well plate at a concentration of 1.0 × 10⁵ cells/mL. Cell viability was determined
by MTT assay. Experiments were performed in triplicate and the data are expressed as mean ± SE. 0 20 40 60 80 100 120 Cnotrol 6.25 12.5 25 50 100 200 C el l vi abi li ty (% ) SPE ( µg/mL)
43
3.6. Intracellular ROS scacvenging activity of SPE in HaCaT cells
Intracellular ROS scavenging activity of SPE was determined by DCF-DA analysis following the method discribed in 2.13. The results showed in Fig. 9. The cellular ROS generation were increased after UV-B irradiation without pretreated with SPEE compared with control. And the cellular ROS generation of the cells pretreated with a final SPE showed a siganificant dose dependent decreasing compared with the cells irradiated with UV-B only. The result suggest that SPE can scavenge or reduce ROS generation induced by UV-B irradiation.
44
Fig. 9. Intracellular ROS scavenging activity of SPE in HaCaT cells, HaCaT cells
were seeded into a 24-well plate at a concentration of 2.0 × 10⁵ cells/mL. Cellular
ROS level were determined by DCF-DA analysis. Experiments were performed in triplicates and the data are expressed as mean ± SE. * p<0.05.
UV ( 30 mJ/ cm2) + SPE ( µg/mL ) 10 12 14 16 18 20 22 24 26 Control 0 12.5 25 50 F luor es ce nc e int ens it y ( × 10 3 )
*
*
45
3.7. Cytoprotective effect of SPE against UV-B irradiation in HaCaT cells
The cytoprotective effect of SPE was determined by LDH analysis and MTT analysis following the method discribed in 2.14. The result shown in Fig. 10. The LDH release of the cells (Fig. 10.(A)) without SPE pretreatment, increased and the cell viability (Fig. 10.(B)) were decreased after UV-B irradiation compared with control. The LDH resease level of the cells pretreated with a final concentrations of 25 and 50 μg/mL SPE showed a siganificant decrease compared with the cells irradiated with UV-B only. The cell viability of the cells pretreated with a final concentration 50 μg/mL SPE showed a siganificant increase compared to the cells irradiated with UV-B only.
46
Fig. 10. Cytoprotective effect of SPE in HaCaT cells. HaCaT cells were seeded into a
24-well plate at a concentration of 2.0 × 10⁵ cells/mL. Cell damage degree and
viability were determined by LDH and MTT analysis. (A): LDH release level, (B): cell viability. Experiments were performed in triplicate and the data are expressed as mean ± SE. * p<0.05. ** p<0.001. UV ( 30 mJ/ cm2) + SPE ( µg/mL ) 0 20 40 60 80 100 120 Con 0 12.5 25 50 L D H r el ea se l el ve (%) * * ** ( A ) 0 20 40 60 80 100 120 Con 0 12.5 25 50 C el l vi abi li ty (% ) * UV ( 30 mJ/ cm2) + SPE ( µg/mL ) ( B )
47
3.8. Fractionation of SPE using different solvents
The dry SPE sample was dissolved in D.W and fractionated by different organic solvents following the methed discribed in 2.15. Then, the 4 fractions were named as SPEH, SPEC, SPEE and SPEW. The weights of SPEH, SPEC, SPEE and SPEW were 37.5 mg, 154.3 mg, 524.6 mg and 1166 mg respectively (Fig. 11). The yield of each fraction of SPE is indicated in Table 3. The fractctions were stored at -20 ℃ in refrigerator until use.
48
Fig. 11. The procedure of fractionation of SPE using different solvents. After fractionation, the 4 fractions were collected and named as SPEH, SPEC, SPEE and SPEW respectively. SPE (D.W) (1.9205 g) Hexane Hexane fraction(SPEH) 37.5 mg Water CHCl3 CHCl3 fraction (SPEC) 154.3 mg Water Ethyl acetate
EtOAc fraction (SPEE) 524.6 mg
Water fraction(SPEW) 1166 mg
49
3.9. Total phenolic contents of each fractions of SPE
The total phenolic content of each fractions of SPE were determined by the method described in 2.5 and compared with the total phenolic content of SPE. The result shown as Table 3. The total phenolic content of each fraction of SPE ranged between 7.44±0.52 % to 77.44±0.26 %. SPEH, SPEC, SPEW are contained a lower phenolic contents compared with SPE, and SPEE is contained the heightest phenolic content. SPEE was selected for further research as it contained the heightest phenolic levels.
50
Table 3. The yield and total phenolic content of each fractions of SPE
Sample Yield (%) Phenolicl content (%)
SPE - 26.05 ± 0.52
SPEH 1.95 7.44 ± 0.78
SPEC 8.13 17.57 ± 0.00
SPEE 27.32 77.44 ± 0.26
51
3.10. Free radicals and hydrogen peroxide scavenging activities of SPEE
Free radicals and hydrogen peroxide scavenging activities of SPEE were deterimined by ESR and colorimetric methods as described in 2.6, 2.7, 2.8 and 2.9. The results
shown in Fig. 12, Fig. 13, Fig. 14 and Fig. 15. The IC50 values of DPPH, alkyl,
hydroxyl radicals and hydrogen peroxide scavenging activities of SPEE was 2.453 ± 0.107, 5.019 ± 0.208, 100.389 ± 12.419 and 24.546 ± 1.523 μg/mL respectively (Table 4). The free radicals and hydrogen peroxide scavenging activities of SPEE
52
Fig. 12. DPPH radical scavenging activity of SPEE. DPPH radical scavenging activity was determined by ESR. Experiments were performed in triplicate and the data are expressed as mean ± SE.
SPEE ( µg/mL ) 0 10 20 30 40 50 60 70 80 90 100 2 4 8 16 D P P H r ad ic al s ca ve ngi ng ac ti vi ty( % )
53
Fig. 13. Alkyl radical scavenging activity of SPEE. Alkyl radical scavenging activity was determined by ESR. Experiments were performed in triplicate and the data are expressed as mean ± SE.
SPEE ( µg/mL ) 0 10 20 30 40 50 60 70 80 90 100 2 4 8 A lkyl r ad ic al s ca ve ngi ng ac ti vi ty( % )
54
Fig. 14. Hydroxyl radical scavenging activity of SPEE. Hydroxyl radical scavenging activity was determined by ESR. Experiments were performed in triplicate and the data are expressed as mean ± SE.
SPEE ( µg/mL ) 0 10 20 30 40 50 60 70 80 90 100 125 250 500 H yd rox yl ra d ic al sc avengi ng ac ti vi ty (% )
55
Fig. 15. Hydrogen peroxide scavenging activity of SPEE. Hydrogen peroxide scavenging activity was determined by colorimetic method. Experiments were performed in triplicate and the data are expressed as mean ± SE.
SPEE ( µg/mL ) 0 10 20 30 40 50 60 70 80 90 100 6 13 25 50 H yr oge n pe roxi d e sc ave ngi ng ac ti vi ty (% )
56
Table 4. IC50 values of free radicals and hydrogen peroxide scavenging activities of
SPE and SPEE
Radical/Hydrogen peroxide IC50value (µg/ml) SPE SPEE DPPH 8.660±0.295 2.453±0.107 Alkyl 19.798±1.931 5.019±0.208 Hydroxyl 153.692±16.081 100.389±12.419 Hygrogen peroxide 85.425 ± 0.874 24.546±1.523
57
3.11. On-line HPLC analysis of SPEE
On-line HPLC analysis of SPEE was determined by the method described in 2.16. Accordind to the chromatograph of online HPLC in Figure.16 (A), 8 main peaks were identified at the wave length of 290 nm. These will be named as 1, 2, peak-3, peak-4, peak-5, peak-6 , peak-7 and prak-8 respectively. According to the result, the peak areas of 6 and 8 are higher than other pearks, it means that
peak-6 and peak-8 are main compounds of SPEE. The ABTS+ absorbance curve is shown
in Figure.16 (B). The ABTS+ absorbance of peak-1 was identified as the one whith
has the strongest intensity of all 8 peaks. It means that peak-1 shown the strongest ATBS radical scavenging activity of those 8 peaks. According to this results, peak-6 and peak-8 are two main compounds of SPEE, and peak-1 is show the strongest ATBS radical scavenging activity of those 8 peaks.
58
Fig. 16. On-line HPLC analysis of SPEE. (A) HPLC chromatogram, (B) ABTS+
absorption sepectrum. Colunm: SunFire 5μm ODS column (4.6 × 250 mm i.d.); mobile phase: acetonitrile-distilled water solvent system(0-10 min: 20:80 v/v; 10-30 min: 25:75 v/v ; 30-50 min: 27:73 v/v ; 50-60 min: 30:70 v/v; 60-70 min:50:50 v/v; 70-80 min:100:0 v/v); flow rate 1.0 mL/min; detected wave length was 290 nm. ABTS solution eluted at flow rate 1.0 mL/min and measured as negative peak by UV/Vis detector at a wave length of 680 nm.
AU -0.05 0.00 0.05 0.10 0.15 0.20 0.25 0.30 0.35 0.40 0.45 0.50 0.55 0.60 0.65 0.70 0.75 Minutes 0.00 2.00 4.00 6.00 8.00 10.0012.0014.0016.0018.0020.0022.0024.0026.0028.0030.0032.0034.0036.0038.0040.0042.0044.0046.0048.0050.0052.0054.0056.0058.0060.0062.0064.0066.0068.0070.0072.0074.0076.0078.0080.00 AU -0.24 -0.22 -0.20 -0.18 -0.16 -0.14 -0.12 -0.10 -0.08 -0.06 -0.04 -0.02 0.00 0.02 0.04 0.06 0.08 0.10 Minutes 0.00 2.00 4.00 6.00 8.0010.0012.0014.0016.0018.0020.0022.0024.0026.0028.0030.0032.0034.0036.0038.0040.0042.0044.0046.0048.0050.0052.0054.0056.0058.0060.0062.0064.0066.0068.0070.0072.0074.0076.0078.0080.00 1 1 2 2 3 3 4 5 4 5 6 7 8 6 7 8 HPLC ABTS+ ( A ) ( B )
59
3.12. Cytotoxicity analysis of SPEE in HaCaT cells
The cytotoxicity of SPEE was determinated by MTT analysis according to the method described in 2.12. The cell viability was shown in Fig. 17. The cell viability of the cells treated with a final concentration of 6.25 and 100 μg/mL SPEE were not only decreased with the increasing concentrations, but inscreased dose dependently. Thus, 100 μg/mL was been thought as a safe concentration treatment for cells.
60
Fig. 17. Cytotoxicity analysis of SPEE. HaCaT cells were seeded in 96-well plate at a
concentration of 1.0 × 10⁵ cells/mL. Cell viability was determined by MTT assay.
Experiments were performed in triplicate and the data are expressed as mean ± SE.
0 20 40 60 80 100 120 140 160 180 Control 6.25 12.5 25 50 100 C el l vi abi li ty (% ) SPEE ( µg/mL )
61
3.13. Intracellular ROS sacvenging activity of SPEE in HaCaT cells
Intracellular ROS scavenging activity of SPEE was determined by DCF-DA analysis following the method discribed in 2.13. The result shown in Fig. 18. The cellular ROS generation were increased after UV-B irradiation without pretreated with SPEE compared with control. The cellular ROS generation of the cells pretreated with a final concentration of 25 and 50 μg/mL. SPEE indicated a siganificant decrease compared with the cells irradiated with only UV-B.
62
Fig. 18. Intracellular ROS sacvenging activity of SPEE in HaCaT cells. HaCaT cells
were seeded in a 24-well plate at a concentration of 2.0 × 10⁵ cells/mL. Cellular ROS
level was determined by DCF-DA analysis. Experiments were performed in triplicate and the data are expressed as mean ± SE. * p<0.05.
UV ( 30 mJ/ cm2) + SPEE ( µg/mL ) 5 10 15 20 25 30 35 Control 0 25 50 100 F lu o re sc en ce in te n si ty ( × 10 3 ) * *
63
3.14. Cytoprotective effect of SPEE against UV-B irradiation in HaCaT cells
The cytoprotective effect of SPEE was determined by LDH and MTT analysis following the method discribed in 2.14. The results in Fig. 19. indicates the LDH release levels of the cells (Fig. 19.(A) without SPEE pretreatement were increased and the cell viability (Fig. 19.(B) were decreased after UV-B irradiation compared with control. The LDH released level of the cells pretreated with SPEE indicates a dose dependent decrease compared with the cells irradiated with UV-B only. The cell viability of the cells pretreated with SPEE indicates a dose dependent increase compared with the cells irradiated with UV-B only.
64
Fig. 19. Cytoprotective effect of SPEE in HaCaT cells. HaCaT cells were seeded in a
24-well plate at a concentration of 2.0 × 10⁵ cells/mL. Cell damage degree and
viability were determined by LDH and MTT analysis. (A): LDH release level, (B): cell viability. Experiments were performed in triplicate and the data are expressed as mean ± SE. * p<0.05. 0 20 40 60 80 100 120 Control 0 25 50 100 L D H r el ea se le ve l (% ) * UV ( 30 mJ/ cm2) + SPEE ( µg/mL ) 0 20 40 60 80 100 120 Control 0 25 50 100 C el l vi abi li ty (% ) UV ( 30 mJ/ cm2) + SPEE ( µg/mL ) * * * * ( A ) ( B )
65
3.15. Apoptotic body formation induced by UV-B irradiation in HaCaT cells
The cells were stained with Hoechest 33342 a cell permeable DNA dye. Then the nuclear morphology of cells were examined by fluorsence microscopy. The cell images were shown in Fig. 17. Accroding to the results, the amount of apoptotic bodies of the cells pretreated with SPEE increased with increasing concentrations of the sample compared with the cells irradiated by UV-B only. It means that SPEE can reduce cell apoptotic induced by UV-B irradiation.
66
Fig. 20. Apototic body formation under UV-B irradiation. HaCaT cells were seeded
in a 24-well plate at a concentration of 2.0 × 10⁵ cells/mL. After 24 h incubation cells
were pretreated with sample. After 2 h incubation, cells were exposed to 30 mJ/cm2
UV-B and incubated 6 h. After incubation, cells were stained with Hoechest 33342, then, the nuclear morphology of cells were examined by microscope.
Control UV-B