PUBLIC HEALTH WEEKLY REPORT, PHWR
eISSN 2586-0860
CONTENTS
CONTENTS
0180
2014∼2017년 어린이 국가예방접종 지원사업 결과
0186
통계단신(QuickStats)
낙상 입원환자 현황, 2012-2016
0190
주요 감염병 통계
환자감시 : 전수감시, 표본감시
병원체감시 : 인플루엔자 및 호흡기바이러스
급성설사질환, 엔테로바이러스
0187
홍역 안내문
홍역 바로알기 / 홍역 예방수칙
Vol.12, No. 7, 2019
주간 건강과 질병•제12권 제7호
들어가는 말
예방접종은 감염병을 예방하기 위한 가장 효과적인 방법으로
알려져 있어 국가에서는 다수의 국민들이 최소의 비용으로
편하게 예방접종서비스를 받을 수 있도록 꾸준히 노력하여 왔다.
국가예방접종사업은 보건소 무료접종에서 출발하였으나, 2005년
예방접종 확대 시범사업 등을 거쳐 2014년 민간의료기관까지
확대되어 접종대상자들이 거주지와 가까운 의료기관에서 편하게
접종할 수 있도록 편의성이 개선되었다.
지원 백신도 2009년 8종(피내용 BCG, B형간염, DTaP, IPV,
수두, MMR, 일본뇌염 불활성화 백신, Td)을 시작으로 2011년
9종(DTaP-IPV 추가), 2012년 10종(Tdap 추가), 2013년 11종(Hib
2014∼2017년 어린이 국가예방접종 지원사업 결과
연구단신, Brief report
Evaluation of the national child vaccination support project, 2014-2017
Kim Jung-hee, Yu Jeong-hee, Kim You-miDivision of VPD Control & NIP, Center for Infectious Disease Control, KCDC
Vaccination has been one of the most cost-effective public health interventions that protect not only individuals but also
others by increasing population immunity(herd immunity) level and thus minimizing the spread of vaccine-preventable
diseases. Since 2014, in addition to the free-of-charge immunization service in the public health centers, the Korea’s
National Immunization Support Program has expanded to fund or reimburse for immunization service expenses incurred in
the participatory medical institutions in the private sector, for lowering the economic burden of vaccination costs and
boosting the vaccination level. The sorts of vaccines funded under the National Immunization Program(NIP) have
continuously expanded from 8 in 2009 to 17 in 2017, by adding pneumococcal pneumonia, HPV, and DTaP-IPV/Hib. The
number of medical institutions participated in vaccination service grew from 4,000 in 2009 to 10,000 in 2017. Many
advances have been made in the Korea National Immunization Program over the past decade by achieving more than 95%
coverage of vaccination level. The Korea Centers for Disease Control has been continuing to strive for the raising public
awareness on the importance of vaccination.
Keywords: Immunity, Public Health, Vaccination, Immunization Program, Private Sector
질병관리본부 감염병관리센터 예방접종관리과 김정희, 유정희, 김유미*
2015년 14종(A형간염 추가), 2016년 16종(HPV, 인플루엔자 추가),
2017년 17종(DTaP-IPV/Hib 추가)으로 매년 1~2종의 백신이
추가되었다.
예방접종을 위한 민간의료기관 이용 시 접종비용에 대한
부담을 줄이기 위해 지원 예산 확보에 노력한 결과 2009년 의료기관
백신비 지원, 2012년 백신비와 시행비 일부 지원(본인부담금 5,000원
이하), 2014년 시행비 전액 지원으로 의료기관에서도 무료로
예방접종을 할 수 있게 되었다. 지원 백신 추가 및 시행비 전액 지원
등으로 2014년 1,780억 원의 예산이 투입되었으며, 매년 투입예산이
증가하여 2017년 사업비는 약 3,100억 원이 되었다.
전액 무료지원이 시작되었던 2014년부터 2017년까지 어린이
국가예방접종지원사업 결과를 분석하여 우리나라 예방접종률
변화를 파악하고 예방접종률 관리방안 및 향후 추진방향 등을
기술하고자 한다.
몸 말
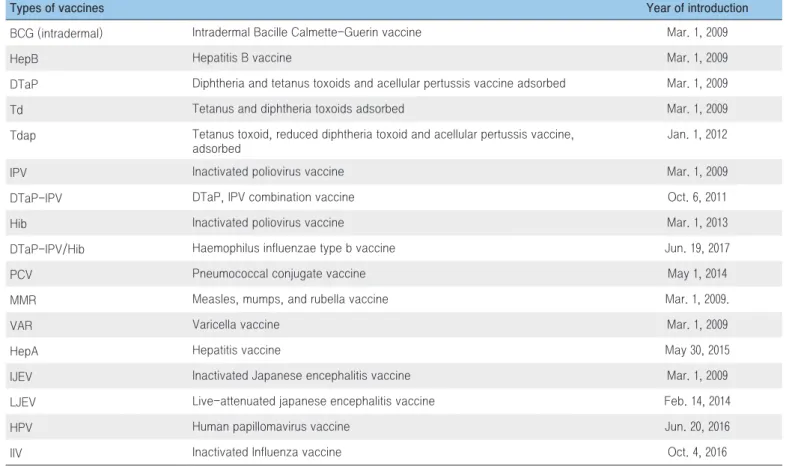
어린이 국가예방접종 지원사업(National Immunization Program,
NIP)은 만12세 이하 어린이를 대상으로 국가예방접종에 포함된 17종
백신을 전국 256개 보건소와 위탁의료기관에서 실시하는 예방접종
비용을 국가가 전액 지원하는 사업이다. 2014년에 13종의 백신을
지원하였으며, 2017년까지 매년 1종 또는 2종의 백신이 추가되어 총
17종의 백신이 지원되고 있다(Table 1).
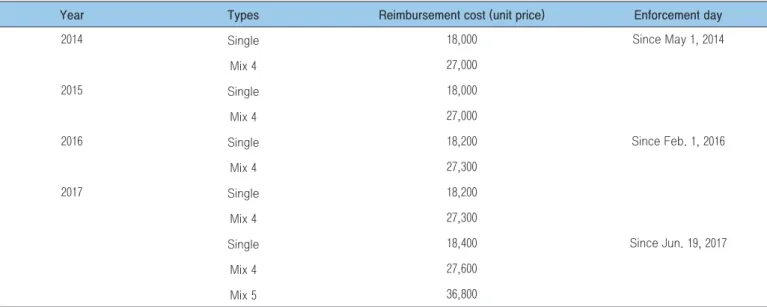
2014년 본인부담금 전액 국가 지원으로 접종 대상자는 무료로
예방접종을 할 수 있게 되었으며, 국가예방접종지원사업에 참여한
위탁의료기관은 국가가 정한 접종비용을 상환 받는다(Table 2).
2014년 국가예방접종사업 참여의료기관은 7,265개소에서
2017년 10,340개소로 3,075개소(42.3%) 증가하였다. 2012년
민간의료기관 접종비용 확대지원으로 예방접종 전산등록률이
향상되어 2012년 출생아가 만3세가 되는 2015년부터 전산등록
자료를 이용한 전수조사 자료를 승인통계로 공표하고 있다.
Table 1. Vaccines to be supported for children, 2017
Types of vaccines Year of introduction
BCG (intradermal) Intradermal Bacille Calmette-Guerin vaccine Mar. 1, 2009
HepB Hepatitis B vaccine Mar. 1, 2009
DTaP Diphtheria and tetanus toxoids and acellular pertussis vaccine adsorbed Mar. 1, 2009 Td Tetanus and diphtheria toxoids adsorbed Mar. 1, 2009 Tdap Tetanus toxoid, reduced diphtheria toxoid and acellular pertussis vaccine,
adsorbed
Jan. 1, 2012
IPV Inactivated poliovirus vaccine Mar. 1, 2009
DTaP-IPV DTaP, IPV combination vaccine Oct. 6, 2011
Hib Inactivated poliovirus vaccine Mar. 1, 2013
DTaP-IPV/Hib Haemophilus influenzae type b vaccine Jun. 19, 2017
PCV Pneumococcal conjugate vaccine May 1, 2014
MMR Measles, mumps, and rubella vaccine Mar. 1, 2009.
VAR Varicella vaccine Mar. 1, 2009
HepA Hepatitis vaccine May 30, 2015
IJEV Inactivated Japanese encephalitis vaccine Mar. 1, 2009 Live-attenuated japanese encephalitis vaccine Feb. 14, 2014
주간 건강과 질병•제12권 제7호
승인통계 공표 전에는 연구용역을 통해 표본조사를 실시하였으며
조사결과 2014년(만3세까지) 전국 예방접종률은 88.4%로 나타났다.
승인통계로 공표하기 시작한 2015년 전국예방접종률 조사에서
만3세까지 권장되는 7종 백신에 대해 모두 접종한 완전접종률은
88.3%로 나타났고 강원 92.0%, 대전 91.6%, 울산 91.2% 순으로
높았다. 2016년(만3세까지)은 전국 89.2%이며 접종률이 가장 높은
지역은 강원 91.8%, 충남 91.5%, 충북 91.2% 순으로 나타났다.
2017년 만3세 영유아의 전국 예방접종률의 평균 접종률은 96.7%로
서울, 부산, 제주 지역을 제외한 대부분 지역에서 평균 접종률을
상회하는 것으로 나타났다. 또한 전년대비 만3세 이하 예방접종 백신
중 MMR 백신을 제외한 8종 백신은 전년대비 0.1%p∼0.7%p 정도
증가하였다[3](Table 3).
예방접종업무에 필요한 각종 자료 또는 정보의 효율적
처리와 접종기록·관리 등을 위하여 2002년부터 예방접종통합
관리시스템으로 예방접종사업을 관리하고 있다. 예방접종통합
관리시스템을 통해 접종력 등록·관리뿐만 아니라 접종대상자
관리, 비용지급 관리, 예방접종증명서 발급, 예방접종 사전
문자알림 등 예방접종 관련 전반적인 업무 처리가 가능하다.
나아가 등록된 기록을 토대로 지역사회의 예방접종률을 파악하여
예방접종 대상감염병 발생을 예측하고 감염병 유행의 조기 차단도
가능하다[1,2].
위탁의료기관에서 시행한 예방접종 비용은 예방접종 시행 전
예방접종수첩 및 질병관리본부의 ‘예방접종통합관리시스템’을 통해
피접종자의 과거 접종내역을 확인한 후 전산 등록하여 청구하도록
하고 있다. 의료기관은 「예방접종 실시기준 및 방법」을 준수하여
예방접종을 시행하고 중복접종, 불필요한 추가접종 방지를 위해
가급적 당일 전산 등록하여 비용을 신청한다. 신청된 예방접종
비용은 피접종자의 주민등록상 주소지 보건소에서 적정여부를
심사하고 지급심사가 어려운 경우 질병관리본부로 전문심사를
의뢰한다. 심사가 완료되면 보건소에서 비용을 지급하고 지급 완료
후 부당지급이 확인된 경우 해당 보건소에서 비용을 환수하도록
규정하고 있다[1].
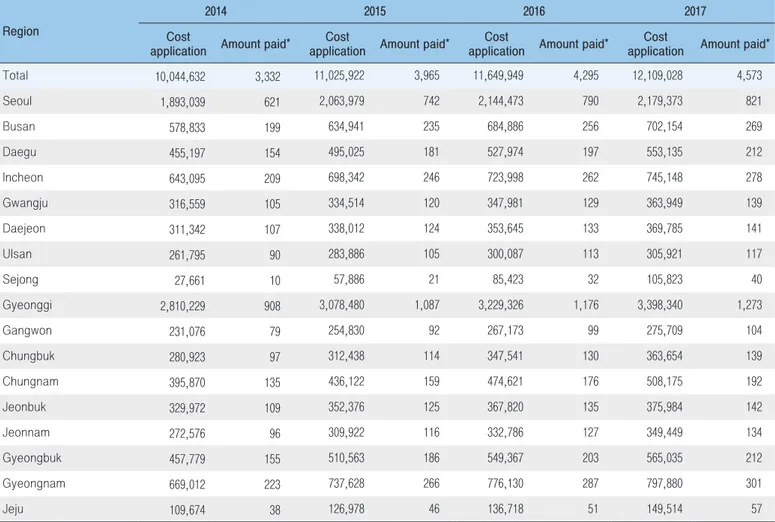
전액 무료 지원 첫해인 2 0 14년 비용 상환 신청 건은
10,044,632건, 지급금액은 3,332억 원이었으나, 2017년 국가예방
접종 참여의료기관의 비용 상환 신청 건수는 12,109,028건,
4,573억 원이 상환되었다. 2017년 예방접종 비용 상환 신청 건수 및
지급금액이 가장 많은 지역은 경기도, 서울, 경남 순으로 나타났다.
경기도의 비용신청 건수는 3,398,340건으로 서울(2,179,373건) 보다
1.6배 정도 많았으며 지급금액 또한 서울의 821억 원 보다 1.6배 많은
1,273억 원에 이른다(Table 4).
국가에서 예방접종 비용을 지원하게 되면서 대부분의 접종이
위탁의료기관에서 시행되고 있어 안전한 예방접종 실시를 위해
Table 2. Reimbursement for vaccination expenses per unit, 2014-2017
(unit: won) Year Types Reimbursement cost (unit price) Enforcement day
2014 Single 18,000 Since May 1, 2014
Mix 4 27,000
2015 Single 18,000
Mix 4 27,000
2016 Single 18,200 Since Feb. 1, 2016
Mix 4 27,300
2017 Single 18,200
Mix 4 27,300
Single 18,400 Since Jun. 19, 2017
Mix 4 27,600
-2017
(unit: %) BCG 3HepB* 4DTaP † 3IPV ‡ 3Hib ∬ 3PCV ∮ 1MMR 1VAR ⁂ 3(2)JEV § 2015 2016 2017 2015 2016 2017 2015 2016 2017 2015 2016 2017 2015 2016 2017 2015 2016 2017 2015 2016 2017 2015 2016 2017 2015 2016 2017 96.7 97.8 98.0 96.3 97.3 97.6 95.6 96.2 96.6 97.4 97.6 97.7 -95.0 95.7 -96.8 97.7 97.8 97.7 97.3 97.5 97.6 92.5 92.7 92.9 94.9 96.3 96.4 94.2 95.7 95.9 94.1 94.8 95.0 95.6 96.1 96.2 -93.8 94.2 -95.3 96.3 96.5 96.5 96.0 96.4 96.3 91.8 91.9 92.0 96.6 97.7 97.8 96.0 97.1 97.2 95.0 95.7 96.1 96.8 97.3 97.2 -94.9 95.3 -96.2 97.3 97.3 97.3 96.9 97.0 97.1 91.1 91.2 91.9 97.3 97.7 98.0 97.2 97.6 97.9 96.0 96.3 96.7 97.8 97.9 97.9 -95.3 95.6 -96.9 98.1 98.0 98.0 97.7 97.6 97.7 91.8 92.0 92.7 96.7 97.9 98.0 96.2 97.5 97.7 96.1 96.7 96.8 97.6 97.8 97.9 -95.2 95.7 -96.8 98.0 98.1 97.9 97.7 97.9 97.8 93.7 93.5 93.6 98.5 99.0 98.9 97.4 98.2 98.5 95.6 96.4 97.1 98.3 98.5 98.5 -95.0 95.7 -97.3 98.6 98.5 98.4 98.1 98.2 98.2 90.4 91.2 91.3 98.4 98.4 98.6 97.6 97.8 98.1 96.5 96.6 97.1 98.3 98.1 98.2 -95.8 96.4 -97.4 98.3 98.1 98.2 97.8 97.6 97.8 94.0 93.4 93.7 98.6 98.7 99.0 98.2 98.5 98.8 97.1 97.8 98.1 98.5 98.9 98.8 -96.5 97.3 -98.3 98.7 98.9 98.9 98.4 98.5 98.7 93.5 93.6 94.9 98.1 98.2 98.9 97.4 97.7 98.3 96.9 97.0 97.5 98.5 98.1 98.6 -95.9 96.5 -97.6 98.9 98.5 98.8 98.5 98.3 98.6 93.8 93.6 93.8 95.9 97.6 97.9 95.9 97.3 97.6 95.7 96.3 96.7 97.3 97.7 97.7 -95.0 95.6 -96.9 97.7 97.9 97.9 97.3 97.6 97.6 92.8 93.1 93.4 98.4 98.6 98.6 97.8 98.0 98.2 96.9 96.8 97.4 98.3 98.1 98.2 -96.1 96.6 -97.6 98.4 98.2 98.2 97.9 98.0 97.9 94.2 93.9 94.0 98.2 98.6 98.6 97.7 98.2 98.2 96.7 97.1 97.5 98.3 98.4 98.4 -96.2 96.7 -97.6 98.4 98.5 98.4 98.0 98.3 98.2 93.9 94.0 94.2 97.9 98.6 98.7 97.0 98.0 98.2 96.6 97.1 97.5 98.2 98.4 98.3 -96.2 96.6 -97.5 98.4 98.4 98.4 97.9 98.1 98.3 94.1 94.1 94.2 97.0 98.3 98.4 96.0 97.6 98.0 96.0 96.5 96.9 97.9 98.1 98.1 -94.5 96.8 -97.3 98.3 98.2 97.1 97.8 97.8 97.4 92.7 92.9 92.8 98.7 98.8 98.9 97.7 98.1 98.4 95.9 96.5 97.2 98.2 98.2 98.4 -95.4 96.1 -97.4 98.3 98.2 98.4 97.8 98.0 98.2 92.2 92.1 91.9 97.6 98.3 98.5 97.4 98.0 98.2 95.9 96.6 97.1 97.9 98.1 98.2 -95.4 96.2 -97.5 98.2 98.3 98.3 97.8 98.0 98.1 92.4 92.5 93.1 97.3 98.5 98.8 97.3 98.2 98.4 96.1 96.6 97.1 98.1 98.3 98.4 -95.3 96.8 -97.6 97.7 98.3 97.7 97.7 98.0 97.9 91.9 92.1 92.6 97.6 98.0 98.3 97.1 97.6 97.9 95.5 95.9 96.3 97.6 97.6 97.8 -94.1 95.0 -96.6 97.9 97.5 97.7 97.0 97.0 97.4 92.3 91.4 92.2 of hepatitis B vaccine; †4DTaP: 4 doses of DTaP-containing vaccine; ‡3IPV: 3 doses of IPV vaccine; ∬3Hib: 3 doses of Hib vaccine; ∮3PCV: 3 doses of PCV vaccine; 1MMR: 1 doses § 3(2)JE: 3 d oses of JE (i nact ivat ed) vacci ne or 2 d oses of JE (li ve atte nuate d ) vacci ne BCG=Bacille Calmette-G úerin; HepB=Hepatitis; DTaP=Diphtheria-Tetanus-acellular-Pertussis; IPV=Inactivated Polio Vaccine; Var=Varicella; MMR=Measles-Mumps-Rubella; JEV=Japanese주간 건강과 질병•제12권 제7호
의료인을 대상으로 기본 및 보수과정의 온라인 교육을 실시하고
있다. 교육과정 운영 외에도 의료기관이 안전한 접종환경을 유지하고
있는지 확인하기 위한 연 2회의 자율점검과 방문점검 등으로
위탁의료기관을 관리하고 있다. 국가예방접종사업의 경우 단순하게
예방접종을 실시하고 등록자료 등을 관리하는 것 외에도 의료기관의
교육, 점검 등을 통하여 정확한 예방접종이 안전하게 시행될 수
있도록 노력하고 있다.
맺는 말
우리나라의 경우 만12세 이하의 어린이가 접종하여야 하는
예방접종의 90% 정도를 국가가 무료로 지원하고 있어 높은
접종률을 유지할 수 있는 것으로 판단된다. 또한, 공공의료기관
외 민간의료기관까지 무료지원을 확대함으로써 접종 서비스의
편의성을 제공하고 있어 국민들이 편리하고 안전하게 예방접종을 할
수 있는 적정 환경이 충분히 조성되었다 할 수 있다.
대부분의 예방접종률이 95% 이상을 유지하고 있으나, 높은
예방접종률 유지를 어렵게 하는 요인으로는 우리나라에서도
퍼지고 있는 백신 거부 운동과 백신 수입 등의 문제 등을 들 수
있다. 백신 거부 운동으로 국내 접종률이 떨어질 경우 퇴치수준의
감염병들이 다시 유행할 수 있으며, 해외 유입 감염병 등에 대한
관리가 어려우므로 95% 수준의 예방접종률이 유지될 수 있도록
예방접종 현황을 꾸준히 모니터링하고 백신 거부 운동 단체 등에서
예방접종에 대한 잘못된 정보를 유포할 경우 등을 대비하여
예방접종에 대한 정확한 정보와 지식을 제공하는데도 많은 노력을
Table 4. Vaccination reimbursement costs by region, 2014-2017
(unit: dose, 100 million won)
Region
2014 2015 2016 2017
Cost
application Amount paid*
Cost
application Amount paid*
Cost
application Amount paid*
Cost
application Amount paid* Total 10,044,632 3,332 11,025,922 3,965 11,649,949 4,295 12,109,028 4,573 Seoul 1,893,039 621 2,063,979 742 2,144,473 790 2,179,373 821 Busan 578,833 199 634,941 235 684,886 256 702,154 269 Daegu 455,197 154 495,025 181 527,974 197 553,135 212 Incheon 643,095 209 698,342 246 723,998 262 745,148 278 Gwangju 316,559 105 334,514 120 347,981 129 363,949 139 Daejeon 311,342 107 338,012 124 353,645 133 369,785 141 Ulsan 261,795 90 283,886 105 300,087 113 305,921 117 Sejong 27,661 10 57,886 21 85,423 32 105,823 40 Gyeonggi 2,810,229 908 3,078,480 1,087 3,229,326 1,176 3,398,340 1,273 Gangwon 231,076 79 254,830 92 267,173 99 275,709 104 Chungbuk 280,923 97 312,438 114 347,541 130 363,654 139 Chungnam 395,870 135 436,122 159 474,621 176 508,175 192 Jeonbuk 329,972 109 352,376 125 367,820 135 375,984 142 Jeonnam 272,576 96 309,922 116 332,786 127 349,449 134 Gyeongbuk 457,779 155 510,563 186 549,367 203 565,035 212 Gyeongnam 669,012 223 737,628 266 776,130 287 797,880 301 Jeju 109,674 38 126,978 46 136,718 51 149,514 57 * Rounding value
기울일 필요가 있다.
또한, 우리나라는 필수예방접종의 90% 이상을 국가가 지원하고
있으나 대부분의 백신을 수입에 의존하고 있어 글로벌 제약사에서
백신 수출을 제한할 경우 예방접종을 중단해야 하는 문제가 있다.
실제로 2017년 7월 네덜란드에서 수입하는 폴리오 단독백신 수입
지연 및 같은 해 10월 피내용 BCG 백신 공급 부족으로 인한 경피용
BCG 백신 임시예방접종 실시 등의 문제가 국내에서 발생한 바 있다.
아울러 국내 제약회사들의 경우 경영규모가 영세하여 백신개발에
비용을 투자하기 어렵고, 임상 시험군 확보 등의 문제로 백신
국산화에는 많은 어려움이 있다. 국가예방접종사업의 원활한 운영,
지원을 위하여 백신 국산화는 우리나라 예방접종 프로그램에서
해결해야 할 또 하나의 과제라 할 수 있다.
백신 거부 운동에 대한 적절한 국가 대응 및 백신 국산화 등의
문제를 해결한다면 우리나라의 예방접종은 질적 수준 향상을 이룰
수 있을 것으로 기대되며, 이를 위해 국가, 의료계, 기업 등의 유기적
협력 관계 구축이 필요할 것으로 판단된다. 향후 국가는 예방접종
항목 확대를 위한 노력뿐 아니라 예방접종 실시 및 접종대상자와
백신 제조, 수입업체 등이 포함된 해당 당사자들과의 인프라 구축
강화 등을 효과적으로 할 수 있는 방안들을 모색할 필요가 있다.
참고문헌
1. 질병관리본부. 2017년 어린이 국가예방접종 지원사업 관리지침. 2017. 2. 질병관리본부. 2017 질병관리백서(제2부). 2018. 3. 질병관리본부. 2015~2017 전국 예방접종률 현황. 2018. 4. 질병관리본부. 2013년 어린이 국가예방접종 지원사업 추진결과. 주간 건강과 질병. 2015;8(2):27-32.주간 건강과 질병•제12권 제7호
통계단신, QuickStats
낙상 입원환자 현황, 2012-2016
Number of Korean patients admitted after falls, 2012-2016
[정의] 낙상: 미끄러지거나 걸려 넘어지는 것으로 심각한 신체의 손상을 동반하고, 심하면 사망에 이름
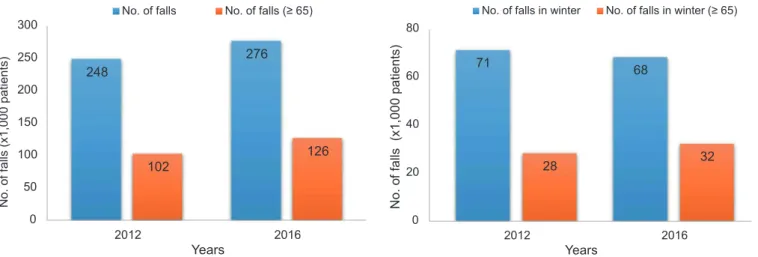
2016년 낙상으로 입원한 환자는 약 27만 6,000명으로 2012년에 비해 11.3% 증가하였고, 특히, 65세 이상에서는 2016년
약 12만 6,000명으로 2012년에 비해 23.5% 증가하였음(그림 A). 또한 겨울철에는 65세 이상에서 낙상 입원환자는 약 3만
2,000명으로 2012년 2만 8,000명에 비해 14.3% 증가하였음(그림 B).
The number of Korean patients admitted after falls grew to 276,000 in 2016, which was an 11.3% increase from
248,000 in 2012. Especially in those aged 65 years and over, the number of patients amounted to 126,000, up to
23.5% from 102,000 in 2012 (Figure A). During winter season, the number of that elderly who were admitted after
falls was approximately 32,000 people, which was 14.3% increase from 28,000 in 2012 (Figure B).
Source: National Hospital Discharge Survey for Injury, http://www.cdc.go.kr/
“National Hospital Discharge Survey for Injury,” based on medical records, produces information on numbers, mechanism and characteristics of hospitalized injury patients in Korea, and provides statistics for injury prevention policies. As samples of this survey, 170 hospitals are participating. Reported by: Division of Chronic Disease Control, Korea Centers for Disease Control and Prevention
Figure A. Number of patients admitted after falls,
2012-2016
Figure B. Number of patients admitted after falls during
winter season, 2012-2016
* Falls: sliding or tripping over, accompanied by serious injury of the body, which may result in death when severe
248
276
102
126
0 50 100 150 200 250 300 2012 2016 N o. of fa lls (x1,000 patients)Years
No. of falls No. of falls (≥ 65)
71 68 28 32 0 20 40 60 80 2012 2016 N o. o f f all s (x 1, 000 p at ie nt s) Years
[홍역 안내문] 홍역 바로알기
구 분
내용
정 의
•홍역 바이러스(Measles virus) 감염에 의한 급성 발열성 발진성 질환
잠복기
•7∼21일(평균 10∼12일)
전염기
•발진 4일 전부터 4일 후 까지
감염경로
•호흡기 분비물 등의 비말 또는 공기감염을 통해 전파
주요증상
및 임상경과
• 전구기 : 전염력이 강한 시기로, 3일 내지 5일간 지속되며 발열,
기침, 콧물, 결막염, 특징적인 구강내 병변(Koplik’s spot) 등이
나타남
• 발진기 : 홍반성 구진성 발진이 목 뒤, 귀 아래에서 시작하여 몸통,
팔다리 순서로 퍼지고 손바닥과 발바닥에도 발생하며 서로 융합됨.
발진은 3일 이상 지속되고 발진이 나타난 후 2일 내지 3일간 고열을
보임
•회복기 : 발진이 사라지면서 색소 침착을 남김
• 연령, 백신 접종력, 수동 면역항체 보유여부에 따라 뚜렷한 전구증상
없이 발열과 가벼운 발진이 나타나는 경우도 있음
진단기준
• (환자) 홍역에 부합되는 임상증상을 나타내거나 역학적 연관성이 있으면서 진단을 위한
검사기준에 따라 감염병병원체 감염이 확인된 사람
- 검체(혈액)에서 특이 IgM 항체 검출
- 회복기 혈청의 항체가가 급성기에 비하여 4배 이상 증가
- 검체(인후·비강·비인두도찰물, 혈액, 소변)에서 바이러스 분리 또는 특이 유전자 검출
• (의사환자) 임상증상 및 역학적 연관성을 감안하여 홍역이 의심되나 진단을 위한 검사기준에
부합하는 검사결과가 없는 사람
환자관리
•환자격리 : 발진이 나타나기 4일 전부터 발진이 시작된 후 4일까지
* 감염관리 일반적 지침 준수, 공기 전파 주의
•접촉자 : 예방접종, 면역글로불린 투여
치료
•보존적 치료 : 안정, 충분한 수분 공급, 기침·고열에 대한 대증치료
예방
•예방접종 : 생후 12∼15개월, 만 4∼6세에 MMR 백신 2회 접종
주간 건강과 질병•제12권 제7호
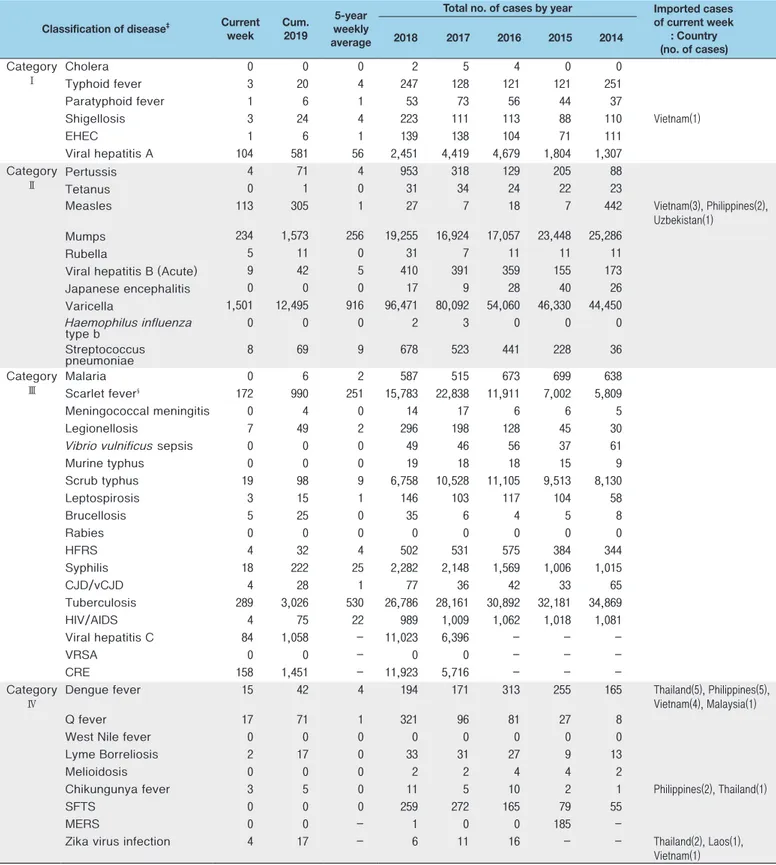
1.1 환자감시 : 전수감시 감염병 주간 발생 현황
(6주차)
Table 1. Reported cases of national infectious diseases in Republic of Korea, week ending February 9, 2019 (6th Week)*
Unit: No. of cases†
Abbreviation: EHEC= Enterohemorrhagic Escherichia coli, HFRS= Hemorrhagic fever with renal syndrome, CJD/vCJD= Creutzfeldt-Jacob Disease / variant Creutzfeldt-Jacob Disease, VRSA= Vancomycin-resistant Staphylococcus aureus, CRE= Carbapenem-resistant Enterobacteriaceae, SFTS= Severe fever with thrombocytopenia syndrome, MERS-CoV= Middle East Respiratory Syndrome Coronavirus.
Cum: Cumulative counts from 1st week to current week in a year.
* The reported data for year 2017, 2018 are provisional but the data from 2013 to 2016 are finalized data.
주요 감염병 통계, Statistics of selected infectious diseases
Classification of disease‡ Current
week Cum.2019
5-year weekly average
Total no. of cases by year Imported cases of current week : Country (no. of cases) 2018 2017 2016 2015 2014 Category Ⅰ Cholera 0 0 0 2 5 4 0 0 Typhoid fever 3 20 4 247 128 121 121 251 Paratyphoid fever 1 6 1 53 73 56 44 37 Shigellosis 3 24 4 223 111 113 88 110 Vietnam(1) EHEC 1 6 1 139 138 104 71 111 Viral hepatitis A 104 581 56 2,451 4,419 4,679 1,804 1,307 Category Ⅱ Pertussis 4 71 4 953 318 129 205 88 Tetanus 0 1 0 31 34 24 22 23
Measles 113 305 1 27 7 18 7 442 Vietnam(3), Philippines(2), Uzbekistan(1)
Mumps 234 1,573 256 19,255 16,924 17,057 23,448 25,286
Rubella 5 11 0 31 7 11 11 11
Viral hepatitis B (Acute) 9 42 5 410 391 359 155 173 Japanese encephalitis 0 0 0 17 9 28 40 26 Varicella 1,501 12,495 916 96,471 80,092 54,060 46,330 44,450 Haemophilus influenza type b 0 0 0 2 3 0 0 0 Streptococcus pneumoniae 8 69 9 678 523 441 228 36 Category Ⅲ Malaria 0 6 2 587 515 673 699 638 Scarlet fever§ 172 990 251 15,783 22,838 11,911 7,002 5,809 Meningococcal meningitis 0 4 0 14 17 6 6 5 Legionellosis 7 49 2 296 198 128 45 30
Vibrio vulnificus sepsis 0 0 0 49 46 56 37 61
Murine typhus 0 0 0 19 18 18 15 9 Scrub typhus 19 98 9 6,758 10,528 11,105 9,513 8,130 Leptospirosis 3 15 1 146 103 117 104 58 Brucellosis 5 25 0 35 6 4 5 8 Rabies 0 0 0 0 0 0 0 0 HFRS 4 32 4 502 531 575 384 344 Syphilis 18 222 25 2,282 2,148 1,569 1,006 1,015 CJD/vCJD 4 28 1 77 36 42 33 65 Tuberculosis 289 3,026 530 26,786 28,161 30,892 32,181 34,869 HIV/AIDS 4 75 22 989 1,009 1,062 1,018 1,081 Viral hepatitis C 84 1,058 - 11,023 6,396 - - -VRSA 0 0 - 0 0 - - -CRE 158 1,451 - 11,923 5,716 - - -Category Ⅳ
Dengue fever 15 42 4 194 171 313 255 165 Thailand(5), Philippines(5), Vietnam(4), Malaysia(1)
Q fever 17 71 1 321 96 81 27 8
West Nile fever 0 0 0 0 0 0 0 0
Lyme Borreliosis 2 17 0 33 31 27 9 13
Melioidosis 0 0 0 2 2 4 4 2
Chikungunya fever 3 5 0 11 5 10 2 1 Philippines(2), Thailand(1)
SFTS 0 0 0 259 272 165 79 55
MERS 0 0 - 1 0 0 185
-Zika virus infection 4 17 - 6 11 16 - - Thailand(2), Laos(1), Vietnam(1)
Cum: Cumulative counts from 1st week to current week in a year
* The reported data for year 2018, 2019 are provisional but the data from 2014 to 2017 are finalized data. Reporting
area
Diseases of Category Ⅰ
Cholera Typhoid fever Paratyphoid fever Shigellosis
Current week Cum.2019 Cum. 5-year average§ Current week Cum.2019 Cum. 5-year average§ Current week Cum.2019 Cum. 5-year average§ Current week Cum.2019 Cum. 5-year average§ Overall 0 0 0 3 20 25 1 6 3 3 24 30 Seoul 0 0 0 2 6 5 1 3 1 1 6 5 Busan 0 0 0 0 2 2 0 1 0 0 0 1 Daegu 0 0 0 0 0 1 0 0 0 0 1 4 Incheon 0 0 0 0 0 3 0 1 0 0 1 6 Gwangju 0 0 0 0 1 0 0 0 0 0 2 1 Daejeon 0 0 0 0 1 1 0 0 0 0 0 0 Ulsan 0 0 0 0 1 1 0 0 0 0 1 0 Sejong 0 0 0 0 0 0 0 0 0 0 0 0 Gyonggi 0 0 0 1 5 5 0 0 1 2 9 5 Gangwon 0 0 0 0 0 1 0 0 0 0 0 0 Chungbuk 0 0 0 0 0 1 0 0 0 0 1 1 Chungnam 0 0 0 0 0 1 0 0 0 0 0 1 Jeonbuk 0 0 0 0 0 0 0 0 1 0 0 0 Jeonnam 0 0 0 0 2 1 0 0 0 0 2 2 Gyeongbuk 0 0 0 0 1 1 0 0 0 0 0 2 Gyeongnam 0 0 0 0 1 2 0 1 0 0 1 1 Jeju 0 0 0 0 0 0 0 0 0 0 0 1
Cum: Cumulative counts from 1st week to current week in a year
* The reported data for year 2018, 2019 are provisional but the data from 2014 to 2017 are finalized data.
† According to surveillance data, the reported cases may include all of the cases such as confirmed, suspected, and asymptomatic carrier in the group. § Cum. 5-year average is mean value calculated by cumulative counts from 1st week to current week for 5 preceding years.
Table 2.
(Continued) Reported cases of infectious diseases by geography, weeks ending February 9, 2019 (6th Week)*
Unit: No. of cases†
Reporting area
Diseases of Category Ⅰ Diseases of Category Ⅱ Enterohemorrhagic
Escherichia coli Viral hepatitis A Pertussis Tetanus Current week Cum. 2019 Cum. 5-year average§ Current week Cum. 2019 Cum. 5-year average§ Current week Cum. 2019 Cum. 5-year average§ Current week Cum. 2019 Cum. 5-year average§ Overall 1 6 2 104 581 336 4 71 28 0 1 0 Seoul 1 3 0 12 97 61 1 12 7 0 0 0 Busan 0 0 0 2 11 9 0 3 2 0 0 0 Daegu 0 0 1 1 4 9 0 7 0 0 0 0 Incheon 0 1 0 7 33 25 0 2 3 0 0 0 Gwangju 0 0 0 2 8 6 0 4 1 0 0 0 Daejeon 0 0 0 29 102 14 0 2 0 0 0 0 Ulsan 0 0 0 0 2 5 0 3 1 0 0 0 Sejong 0 0 0 2 10 2 0 3 1 0 0 0 Gyonggi 0 1 1 27 162 111 0 9 5 0 0 0 Gangwon 0 0 0 2 21 8 0 1 0 0 1 0 Chungbuk 0 0 0 4 32 12 0 3 1 0 0 0 Chungnam 0 0 0 10 44 24 0 1 1 0 0 0 Jeonbuk 0 0 0 2 23 22 0 2 1 0 0 0 Jeonnam 0 0 0 1 5 9 1 6 1 0 0 0 Gyeongbuk 0 0 0 1 15 7 1 7 2 0 0 0 Gyeongnam 0 0 0 2 11 9 1 5 2 0 0 0 Jeju 0 1 0 0 1 3 0 1 0 0 0 0
Cum: Cumulative counts from 1st week to current week in a year
* The reported data for year 2018, 2019 are provisional but the data from 2014 to 2017 are finalized data. Reporting
area
Diseases of Category Ⅱ
Measles Mumps Rubella Viral hepatitis B(Acute)
Current week Cum. 2019 Cum. 5-year average§ Current week Cum. 2019 Cum. 5-year average§ Current week Cum. 2019 Cum. 5-year average§ Current week Cum. 2019 Cum. 5-year average§ Overall 113 305 3 234 1,573 2,053 5 11 1 9 42 32 Seoul 36 60 1 27 213 192 1 1 0 4 8 5 Busan 2 14 0 24 104 161 0 0 0 0 4 2 Daegu 6 36 0 7 56 62 0 0 0 0 1 1 Incheon 8 14 0 11 69 70 0 2 0 0 3 2 Gwangju 0 0 0 11 56 169 0 0 0 0 0 1 Daejeon 2 4 1 8 41 53 0 0 0 0 1 1 Ulsan 0 3 0 11 72 63 0 0 0 0 0 1 Sejong 1 2 0 2 10 7 0 0 0 0 0 0 Gyonggi 46 136 1 38 406 454 1 2 1 2 10 8 Gangwon 6 8 0 5 44 84 0 0 0 0 1 1 Chungbuk 1 2 0 7 62 38 0 0 0 0 1 1 Chungnam 0 3 0 15 73 76 0 0 0 1 2 1 Jeonbuk 0 3 0 15 82 206 1 2 0 0 1 2 Jeonnam 3 6 0 13 54 115 0 0 0 0 3 1 Gyeongbuk 1 10 0 15 73 75 1 1 0 2 3 2 Gyeongnam 1 2 0 21 134 200 1 3 0 0 3 3 Jeju 0 2 0 4 24 28 0 0 0 0 1 0
Cum: Cumulative counts from 1st week to current week in a year
* The reported data for year 2018, 2019 are provisional but the data from 2014 to 2017 are finalized data.
† According to surveillance data, the reported cases may include all of the cases such as confirmed, suspected, and asymptomatic carrier in the group. § Cum. 5-year average is mean value calculated by cumulative counts from 1st week to current week for 5 preceding years.
Table 2. (Continued) Reported cases of infectious diseases by geography, weeks ending February 9, 2019 (6th Week)*
Unit: No. of cases†
Reporting area
Diseases of Category Ⅱ Diseases of Category Ⅲ
Japanese encephalitis Varicella Malaria Scarlet fever¶
Current week Cum. 2019 Cum. 5-year average§ Current week Cum. 2019 Cum. 5-year average§ Current week Cum. 2019 Cum. 5-year average§ Current week Cum. 2019 Cum. 5-year average§ Overall 0 0 0 1,501 12,495 8,285 0 6 9 172 990 1,660 Seoul 0 0 0 160 1,279 905 0 0 4 25 150 203 Busan 0 0 0 71 623 522 0 1 0 9 56 134 Daegu 0 0 0 56 549 488 0 0 0 5 28 57 Incheon 0 0 0 72 636 469 0 1 1 9 50 70 Gwangju 0 0 0 107 769 221 0 0 0 8 61 79 Daejeon 0 0 0 21 194 239 0 0 0 11 44 57 Ulsan 0 0 0 23 256 257 0 1 0 5 40 71 Sejong 0 0 0 9 178 49 0 0 0 1 8 5 Gyonggi 0 0 0 383 3,330 2,366 0 2 3 43 279 467 Gangwon 0 0 0 21 226 258 0 0 1 1 16 21 Chungbuk 0 0 0 38 233 192 0 0 0 3 23 31 Chungnam 0 0 0 53 489 358 0 0 0 12 65 75 Jeonbuk 0 0 0 80 529 369 0 0 0 9 40 62 Jeonnam 0 0 0 80 645 404 0 0 0 10 32 71 Gyeongbuk 0 0 0 82 717 361 0 0 0 6 42 94 Gyeongnam 0 0 0 206 1,480 607 0 1 0 13 51 139 Jeju 0 0 0 39 362 220 0 0 0 2 5 24
Cum: Cumulative counts from 1st week to current week in a year
* The reported data for year 2018, 2019 are provisional but the data from 2014 to 2017 are finalized data. Reporting
area
Diseases of Category Ⅲ
Meningococcal meningitis Legionellosis Vibrio vulnificus sepsis Murine typhus Current week Cum.2019 Cum. 5-year average§ Current week Cum.2019 Cum. 5-year average§ Current week Cum.2019 Cum. 5-year average§ Current week Cum.2019 Cum. 5-year average§ Overall 0 4 1 7 49 12 0 0 0 0 0 0 Seoul 0 0 1 2 14 4 0 0 0 0 0 0 Busan 0 0 0 0 2 1 0 0 0 0 0 0 Daegu 0 0 0 0 3 0 0 0 0 0 0 0 Incheon 0 0 0 1 2 1 0 0 0 0 0 0 Gwangju 0 0 0 0 0 0 0 0 0 0 0 0 Daejeon 0 0 0 0 0 0 0 0 0 0 0 0 Ulsan 0 0 0 1 1 1 0 0 0 0 0 0 Sejong 0 0 0 0 0 0 0 0 0 0 0 0 Gyonggi 0 2 0 1 14 4 0 0 0 0 0 0 Gangwon 0 2 0 0 3 0 0 0 0 0 0 0 Chungbuk 0 0 0 0 2 0 0 0 0 0 0 0 Chungnam 0 0 0 0 0 0 0 0 0 0 0 0 Jeonbuk 0 0 0 0 1 0 0 0 0 0 0 0 Jeonnam 0 0 0 0 1 0 0 0 0 0 0 0 Gyeongbuk 0 0 0 2 5 1 0 0 0 0 0 0 Gyeongnam 0 0 0 0 1 0 0 0 0 0 0 0 Jeju 0 0 0 0 0 0 0 0 0 0 0 0
Cum: Cumulative counts from 1st week to current week in a year
* The reported data for year 2018, 2019 are provisional but the data from 2014 to 2017 are finalized data.
† According to surveillance data, the reported cases may include all of the cases such as confirmed, suspected, and asymptomatic carrier in the group. § Cum. 5-year average is mean value calculated by cumulative counts from 1st week to current week for 5 preceding years.
Table 2.
(Continued) Reported cases of infectious diseases by geography, weeks ending February 9, 2019 (6th Week)*
Unit: No. of cases†
Reporting area
Diseases of Category Ⅲ
Scrub typhus Leptospirosis Brucellosis with renal syndromeHemorrhagic fever
Current week Cum.2019 Cum. 5-year average§ Current week Cum.2019 Cum. 5-year average§ Current week Cum.2019 Cum. 5-year average§ Current week Cum.2019 Cum. 5-year average§ Overall 19 98 82 3 15 4 5 25 0 4 32 34 Seoul 1 4 4 1 6 0 0 5 0 0 2 2 Busan 1 6 4 0 0 0 0 2 0 0 0 0 Daegu 0 0 1 0 0 0 0 0 0 0 0 0 Incheon 0 1 2 0 0 0 1 1 0 0 1 1 Gwangju 0 2 1 0 1 0 0 0 0 0 0 0 Daejeon 4 9 3 1 1 0 1 1 0 1 1 1 Ulsan 1 6 3 1 1 0 0 0 0 0 0 0 Sejong 1 1 0 0 0 0 0 0 0 0 0 0 Gyonggi 1 6 8 0 4 1 1 8 0 1 6 13 Gangwon 0 1 2 0 0 0 0 0 0 0 1 3 Chungbuk 0 0 1 0 0 0 0 1 0 0 2 1 Chungnam 0 9 5 0 1 0 0 0 0 0 4 2 Jeonbuk 2 6 7 0 0 1 0 0 0 1 6 3 Jeonnam 4 19 16 0 1 1 0 2 0 0 5 2 Gyeongbuk 2 7 4 0 0 0 2 5 0 1 4 4 Gyeongnam 2 16 18 0 0 1 0 0 0 0 0 2 Jeju 0 5 3 0 0 0 0 0 0 0 0 0
Cum: Cumulative counts from 1st week to current week in a year
* The reported data for year 2018, 2019 are provisional but the data from 2014 to 2017 are finalized data. Reporting
area
Diseases of Category Ⅲ Diseases of Category Ⅳ Syphilis CJD/vCJD Tuberculosis Dengue fever Current week Cum.2019 Cum. 5-year average§ Current week Cum.2019 Cum. 5-year average§ Current week Cum.2019 Cum. 5-year average§ Current week Cum.2019 Cum. 5-year average§ Overall 18 222 177 4 28 5 289 3,026 3,368 15 42 22 Seoul 1 36 41 0 6 1 45 520 660 2 12 7 Busan 2 23 11 0 2 0 33 217 259 0 0 2 Daegu 0 9 8 0 0 0 14 128 173 1 1 2 Incheon 2 19 15 1 2 0 23 155 172 0 3 1 Gwangju 1 2 6 0 0 0 5 81 90 1 1 0 Daejeon 1 6 6 0 1 0 7 69 83 0 0 1 Ulsan 1 4 1 1 1 0 3 43 67 2 3 0 Sejong 0 0 1 0 1 0 1 6 9 0 0 0 Gyonggi 1 53 46 2 6 2 55 670 697 5 11 6 Gangwon 0 7 5 0 2 0 11 127 141 0 4 0 Chungbuk 0 7 5 0 1 0 4 93 102 1 1 0 Chungnam 0 12 5 0 1 1 16 133 144 0 1 1 Jeonbuk 1 10 3 0 1 0 14 135 129 0 1 0 Jeonnam 2 4 5 0 1 0 17 167 159 0 1 0 Gyeongbuk 4 13 7 0 2 1 20 229 226 1 1 1 Gyeongnam 2 10 7 0 1 0 20 214 222 2 2 1 Jeju 0 7 5 0 0 0 1 39 34 0 0 0
Cum: Cumulative counts from 1st week to current week in a year
* The reported data for year 2018, 2019 are provisional but the data from 2014 to 2017 are finalized data.
† According to surveillance data, the reported cases may include all of the cases such as confirmed, suspected, and asymptomatic carrier in the group. § Cum. 5-year average is mean value calculated by cumulative counts from 1st week to current week for 5 preceding years.
Table 2.
(Continued) Reported cases of infectious diseases by geography, weeks ending February 9, 2019 (6th Week)*
Unit: No. of cases†
Reporting area
Diseases of Category Ⅳ
Q fever Lyme Borreliosis SFTS Zika virus infection Current week Cum.2019 Cum. 5-year average§ Current week Cum.2019 Cum. 5-year average§ Current week Cum.2019 Cum. 5-year average§ Current week Cum.2019 Cum. 5-year average§ Overall 17 71 5 2 17 0 0 0 0 4 17 -Seoul 3 14 1 0 7 0 0 0 0 1 7 -Busan 0 5 0 0 1 0 0 0 0 0 2 -Daegu 1 1 0 0 0 0 0 0 0 0 0 -Incheon 1 2 0 1 3 0 0 0 0 0 2 -Gwangju 1 5 0 0 0 0 0 0 0 0 0 -Daejeon 0 3 0 0 1 0 0 0 0 0 0 -Ulsan 4 8 0 1 2 0 0 0 0 0 0 -Sejong 2 2 0 0 0 0 0 0 0 0 0 -Gyonggi 1 15 1 0 1 0 0 0 0 1 1 -Gangwon 1 2 0 0 0 0 0 0 0 0 0 -Chungbuk 0 2 1 0 0 0 0 0 0 1 1 -Chungnam 0 0 1 0 1 0 0 0 0 0 0 -Jeonbuk 0 3 0 0 1 0 0 0 0 0 0 -Jeonnam 2 7 0 0 0 0 0 0 0 0 2 -Gyeongbuk 1 1 0 0 0 0 0 0 0 1 1 -Gyeongnam 0 1 1 0 0 0 0 0 0 0 1 -Jeju 0 0 0 0 0 0 0 0 0 0 0
-1. Influenza, Republic of Korea, weeks ending February 9, 2019 (6th week)
●
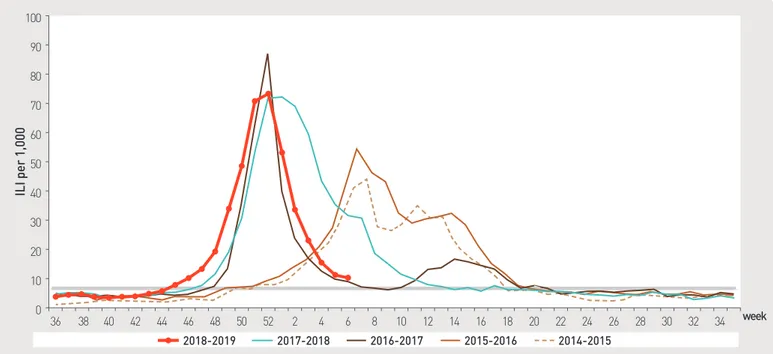
2019년도 제 6주 인플루엔자 표본감시(전국 200개 표본감시기관) 결과, 의사환자분율은 외래환자 1,000명당 10.2명으로 지난주(11.3명) 대비 감소
※ 2018-2019절기 유행기준은 6.3명(/1,000)
Figure 1. Weekly proportion of influenza-like illness per 1,000 outpatients, 2014-2015 to 2018-2019 flu seasons
0 20 10 40 30 60 70 80 90 50 100 36 38 40 42 44 46 48 50 52 2 4 6 8 10 12 14 16 18 20 22 24 26 28 30 32 34ILI per 1,000
week 2015-2016 2016-2017 2014-2015 2017-2018 2018-2019 week 0 10.0 5.0 20.0 15.0 30.0 35.0 40.0 45.0 50.0 25.0 55.0No. of outpatients / 1,000
2. Hand, Foot and Mouth Disease(HFMD), Republic of Korea, weeks ending February 9, 2019 (6th week)
●
2019년도 제6주차 수족구병 표본감시(전국 95개 의료기관) 결과, 의사환자 분율은 외래환자 1,000명당 1.2명으로 전주(0.5명) 대비 증가
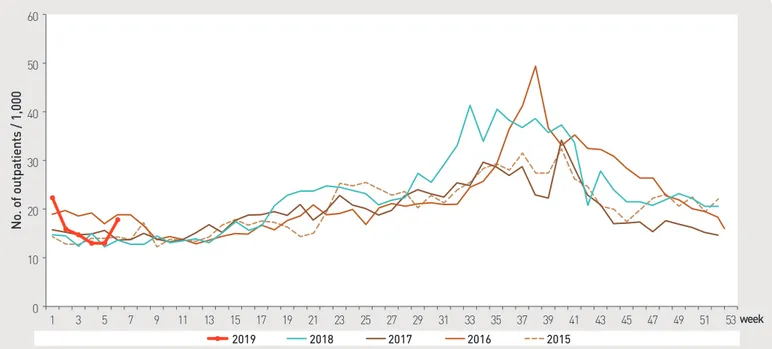
Figure 3. Weekly proportion of epidemic keratoconjunctivitis per 1,000 outpatients
0 10 20 30 40 50 60 1 3 5 7 9 11 13 15 17 19 21 23 25 27 29 31 33 35 37 39 41 43 45 47 49 51 53No. of outpatients / 1,000
week 2019 2018 2017 2016 2015Figure 4. Weekly proportion of acute hemorrhagic conjunctivitis per 1,000 outpatients
0 1 2 3 4 5 1 3 5 7 9 11 13 15 17 19 21 23 25 27 29 31 33 35 37 39 41 43 45 47 49 51 53No. of outpatients / 1,000
week 2019 2018 2017 2016 20153. Ophthalmologic infectious disease, Republic of Korea, weeks ending February 9, 2019 (6th week)
●
2019년도 제6주차 유행성각결막염 표본감시(전국 92개 의료기관) 결과, 외래환자 1,000명당 분율은 17.8명으로 전주 13.1명 대비 증가
▣ Waterborne and foodborne disease outbreaks, Republic of Korea, weeks ending February 9, 2019 (6th week)
●
2019년도 제6주에 집단발생이 6건(사례수 27명) 발생하였으며 누적발생건수는 48건(사례수 521명)이 발생함.
1.3 수인성 및 식품매개 감염병 집단발생 주간 현황 (6주차)
Figure 5. Number of waterborne and foodborne disease outbreaks reported by week, 2018-2019
Unit: No. of cases/sentinels
Cum: Cumulative counts from 1st week to current week in a year
† According to surveillance data, the reported cases may include all of the cases such as confirmed, suspected, and asymptomatic carrier in the group. § Cum. 5-year average is mean value calculated by cumulative counts from 1st week to current week for 5 preceding years.
※ 문의: (043) 719-7919, 7922
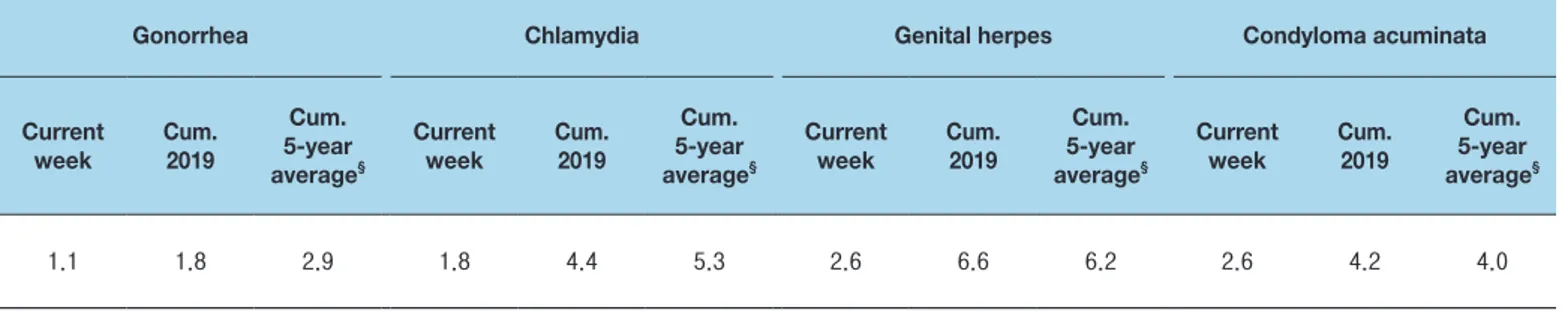
클라미디아 감염증 1.8건, 임질 1.1건 발생을 신고함.
※ 제6주차 신고의료기관 수 : 임질 10개, 클라미디아 28개, 성기단순포진 22개, 첨규콘딜롬 16개
Gonorrhea Chlamydia Genital herpes Condyloma acuminata
Current week Cum.2019 Cum. 5-year average§ Current week Cum.2019 Cum. 5-year average§ Current week Cum.2019 Cum. 5-year average§ Current week Cum.2019 Cum. 5-year average§ 1.1 1.8 2.9 1.8 4.4 5.3 2.6 6.6 6.2 2.6 4.2 4.0 0 5 15 20 30 50 10 1 3 5 7 9 11 13 15 17 19 21 23 25 27 29 31 33 35 37 39 41 43 45 47 49 51 week 2019 2018 Average no. of cases in last 5 years(2013-2017)
70 90
2. Respiratory viruses, Republic of Korea, weeks ending February 2, 2019 (5th week)
●
2019년도 제5주 호흡기 검체(226건)에 대한 유전자 검사결과 44.3%의 호흡기 바이러스가 검출되었음.
(최근 4주 평균 263개의 호흡기 검체에 대한 유전자 검사결과를 나타내고 있음)
※ 주별통계는 잠정통계이므로 변동가능
* 6주차 검사결과는 설 연휴로 인하여 다음 주에 6주차, 7주차 통합하여 업데이트 예정
- HAdV : human Adenovirus, HPIV : human Parainfluenza virus, HRSV : human Respiratory syncytial virus, IFV : Influenza virus, HCoV : human Coronavirus, HRV : human Rhinovirus, HBoV : human Bocavirus, HMPV : human Metapneumovirus
※ the rate of detected cases between January 6, 2019 – February 2, 2019 (Average No. of detected cases is 263 last 4 weeks) ∀ 2018 Cum. : the rate of detected cases between January 01, 2018 - December 29, 2018
2019 (week)
Weekly total Detection rate (%)
No. of samples Detection rate (%) HAdV HPIV HRSV IFV HCoV HRV HBoV HMPV
2 285 63.5 5.6 2.1 6.3 33.7 6.7 7.7 0.7 0.7 3 283 55.5 3.9 0.7 6.0 29.7 4.2 9.5 1.1 0.4 4 257 52.9 11.3 0.4 4.3 19.8 5.8 9.3 0.4 1.6 5 226 44.3 3.5 0.9 8.4 14.2 5.3 11.1 0.4 0.4 Cum.※ 1,051 54.0 6.1 1.0 6.3 24.3 5.5 9.4 0.6 0.8 2018 Cum.∀ 11,966 63.0 6.8 6.1 4.4 17.0 5.7 16.3 1.7 4.9
2.1 병원체감시 : 인플루엔자 및 호흡기바이러스 주간 감시 현황
(5주차)
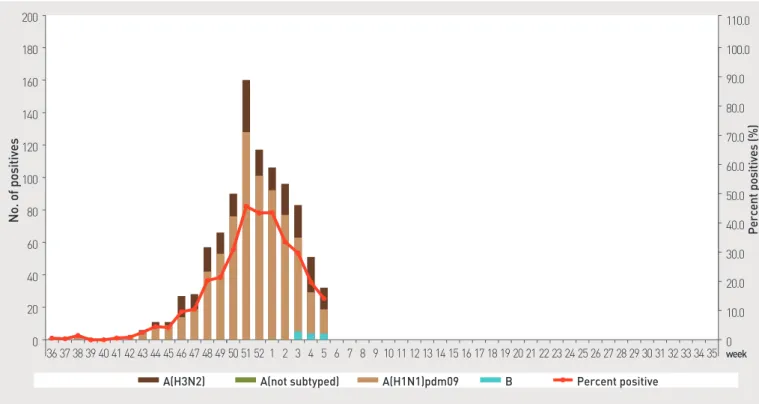
Figure 6. Number of specimens positive for influenza by subtype, 2018-2019 flu season
0 100 120 140 160 80 60 40 20 0 20.0 10.0 40.0 30.0 60.0 70.0 80.0 90.0 50.0 100.0 110.01. Influenza viruses, Republic of Korea, weeks ending February 2, 2019 (5th week)
●
2019년도 제5주에 전국 52개 감시사업 참여의료기관에서 의뢰된 호흡기검체 226건 중 양성 32건 (A/H1N1pdm09 15건, A/H3N2 13건, B형 4건).
* 6주차 검출현황은 설 연휴로 인하여 다음 주에 6주차, 7주차 통합하여 업데이트 예정 180 200No. of positives
Percent positives (%) week A(H3N2) A(not subtyped) A(H1N1)pdm09 B Percent positive34 36373839404142434445464748495051 521 2 3 4 5 6 7 8 9101112131415161718192021222324252627282930313233 35
▶ 자세히 보기 : 질병관리본부 → 질병·건강 → 주간 질병감시정보
◆ Acute gastroenteritis-causing viruses
* The samples were collected from children ≤5 years of sporadic acute gastroenteritis in Korea.
◆ Acute gastroenteritis-causing bacteria
Week sampleNo. of
No. of isolation (Isolation rate, %) Salmonella spp. Pathogenic E.coli Shigella spp. V.parahaem olyticus V. cholerae Campylobacter
spp. C.perfringens S. aureus B. cereus Total
2019 2 134 1 (0.7) 2 (1.5) 0 (0) 0 (0) 0 (0) 0 (0) 2 (1.5) 3 (2.2) 0 (0) 8 (6.0) 3 153 3 (2.0) 2 (1.3) 0 (0) 0 (0) 0 (0) 1 (0.7) 5 (3.3) 5 (3.3) 1 (0.7) 17 (11.1) 4 174 1 (0.6) 2 (1.1) 0 (0) 0 (0) 0 (0) 1 (0.6) 7 (4.0) 3 (1.7) 1 (0.6) 15 (8.6) 5 30 0 (0) 0 (0) 0 (0) 0 (0) 0 (0) 0 (0) 0 (0) 0 (0) 0 (0) 0 (0) Cum. 491 5 (1.0) 6 (1.2) 0 (0) 0 (0) 0 (0) 2 (0.4) 14 (2.9) 11 (2.2) 2 (0.4) 40 (8.1)
* Bacterial Pathogens ; Salmonella spp., E. coli (EHEC, ETEC, EPEC, EIEC), Shigella spp., Vibrio parahaemolyticus, Vibrio cholerae, Campylobacter spp., Clostridium perfringens, Staphylococcus aureus, Bacillus cereus, Listeria monocytogenes, Yersinia enterocolitica.
* Hospital participating in laboratory surveillance in 2018 (70 hospitals)
▣
Acute gastroenteritis-causing viruses and bacteria, Republic of Korea, weeks ending February 2, 2019 (5th week)
●
2019년도 제5주 실험실 표본감시(17개 시·도 보건환경연구원 및 70개 의료기관) 급성설사질환 유발 바이러스 검출 건수는 21건(75.0%), 세균
검출 건수는 0건(0.0%) 이었음.
Week No. of sample
No. of detection (Detection rate, %)
Norovirus Group A Rotavirus Enteric Adenovirus Astrovirus Sapovirus Total
2019 2 40 14 (35.0) 2 (5.0) 0 (0.0) 0 (0.0) 1 (2.5) 17 (42.5) 3 69 29 (42.0) 5 (7.2) 0 (0.0) 2 (2.9) 0 (0.0) 36 (52.2) 4 51 17 (33.3) 4 (7.8) 0 (0.0) 2 (3.9) 0 (0.0) 23 (45.1) 5 28 18 (64.3) 2 (7.1) 0 (0.0) 1 (3.6) 0 (0.0) 21 (75.0) Cum. 224 92 (41.1) 13 (5.8) 0 (0.0) 5 (2.2) 1 (0.4) 111 (49.6)
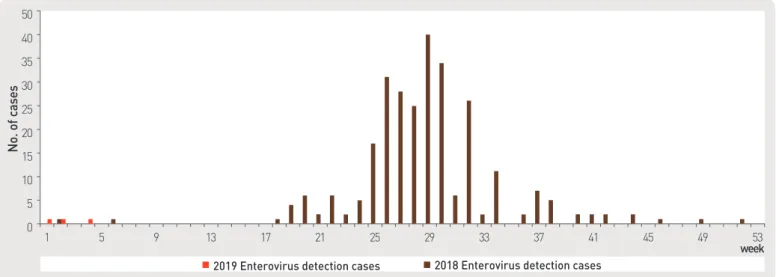
2.3 병원체감시 : 엔테로바이러스 실험실 주간 감시 현황
(5주차)
▣ Enterovirus, Republic of Korea, weeks ending Feburary 2, 2019 (5th week)
●
2019년도 제5주 실험실 표본감시(14개 시·도 보건환경연구원, 전국 57개 참여병원) 결과, 엔테로바이러스 검출률 16.7%(1건 양성/6 검체),
2019년 누적 양성률 9.5%(7건 양성/74 검체)임.
- 무균성수막염 0건(2019년 누적 3건), 수족구병 및 포진성구협염 0건(2019년 누적 3건), 합병증 동반 수족구 0건(2019년 누적 0건), 기타 1건(2019년 누적 1건)임.
◆ HFMD and Herpangina
Figure 8. Detection cases of enterovirus in HFMD and herpangina patients from 2018 to 2019
0 5 10 20 15 25 30 40 35 50 1 5 9 13 17 21 25 29 33 37 41 45 49 532019 Enterovirus detection cases 2018 Enterovirus detection cases
No. of cases
week◆ HFMD with Complications
0 4 3 2 1 5 6 7 8 9 10 1 5 9 13 17 21 25 29 33 37 41 45 49 532018 Enterovirus detection cases 2019 Enterovirus detection cases
No. of cases
week
◆ Aseptic meningitis
Figure 7. Detection cases of enterovirus in aseptic meningitis patients from 2018 to 2019
0 20 40 60 80 1 5 9 13 17 21 25 29 33 37 41 45 49 53No. of cases
week 2018 Enterovirus detection cases<통계표 1>은 지난 5년간 발생한 법정감염병과 2018년 해당 주 발생현황을 비교한 표로, 금주 환자 수(Current week)는 2018년 해당 주의
신고건수를 나타내며, 2018년 누계 환자수(Cum. 2018)는 2018년 1주부터 해당 주까지의 누계 건수, 그리고 5년 주 평균 환자수(5-year
weekly average)는 지난 5년(2013-2017년) 해당 주의 신고건수와 이전 2주, 이후 2주의 신고건수(총 25주) 평균으로 계산된다. 그러므로
금주 환자수(Current week)와 5년 주 평균 환자수(5-year weekly average)의 신고건수를 비교하면 해당 주 단위 시점과 예년의 신고
수준을 비교해 볼 수 있다. 연도별 환자수(Total no. of cases by year)는 지난 5년간 해당 감염병 현황을 나타내는 확정 통계이며 연도별
현황을 비교해 볼 수 있다.
예) 2018년 12주의 5년 주 평균 환자수(5-year weekly average)는 2013년부터 2017년의 10주부터 14주까지의 신고 건수를
총 25주로 나눈 값으로 구해진다.
* 5년 주 평균 환자수(5-year weekly average)=(X1 + X2 + … + X25)/25
10주 11주 12주 13주 14주 2018년 해당 주 2017년 X1 X2 X3 X4 X5 2016년 X6 X7 X8 X9 X10 2015년 X11 X12 X13 X14 X15 2014년 X16 X17 X18 X19 X20 2013년 X21 X22 X23 X24 X25