ICCAS2005 June 2-5, KINTEX, Gyeonggi-Do, Korea
1. INTRODUCTION
The traction system is composed of motor block and traction motor. They are important electric devices on KTX. Motor block controls speed and acceleration by changing voltage supplied into traction motor. The changed voltage used for the input power of traction motor in the bogie frame generates the driving power.
In this paper, we build the on-line measuring system to verify the performance and function of the traction system used in KTX. The data recorded by running and braking measurement system is analyzed and evaluated. Here, the signal control system and data recording equipment are described and the structure and principle of the main circuit system is simply explained.
We compare running distance, time and acceleration change with the design target. The changes of running distance and time are observed with regards to the number of the operating motor blocks. By these results, the traction characteristics of KTX are conformed and evaluated.
2. COMPOSITION OF MEASUREMENT SYSTEM 2.1 Measurement System
The traction measurement system is used to confirm the reliability and performance of the traction system on KTX when it runs on the conventional line and the high speed line.
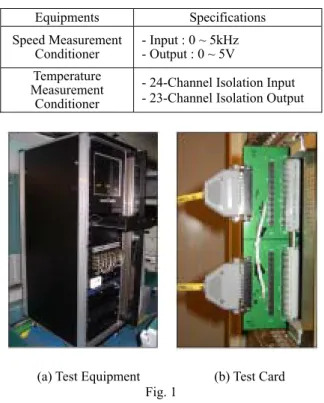
The traction system consists mainly of collecting and recording device and signal control device. The following Table 1 and 2 are the specification of this system.
Table 1 Data acquisition device with storage
Equipments Specifications Portable DAQ System - CPU : P4 2.0 - RAM : 256 DDR - HDD : 40GB - OS : Windows 2000 DAQ Card - 32 DI/ 64 SE - 12-Bit Resolution - 1.25 MS/S - 2 Counter/Timer
Digital I/O Card - 24-Channel Isolation Input - 23-Channel Isolation Output
Table 2 Signal conditioner device
Equipments Specifications Speed Measurement
Conditioner - Input : 0 ~ 5kHz - Output : 0 ~ 5V Temperature
Measurement Conditioner
- 24-Channel Isolation Input - 23-Channel Isolation Output
(a) Test Equipment (b) Test Card Fig. 1
2.2 Measurement Program
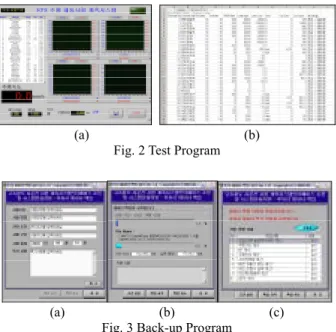
In the test program, the channel configuration part plays an important role to receive, modify and manage the information of the measurement channel. The test part shows 4 graphs that display 2 channel respectively. It can analyze and monitor total 8 channels on real-time.
The test diagnosis part shows the desired measuring status in 2 graphs that display 2 channel respectively. It can verify and monitor the data on real-time. Also, in the excel format channel part, the channel configuration values are stored and managed in excel format.
Fig. 2 (a) shows the test part of the test program and (b) shows the screen that displays the excel program, which receives the stored channel configuration values in excel format channel part.
Back-up program saves each channel data stored in
Running Characteristics for On-Line Test of Railway Vehicle
Young-Jae Han*, Seog-Won Kim*, Sung-Il Seo*, Jin-Yong Mok*, Su-Gil Lee*, and Young-Mo Kim* * KRRI, Woulam-Dong, Uiwang-City, Kyounggi-Do, Korea
(Tel : +82-31-460-5614; E-mail: [email protected])
Abstract: Recently, as the road capacity reaches a limit and environmental problems become serious, there exists a gradual
increasing need for railway vehicles that are environment-friendly, punctual, reliable and safe. Accordingly, in addition to conventional railroad vehicles, lots of vehicles are being newly developed. Using the developed installed measurement system, the performance characteristics of railway vehicle could be monitored precisely. After recording the input real time data of each signal from railway vehicle to the network line, we could acquire the needed information through post processing program. We could verify the running performances of railway vehicle using this system. As a result, many latent defects have been found and corrected in the prototype train. The measurement systems have contributed to dramatic reduction of the developing period.
Keywords: high-speed train, on-line test, propulsion system, motor block
ICCAS2005 June 2-5, KINTEX, Gyeonggi-Do, Korea
the measuring system to process the data by the analysis
program. Also, the program performs the required operation using each channel value and saves the created calculation channels.
Fig. 3 (a) can put down various matters with printing a report as an initial screen of the back-up program. Fig. 3 (b) shows a process that divides the stored files into each channel corresponding with channel name. Fig. 3 (c) shows a process that calculates the items which needed to be operated after channel division.
The analysis program performs signal processing, comparison and analysis using the test data acquired through on-line test. The program starts with selecting any directory in which the files processed through the back-up program exist.
(a) (b) Fig. 2 Test Program
(a) (b) (c) Fig. 3 Back-up Program
Fig. 4 (a) shows the initial screen of the analysis program. This part can add and delete analyzing channels. It can save the configured channels with a file. Also, users are able to zoom in and zoom out the data displayed in a graph, and can analyze the data by selecting a desired section.
Fig. 4 (b) shows the main screen that displays the signal processing and analysis of the data with the appointed time. As shown in Fig. 4 (c), frequency analysis helps to analyze the frequency characteristics of the data through a its spectrum, which is displayed in graph. Also, the data can be analyzed in X-Y graph as shown in Fig. 4 (d).
(a) (b)
(c) (d) Fig. 4 Analysis Program
3. PROPULSION SYSTEM
KTX uses synchronous motors for traction like TGV. Therefore, current–type inverter is needed for traction. It is single phase HCB(Half-Controlled SCR Bridge) controlled by rectifier and two HCBs which are connected serially. The following Fig. 5 shows the main circuit system of KTX.
Fig. 5 Main circuit system
Power-factor compensation circuit is installed in front of the converter. It controls phase difference of the input voltage and the input current of the converter. It compensates the power factor.
The capacity of one converter is 1,216 KVA and the input voltage of the converter is 1,800 VAC. The dc current link voltage is controlled as about 1,500 VDC.
4. COMPARISON OF TRACTION PERFORMANCE
Here, running distance, running time and change of acceleration are tested as the number of traction motor blocks which is changed into 4,5 or 6. The data is precisely analyzed. The simulated results at the design stage are compared with the measured results at the test running. A little difference is caused by the testing condition such as gradient and curve of the line. Fig. 6 and 7 show the measured results of running distance and time when all of the motor blocks installed on KTX are operating at full power.
According to the specification of KTX, the running
ICCAS2005 June 2-5, KINTEX, Gyeonggi-Do, Korea
distance should be within 20km and the running time
to reach the speed of 300km/h should be within 365 second . As shown in Fig. 6 and 7, running distance was 13,681m and running time was 268.52s, which satisfy the specification. The average acceleration was 0.31m/s2
up to 300km/h.
The design running distance and time are similar with the test running distance and time until 120km/h. However, above 120km/h some difference is shown. The reasons for the difference can be explained as follows.
(1) The design results come from simulation for the straight and flat line.
(2) The measured results come from actual test on the line
(3) The design results are based on the condition that a thousand peoples are on the vehicle.
(4) The measured results are based on the condition that peoples only for test are on the vehicle.
Fig. 6 Running distance in case of full powering
Fig. 7 Running time in case of full powering
5. TEST RESULT FOR BRAKING SYSTEM
Fig. 8 and 9 show the measured data for running distance and time when rheostatic brake and disk brake are operated. The design values for braking distance and braking time are 3,090m and 71.91s respectively. The measured values for braking distance and time are 3,362m and 74.14s, respectively.
Fig. 10 and 11 show the measured results of running distance and time when regenerative brake and disk brake are operated. The design values for braking distance and time are 3,049m and 70.02s respectively.
The measured values for braking distance and time are 2,919m and 64.07s, respectively. The difference can be explained by the reasons mentioned above.
Fig. 8 Running distance in case of rheostatic brake
Fig. 9 Running time in case of rheostatic brake
Fig. 10 Running distance in case of regenerative brake.
Fig. 11 Running time in case of regenerative brake.
ICCAS2005 June 2-5, KINTEX, Gyeonggi-Do, Korea
6. CONCULSION
The most important thing to secure safety and reliability of railway vehicles is to verify performance characteristics of equipments. Therefore related companies and research institutes had made many efforts to verify performances and functions of equipments synthetically and efficiently.
In this study, the measurement system for running and braking was developed and installed on the vehicle. The programs for measuring and analysis were also developed to understand the traction characteristics of KTX.
The performance of propulsion system is analyzed as changing the number of motor blocks. And the traction characteristics are compared as changing of running distance and time. From now on, we think it is necessary to get the data on the same condition, the gradient and curve of the line.
ACKNOWLEDGMENTS
We gratefully acknowledge that this High-Speed Railway System Development Project has been supported by Korean Ministry of Construction and Transportation.
REFERENCES
[1] Y.J. Han, K.H. Kim, S.I. Seo, C.K. Park, S.H. Han, J.Y. Kim, A.S. Kno, “A study on the measurement system for motor block of railway vehicle”, ICCAS, pp. 1720~1723, 2003.
[2] Y.J. Han, S.W. Kim, S.I. Seo, Y.G. Kim, C.S. Park, S.G. Lee, J.Y. Kim, “A study on the temperature characteristics of electric devices for high-speed railway vehicles”, KIEEME conference, pp. 1210~1216, 2003. [3] S. W. Kim, Y. G. Kim, G. S. Baek, J. H. Kim, Y. J. Han,
“Development of Measurement System for On-Line Test and Evaluation on High-Speed Train (1) - Hardware”, Fall Conference Papers of Korean Society for Railway, pp. 168-173, 2002
[4] Y.J. Han, K.H. Kim, C.S. Park, J.H. Kim, H. Kim, “A study on characteristic of electric apparatus for high-speed train”, KIEE conference, pp. 435~437, 2003. [5] “Development of Main Power Converter”, Annual
Report of High-Speed Train Development Project, MOCT, MOST, MOCIE, 2000.
[6] “Development of Traction Motor”, Annual Report of High-Speed Train Development Project, MOCT, MOCIE, MOST, 2000.
[7] Paolo Masini, Giovanni Puliatti, “Virtual acquisition systems for global analysis (VASGA) in experimentation”, WCRR, pp. 279~286, 1997.