Job Creation and
Environment policy
Leading Researcher:
Uk Hwang (Korea Environment Institute)
Participating Researcher:
Seok‐Joon Hwang (Keimyung University) Jangyul Cho (Korea Environment Institute)
Project Advisory Committee:
Taek‐Whan Han (Seokyeong University) Dong‐Ki Min (Konkuk University) Young‐Keun Chung (Sunmoon University) Chang‐Hoon Lee (Korea Environment Institute)
Copyright ⓒ 2006 by Korea Environment Institute
Price ₩ 6,000
All rights reserved. No part of this publication may be reproduced or transmitted in any form or any means without permission in writing from the publisher
Publisher Suh Sung Yoon
Published by Korea Environment Institute
613‐2 Bulgwang‐Dong, Eunpyeong‐Gu, Seoul, 122‐706, Republic of Korea Tel.(822) 380‐7777 Fax.(822) 380‐7799 http://www.kei.re.kr, http://eng.kei.re.kr Published and printed in Dec. 2006
In Korean labor market, it is highly important to estimate the effect of environmental policies on employment levels from both a real and potential viewpoint. It is also meaningful to analyze how to integrate economic and environmental policies together based on estimation. These works were carried out in this research.
In this study, the researchers have focused on the calculation of employment changes according to the three environmental policies using econometrics and survey investigation. As the overall literature suggests, we can support that environment‐related activities can be a significant source of employment.
However, there are lots of difficulties to assess the effect of environmental policy on employment. The most difficult problem is the lack of data. Data can be accumulated with time and this problem will be solved.
I hope that this study will facilitate related researches. I would like to thank the research staffs, Uk Hwang, Seok‐Joon Hwang, and Jangyul Cho for their contribution. In addition, I wish to express my sincere gratitude to the reviewers for their helpful comments and suggestions on this study.
Suh Sung Yoon President Korea Environment Institute
Chapter 1. Introduction
1. Introduction
Because the Korean economy is in recession, the Korean government is in a dilemma between improving the environmental quality and developing the economy. But, in 2004, Hwang and Kang investigated the relationship between labor demand and environmental policy and showed that there is at least no trade‐off between economic development and environmental protection. Two years later, we had the opportunity to collect more data, and we study the relationship between environmental policy and job creation in more depth.
In this study, we classify environmental policies into three big categories: first, a policy that can affect the environmental industry; second, public expenditure for natural environmental protection and third, the effect of renewable energy industry on job creation. And we try to analyse the effect of these policies on job creation.
2. Literature Review
Even though a regulation raises the production cost, it provides strong incentives for environmental protection, and sometimes it enhances labor demand in that sector. Two OECD reports suggest that the effect of policies on employment will be small but having potential for greater effects. Some papers also support that at least environmental policies do not have serious negative effects on the labor market.
1. Environment‐related Jobs in the Overall Industry
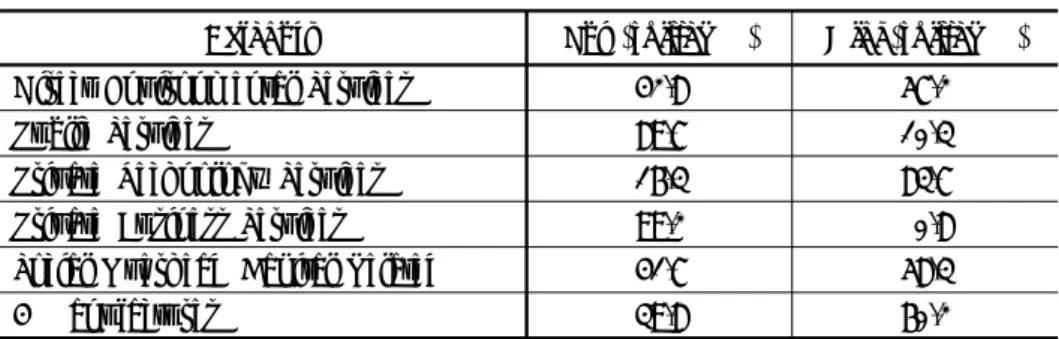
The Korea Employment Information Service(KEIS) has annually published the Occupational Employment Statistics(OES) since 2001. The occupations which are related to the environment in the OES are categorized as environmental engineers, environment/health hygiene workers, operator of environmental facilities, managers, and cleaners. 2.4 percent of total workers in OES had environment‐related jobs in 2003. Among them, high‐skilled workers are about 10 percent and the remaining 90 percent are low‐skilled labor. This indicates that the majority of workers in the environment‐related labor market are low‐skilled labor. Using this categorization, the distribution of low‐skilled and high‐skilled workers in each sector is shown below Table 1.
Table 1. Distribution of Worker Skill by Category (2003)
Category Low‐skilled(%) High‐skilled(%)
Direct Environmental Services 42.8 57.2
Public Services 89.7 10.3
Private Technology Services 16.3 83.7
Private Business Services 99.2 0.8
Social Overhead Capital Related 41.7 58.3
4 Manufactures 39.8 60.2
Sources : Korea Employment Information Services. 2004. Occupational Employment Statistics. Note : Low‐skilled is the share of low‐skilled workers among total environment‐ related workers in the category. High‐skilled is the share of high‐skilled workers among total environment‐related workers in the category.
This suggests that if the government focuses on the improvement in environment‐related labor structure, then it had better spend its money on environmental technology development or industrial restructuring for an environment‐friendly industry structure.
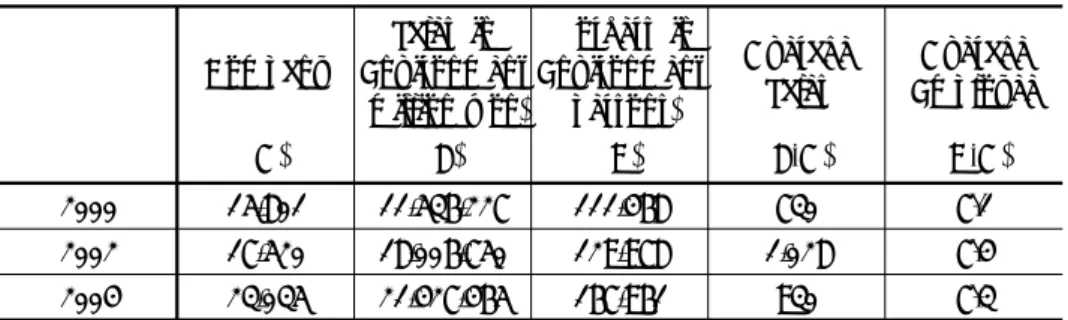
The statistics about environmental industry is collected by the Ministry of Environment in Korea. In 2004, 15 percent of the environmental industry is engaged in the manufacturing sector, 5 percent in construction, and the remaining 80 percent of the companies are in the service sector. Total sales of the environmental industry in 2004 was 21,428 billion won. Forty percent of total sales came from the manufacturing sector, 17 percent from construction, and 43 percent from the service sector. The distribution of workers is provided in Table 2;
Table 2. Worker Distribution in the Environmental Industry
Manufacture Construction Service Total Total Employee (A) 97,380 135,384 139,378 372,142
Employee in
Environmental Sector (B) 57,103 22,544 88,314 167,931
B/A 58.6 16.7 63.4 45.1
Sources : Ministry of Environment. 2006. Report on Environmental Industry Statistics. Korea.
Chapter 3. Job Creation by the Environmental Industry and
Public Investment
1. Some Background of the Estimated Model
Ordinary labor demand function (here, labor demand means the labor demand in the environmental sector of each environmental industry) is derived from the profit maximization condition of firms. We adopt the panel data technique. Generally, we follow the widely accepted estimation methods; panel generalized least square, panel generalized least square with heteroskedasticity, panel generalized least square with autocorrelation, random effect model, and random effect model with autocorrelation.
On the average, each industry is estimated at the elasticity of sales on labor demand as from 0.193 to 0.259. So, when we define 0.193 as minimum elasticity estimator and 0.259 as maximum value for that, it means that at one percent change of sales on the average level, it gives 0.193 percent to 0.259 percent increase of labor demand in each environmental industry. The following Table 3 shows the labor demand increase in the environmental industry with regard to the sales increase in the environmental sector.
Table 3. Total Labor Demand Increase in the Environmental Industry
according to One Billion Won Sales Increase in the Environmental Sector (Unit : persons) = 0.193
ε ε = 0.259
Environment Non‐
Environment Total Environment
Non‐
Environment Total
3.5 4.2 7.7 4.9 5.6 10.3
Note : represents the labor demand elasticity of environmental sector sales on labor demand
When we compare the result with the direct induced employment coefficient of the overall manufacturing industry presented in the with Input/ Output tables, we can find that the job creation ability of the environmental industry is not that small.
3. Job Creation by the Public Environmental Expenditure and the Renewable Energy
3.1. Job Creation by Public Expenditure in Natural Resource Preservation Area
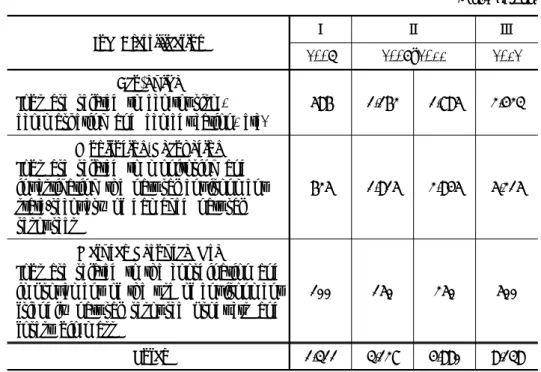
We investigate the job creation in the natural resource sector first. Kim(2006) suggests the detailed job availability in the natural resource sector as follows;
Job Classification
Ⅰ Ⅱ Ⅲ
2007 2008~2011 2012
Eco‐guide Jobs are related to eco‐tourism, eco‐marketing and eco‐education, etc.
586 1,162 1,785 2,423
Monitoring/Recovering Jobs are related to monitoring and investigating the natural environment state/recovery of damaged natural resources
625 1,815 2,845 5,215
Natural Resource Use
Jobs are related to the coordination and improvement of the use of environment friendly natural resource products and forest bio‐mass
100 150 250 500
Total 1,311 3,127 4,880 8,138
Source : Reorganize the table from Kim. 2006. Report of Social Job Creation in Environmental
Sector. PCSD. pp. 90‐91.
Based on this scenario we can guess the size of expenditure for the job creation in Table 5 by simple multiplication.
Table 5. Expected Annual Government Expenditure for Job Creation in the Natural Resource Sector
(Unit: million won)
Ⅰ Ⅱ Ⅲ
2007 2008~2011 2012
Total Expenditure 11,012 26,267 40,992 68,359 Note : Total Expenditure = expected job creation in Table 12 × 700,000 × 12
sector, the effect of job creation in the natural resource sector is very large in view of job creation size.
3.2. Job Creation by Public Expenditure in the Renewable Energy Industry
In 2004, Soo‐Jin Kim studied the employment effect of solar and wind energy industry in Korea with 1998 Input/Output table. Based on her scenario and calculation we can get the following Table 6.
Table 6. Job Creation in Wind and Solar Power Plant (2015)
(Unit: million won, person) Installation Power Generation Total
Wind Cost 923,697 455 924,152
Job 15,084 2,303 17,387
Solar Cost 1,807,500 244 1,807,744
Job 17,509 1,036 18,454
Chapter 4. Policy Implications
Environmental policy will be heading toward an integrated approach to pollution management instead of managing each pollutant separately. This change requires the development of environmental technology to control the pollution. Given this point of view, it is desirable for government policies to focus on job creation in the environmental sector. Furthermore, the government needs to upgrade the labor quality in the environment‐related sectors, and it is timely for the government to consider the ways to enhance the high‐skilled labor force.
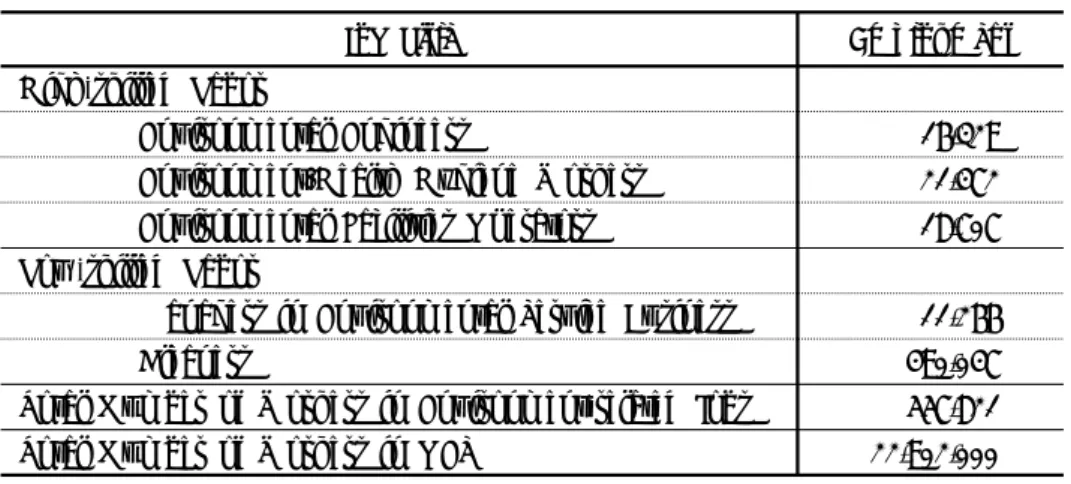
The following Table 7 shows the job creation possibility by spending 1 billion won for the environmental industry, public expenditure for natural
Table 7. Job Creation per One Billion Won Spending
(Unit: person) Calculation Method and Assumption Job Creation Environmental
Industry We assume that ε = 0.256. 10.3
Public Expenditure
Total Job Creation/Total Expenditure (in 2012 and in the case of natural resource protection)
119.0
Renewable Energy
Total Job Creation/Total Cost for Installation and Power Generation(in 2015)
wind 18.8 solar 102.0 Note : In the case of the job creation number in the environmental industry and renewable
energy, the table only contains direct effect on job creation.
This suggests that, in the short run, the best policy to create jobs is related to the policy that enhances private business services and public services industry. But when we consider that a large portion of created jobs from expenditure in the natural resource sector is low‐skilled workers. In the long run and in view of the size of the market for the industry, the desirable policy is to promote the environmental industry.
For example, if the government wants to create jobs by developing the environmental industry, it is appropriate for the policy to focus on the construction and other machinery industry sector. However, if the government wants to directly increase environment‐related jobs, then it is effective for the policy to support other sectors.
In the case of the renewable energy sector, it has a reasonable job creation ability if the conditions for development of renewable energy are satisfied. But, the development of renewable energy is very restricted in Korea.
The last thing that we consider is the change of location of manufacturers or production site of industries according to the stringency of an
site change.
Chapter 5. Conclusion
When we consider that the policy direction has changed to an integrated approach from treating each pollutant separately, so it is time to consider that labor policy in the environmental sector pursues the way to enhance labor quality in the environmental service section.
One of best ways to achieve job creation is to support the environmental industry. The environmental industry has a high potential to be a major industry in the future. Because the environmental industry itself is relatively technology or research oriented, it is quite an appropriate place to improve the labor quality.
Job creation through public expenditure spending looks more effective than that in the environmental industry support. But when we consider labor quality and job duration, it is useful for the government to solve only the temporary unemployment problem.
When we look at the renewable energy industry, it is also effective to invest in this sector in the view of job creation and labor quality improvement. But when we consider the climate condition and demand for energy in Korea, the job creation effect in this sector is limited.
So the government chooses the policy effectively according to the situation which the government is confronted with. Sometimes, some can argue that if money is spent on other sections that can create more jobs, then it is not an efficient way to invest or spend money for the development of the environmental sector in the view of job creation. But when we consider the characteristics of environment, unpredictable, asymmetry of recover and destruction, the value of environmental protection can be larger than some job creation.
FOREWORD ABSTRACT
Chapter 1. Introduction ∙∙∙∙∙∙∙∙∙∙∙∙∙∙∙∙∙∙∙∙∙∙∙∙∙∙∙∙∙∙∙∙∙∙∙∙∙∙∙∙∙∙∙∙∙∙∙∙∙∙∙∙∙∙∙∙∙∙∙∙∙∙∙∙∙∙∙∙∙∙∙∙∙∙∙∙∙∙∙∙∙∙∙∙ 1
1. Introduction ∙∙∙∙∙∙∙∙∙∙∙∙∙∙∙∙∙∙∙∙∙∙∙∙∙∙∙∙∙∙∙∙∙∙∙∙∙∙∙∙∙∙∙∙∙∙∙∙∙∙∙∙∙∙∙∙∙∙∙∙∙∙∙∙∙∙∙∙∙∙∙∙∙∙∙∙∙∙∙∙∙∙∙∙∙∙∙∙∙∙∙∙∙∙∙ 1 2. Literature Review ∙∙∙∙∙∙∙∙∙∙∙∙∙∙∙∙∙∙∙∙∙∙∙∙∙∙∙∙∙∙∙∙∙∙∙∙∙∙∙∙∙∙∙∙∙∙∙∙∙∙∙∙∙∙∙∙∙∙∙∙∙∙∙∙∙∙∙∙∙∙∙∙∙∙∙∙∙∙∙∙∙∙∙∙ 4
Chapter 2. Jobs in the Environmental Sector in Korea ∙∙∙∙∙∙∙∙∙∙∙∙∙∙∙∙∙∙∙∙∙∙∙∙ 11
1. Environment‐related Jobs in the Overall Industry ∙∙∙∙∙∙∙∙∙∙∙∙∙∙∙∙∙∙∙∙∙∙∙ 11 2. Jobs in the Environmental Industry ∙∙∙∙∙∙∙∙∙∙∙∙∙∙∙∙∙∙∙∙∙∙∙∙∙∙∙∙∙∙∙∙∙∙∙∙∙∙∙∙∙∙∙∙∙∙∙∙∙ 15
Chapter 3. Job Creation by the Environmental Industry and Public Investment ∙∙∙∙∙∙∙∙∙∙∙∙∙∙∙∙∙∙∙∙∙∙∙∙∙∙∙∙∙∙∙∙∙∙∙∙∙∙∙∙∙∙∙∙∙∙∙∙∙∙∙∙∙∙∙∙∙∙∙∙∙∙∙∙∙∙∙∙∙∙∙∙∙∙∙∙∙∙∙∙∙∙∙∙∙∙∙∙∙∙∙∙∙∙∙∙∙∙∙∙∙∙∙∙∙ 21
1. Some Background of the Estimated Model ∙∙∙∙∙∙∙∙∙∙∙∙∙∙∙∙∙∙∙∙∙∙∙∙∙∙∙∙∙∙∙∙∙∙∙ 21 2. Job Creation in the Environmental Industry ∙∙∙∙∙∙∙∙∙∙∙∙∙∙∙∙∙∙∙∙∙∙∙∙∙∙∙∙∙∙∙∙∙ 24 3. Job Creation by the Public Environmental
Expenditure and the Renewable Energy ∙∙∙∙∙∙∙∙∙∙∙∙∙∙∙∙∙∙∙∙∙∙∙∙∙∙∙∙∙∙∙∙∙ 34 3.1. Job Creation by Public Expenditure
in Natural Resource Preservation Area ∙∙∙∙∙∙∙∙∙∙∙∙∙∙∙∙∙∙∙∙∙∙∙∙∙∙∙∙ 34 3.2. Job Creation by Public Expenditure in the
Renewable Energy Industry ∙∙∙∙∙∙∙∙∙∙∙∙∙∙∙∙∙∙∙∙∙∙∙∙∙∙∙∙∙∙∙∙∙∙∙∙∙∙∙∙∙∙∙∙∙∙∙∙∙∙∙∙∙∙∙∙∙ 37
Chapter 4. Policy Implications ∙∙∙∙∙∙∙∙∙∙∙∙∙∙∙∙∙∙∙∙∙∙∙∙∙∙∙∙∙∙∙∙∙∙∙∙∙∙∙∙∙∙∙∙∙∙∙∙∙∙∙∙∙∙∙∙∙∙∙∙∙∙∙∙∙∙∙∙∙ 43 Chapter 5. Conclusion ∙∙∙∙∙∙∙∙∙∙∙∙∙∙∙∙∙∙∙∙∙∙∙∙∙∙∙∙∙∙∙∙∙∙∙∙∙∙∙∙∙∙∙∙∙∙∙∙∙∙∙∙∙∙∙∙∙∙∙∙∙∙∙∙∙∙∙∙∙∙∙∙∙∙∙∙∙∙∙∙∙∙∙∙ 47 Reference ∙∙∙∙∙∙∙∙∙∙∙∙∙∙∙∙∙∙∙∙∙∙∙∙∙∙∙∙∙∙∙∙∙∙∙∙∙∙∙∙∙∙∙∙∙∙∙∙∙∙∙∙∙∙∙∙∙∙∙∙∙∙∙∙∙∙∙∙∙∙∙∙∙∙∙∙∙∙∙∙∙∙∙∙∙∙∙∙∙∙∙∙∙∙∙∙∙∙∙∙∙∙∙∙∙∙∙∙ 49
Table 1. Distribution of Environment‐related Workers (2004) ∙∙∙∙∙∙∙∙∙ 12 Table 2. The Share of Environment‐related Workers by Industry
(2003) ∙∙∙∙∙∙∙∙∙∙∙∙∙∙∙∙∙∙∙∙∙∙∙∙∙∙∙∙∙∙∙∙∙∙∙∙∙∙∙∙∙∙∙∙∙∙∙∙∙∙∙∙∙∙∙∙∙∙∙∙∙∙∙∙∙∙∙∙∙∙∙∙∙∙∙∙∙∙∙∙∙∙∙∙∙∙∙∙∙∙∙∙∙∙ 13
Table 3. Distribution of Worker Skill by Category (2003) ∙∙∙∙∙∙∙∙∙∙∙∙∙∙∙ 15 Table 4. Worker Distribution in the Environmental Industry ∙∙∙∙∙∙∙∙∙ 16 Table 5. Average Sales and Employee in the Environmental Sector
∙∙∙∙∙∙∙∙∙∙∙∙∙∙∙∙∙∙∙∙∙∙∙∙∙∙∙∙∙∙∙∙∙∙∙∙∙∙∙∙∙∙∙∙∙∙∙∙∙∙∙∙∙∙∙∙∙∙∙∙∙∙∙∙∙∙∙∙∙∙∙∙∙∙∙∙∙∙∙∙∙∙∙∙∙∙∙∙∙∙∙∙∙∙∙∙∙∙∙∙∙∙∙∙∙ 17
Table 6. Average Sales in the Environmental Sector per Company
and Workers in the Environmental Sector per Company by Industry ∙∙∙∙∙∙∙∙∙∙∙∙∙∙∙∙∙∙∙∙∙∙∙∙∙∙∙∙∙∙∙∙∙∙∙∙∙∙∙∙∙∙∙∙∙∙∙∙∙∙∙∙∙∙∙∙∙∙∙∙∙∙∙∙∙∙∙∙∙∙∙∙∙∙∙∙∙∙∙∙∙∙∙ 18
Table 7. Estimation Results of Environment‐related Labor Demand
in Environmental Industry with Panel Generalized Least Square Method ∙∙∙∙∙∙∙∙∙∙∙∙∙∙∙∙∙∙∙∙∙∙∙∙∙∙∙∙∙∙∙∙∙∙∙∙∙∙∙∙∙∙∙∙∙∙∙∙∙∙∙∙∙∙∙∙∙∙∙∙∙∙∙∙∙∙∙∙∙∙∙∙∙∙∙∙ 25
Table 8. Estimation Results of Environment‐elated Labor Demand
in Environmental Industry with Random Effect Model ∙ ∙ 27
Table 9. Labor Demand Increase according to Sales Increase in the
Environmental Sector ∙∙∙∙∙∙∙∙∙∙∙∙∙∙∙∙∙∙∙∙∙∙∙∙∙∙∙∙∙∙∙∙∙∙∙∙∙∙∙∙∙∙∙∙∙∙∙∙∙∙∙∙∙∙∙∙∙∙∙∙∙∙∙∙∙ 29
Table 10. Induced Employment Coefficients in Some Industries ∙∙∙∙∙ 31 Table 11. Total Labor Demand Increase in the Environmental
Industry according to One Billion Won Sales Increase in the Environmental Sector ∙∙∙∙∙∙∙∙∙∙∙∙∙∙∙∙∙∙∙∙∙∙∙∙∙∙∙∙∙∙∙∙∙∙∙∙∙∙∙∙∙∙∙∙∙∙∙∙∙∙∙∙∙∙∙∙∙∙ 32
Table 12. Job Creation in the Natural Resource Sector ∙∙∙∙∙∙∙∙∙∙∙∙∙∙∙∙∙∙∙∙∙∙ 35 Table 13. Government Expenditure for Jobs in the Natural
Table 15. The Aim of Power Generation Supply ∙∙∙∙∙∙∙∙∙∙∙∙∙∙∙∙∙∙∙∙∙∙∙∙∙∙∙∙∙∙∙∙∙ 38 Table 16. Job Creation in Wind and Solar Power Plant (2015) ∙∙∙∙∙∙∙ 41 Table 17. Job Creation per One Billion Won Spending ∙∙∙∙∙∙∙∙∙∙∙∙∙∙∙∙∙∙∙∙∙ 44 Table A. Estimated Variance of Panel Generalized Least Square
Chapter 1. Introduction
1. Introduction
Recently in Korea, the 2005 Environmental Sustainability Indicator was announced. And Korea was ranked 122nd among 146 countries. Furthermore ecological damage in this country is 3.8ha, next to the U.S., which is 4.9ha. Ecosystem wellbeing index is also ranked low as 161st among 180 countries1). Since these results indicate the environmental quality getting worse, people have started to be keenly aware of the importance of the environment.
People might think that the economic improvements can compensate them for this loss of environmental quality. The current state of the Korean economy, however, does not show any sign of business booming up. Especially, the unemployment problem has not been solved yet. In the case of unemployment of workers who are from 15 years old to 24 years old, the unemployment rate was around 9 percent in the 2000s, which is higher than the total unemployment rate of 3 percent in Korea.
Because of this situation, it looks like the Korean government is in a dilemma between improving the quality of the environment and economic development. However, before we think this as a dilemmatic situation, first we must check whether there is a trade‐off between improving the environment and the economy. As we can sometimes improve both the economy (or industry competition) and the environment, we need to find out ways to improve both successfully.
In 2002, Hwang and Kang investigated the relationship between labor demand and environmental policy. They estimated that the labor demand function from 1992 to 2002 with environmental policy changes as they relate to the number of monitoring ambient environmental quality and the change of budget for environmental protection. In their study, they found a positive relationship between the overall labor demand and the increase in pollution 1) This information is based on Jeong(2006b).
abatement cost of manufacturers. They thus concluded that environmental protection activities in Korean manufacturing industry from 1992 to 2002 created jobs. This job creation was not any big burden to business activities during this period, because the share of pollution abatement cost among total production costs is just around 1 percent. However, the research could not provide more information in detail. It means that because of data restriction, they just focused only on overall labor demand of the manufacturing industry.
After two years, we fortunately have had the opportunity to collect more data. The new data sets are environmental industry statistics and occupational employment statistics. These data contain more specific information about the status of the environmental industry and the description of current environment‐related jobs. These added information motivates the study of job creation and environmental policy again. Therefore, we restudy the relationship between economic improvement and environmental protection in more detail in this new project.
In this study, we still cannot define clearly what the environmental policy is. In reality, there are lots of environmental policies and it is impossible for us to investigate the effect of each environmental policy one by one. If people want to know the specific effect of each environmental policy on employment, then it would rather be researched as one independent project per case. Therefore, in this research, we still take an overall point of view about the effect of environmental policy on employment but the focus is more narrowed compared to the previous research in 2004.
We classify the environmental policy into three big categories. First, it is the policy which can affect the environmental industry, second, public expenditure for natural environmental protection and last, the effect of renewable energy industry on job creation. These three categories represent each different section of the economy. That is, as a private sector, we focus on the environmental industry. When we look at the budget of the Ministry of Environment, we can observe the R&D investments and the subsidies for environmental industry2). This government spending increase can spur 2) The contents of investments are natural gas auto supply, next generation environmental
directly the environmental industry to grow. And it will create jobs in that sector.
Second, we want to suggest some ways for environmental protection and the promotion of employment. While the more stringent regulation cannot only protect the environment but also create jobs, it can also dampen business incentives in the private sector. To overcome shrinking incentives of the business sector, it is reasonable for the government to increase public expenditure more instead of strengthening the regulation. So we change our focus from the private industry to the effect of public expenditure on job creation, especially, public expenditure for natural resource protection.
Last, we focus on the renewable energy sector. Even though in Korea, energy policy is not a main area of the Ministry of Environment, when we consider that energy is the main source of pollution, it is worth to look at the relationship between energy supply system change and employment. Furthermore, in some countries like Germany, the increase of renewable energy supply shows the employment growing at the same time as environmental protection. Therefore, in this study, we introduce a study of job creation in the renewable energy industry in Korea and look at the job creation ability in this sector.
Even though this study is a consecutive study of the former report of 2002, still, we have many limitations. As we mentioned earlier, still we cannot define clearly environmental policies. And the number of data set itself is so small and inconsistent with previously widely used economic data in some points. For example, we cannot but use some proxies to estimate wages and production in the environmental industry sectors. Because the data collection in the environment is in early stages, it is difficult to overcome these problems in this research. And we cannot consider the whole effect of policies on employment, especially indirect job creation in other sectors and the job loss from environmental policy. But those problems are expected to be solved when more data are collected and the model for this analysis is developed.
technology development and environmental quality improvement funds, etc. From 2004 to 2005, these investments are growing by 11.7%(Ministry of Environment. 2006. 2005
Even though we have some limitations in this report, we did our best to investigate the relationship between environmental policy and job creation, and suggest some desirable government policies which can improve environmental quality and decrease the unemployment level in Korea.
2. Literature Review
Even though a regulation raises the production cost, it provides strong incentives for environmental protection, and sometimes it enhances industrial competitiveness under some conditions. Porter et al.(1995) suggests the positive role of regulation for industrial competitiveness. He argues that since the entrepreneurs do not have an interest with environmental quality control in their production process, there is too much ignorance in searching for innovation and this leads them to have incomplete information for innovation. But some regulations under some conditions can make them find innovations. As a result, sometimes the harmony between environmental quality improvement and industrial competitiveness can be found. The conditions under which economic regulation makes industrial competitiveness stringent are a clear policy target suggestion, a flexible policy including voluntary participation, and the usage of economic instruments.
While those policies are desirable to protect environmental quality and improve an economy, some economists have suspicions about Porterʹs argument. The baseline of their critics is the ignorance of opportunity cost which is generated by changing old production line with new one. That is, except the direct cost of changing the production line, we must consider the foregone future cash flow from the old production line. They argue that if we do not add the direct cost to this opportunity cost, then the benefits of regulation and innovation may be overestimated. But they agree with the idea that the difficulties in evaluating environmental benefits also make the benefits of regulation underestimated.
These two arguments provide reasonable explanations for the effect of environmental policy in a broad sense. But they agree with the difficulties
in estimating the benefits of environmental quality improvement in common. This means that since the calculation of cost is an easier approach to evaluate environmental policies, it is highly probable that many researches focus on only cost side and underestimate the benefits of environmental policy. Somehow this restraint can provide, at best, the potentialities of benefits of environmental policy. In the case of Korean literature, they provide also only the potential relationship between environmental improvement and industrial competitiveness.
Let us focus on the relationship between job creation and environmental policy. OECD published its first report about environmental policies and employment in 1997. The report suggests the effects of environmental policies on job creation in two ways with various dimensions (short and long term, direct and indirect, micro and macro etc.). One way, as positive views, it focuses on the increases of labor demand due to the expansion of environment‐related activities and investment. The other way, it focuses on the lost of effective investments and competitiveness which can bring onto job creation.
With these points, the report investigates empirical data. First, it measures the share of environment‐related labor force on the total labor force of each OECD member country. The overall share of this is around 1 to 3 percent. The report indicates that the major sources of negative effect on employment are the loss of competitiveness, plant closure, and industrial relocations. After research about these effects, it concludes that there is no massive and systematic job loss because of environmental policies. Macro researches also support this view. Since environmental goods have its own market which is not small, it seems that this macro argument works.
Based on these results, the report suggests that policy directions for both job creation and environmental protection as follows; first, the increase of governmentsʹ expenditure to labor‐intensive environmental protection activities as anti‐recession policy, second, environment friendly restructuring of industry which aims for clean technology development, renewable energy usage and intensive waste recycling etc., third, environment‐related employment policy such as specific job related education and training
programmes in the environment‐related section. Fourth, though it is controversial, green tax reform.
In 2004, the OECD presented another report about environment and employment. In this report, OECD strengthened empirical part. It suggested that the statistical criteria for environment‐related labor statistics are needed and more new, updated statistics of OECD countries are required. The shares of the environmental sector labor to total labor of each OECD country are around 1 to 3 percent between 1997 and 2000. It also tries to assess the effect of local/regional policy and initiatives on employment. Unfortunately, it concluded that, because of lack of available data, it cannot confirm the positive effect but still there is potentiality. They also used various economic models to check the double‐dividend hypothesis and technological change due to subsidy. In this part, it concluded that, in the short run, the subsidies work for employment increase but the effect was not sustained in the long run. So it predicts that the effect of policies on employment will be small except environment friendly energy related policy.
Besides these reports, some academic papers show that, at least, there is no serious negative effects on the labor market. Golombek and Raknerud (1997) suggest that the industry sector which is under rigid environmental regulation would increase the employment level as was shown in the Norwegian industry. They use a multi‐state Markov model to explain the relationship between the entry and exit of firm and employment. Morgenstern, Pizer and Shih(1998) had similar results with the USA data, but the methodology was different. They used decomposition of labor translog cost function approaches for pulp and paper, plastics, petroleum, and steel industry. They concluded that there exists a net gain of small employment increase which is insignificant. When they focus on plastic and petroleum sectors they found strong significant positive effects between job creation and environmental expenditure increase.
In Korea, Hwang and Kang(2004) estimated labor demand function with environmental policy change from 1992 to 2002 in the manufacturing industry sectors. They used fixed effect instrument variable method. They found the positive relationship between labor demand and environmental expenditure
too. Even though those results could not support the strong positive effects between environmental protection and employment, these results, at least, imply the potentiality of a positive relationship between employment and environmental protection.
Except for a direct positive relationship between environmental expenditure increase and job creation, there exists the opposite effect which may lead to job losses with location change. That is called pollution haven activities. According to Brunnermeier and Levinson(2004), at the early stage of the literature, the empirical results of pollution haven effects do not support the existence of those effects; that is, the strength of environmental regulation does not make the manufacturer change its industry location to a region with less stringent environmental regulation. However, nowadays, the development of estimation technique, which includes the heterogneity treatment and endogeneity problems in panel data, can support the prediction of pollution haven effects. This estimation equation is a closed form of single equation which is based on the Heckscher‐Ohlin model.
Therefore, still, it is difficult to find out strong support for the existence of pollution haven effects. In Korea, Lho(2002) estimated the relationship between industrial relocation and environmental policy through foreign direct investment and policy instruments. He concludes that foreign direct investment of heavy pollution industry in Korea statistically does not have any relationship with the stringency of environmental policy. Hwang(2006) suggested the theoretical conditions for observing the industrial relocation which pollution haven effects and hypothesis predicts. He uses the model which shows the home‐market effects in trade with environmental policy and pollution treatment costs. He suggests some conditions under which we can observe industrial relocation. Industrial relocation happened when a small country with strong environmental policy trades with a large country with weak environmental policy. Furthermore, the industrial relocation depends on each industryʹs cost condition between traditional production cost and pollution treatment cost. Therefore, he concluded that it is not easy to identify the pollution haven effects from the home market effects as industrial relocation. That is, since it is highly probable that industries relocate their
production center because of traditional cost savings, it is hard for us to accept environmental policy stringency itself as a main and important relocation factor. When we synthesize the whole results, at least, it cannot be supported that environmental policy stringency can have a big effect of job loss. Ultimately, this means that the policy which protects environmental quality must not be treated unduly as a main cause of economic impediment. When we consider the difficulties in calculating the benefits of environmental protection, even if we admit there exists a negative effect of environmental stringent policy on employment, we do not have to exemplify the job losses which can be covered with alternative investment opportunities.
Letʹs simply look at some literature about environmental policy. The aim of environmental policy is simply defined as a maximization of social welfare given an appropriate environment level. An appropriate environment level means the polluted level at which marginal cost of pollution is the same as marginal benefits of environmental quality improvement. To achieve this goal, on the one hand, the government regulates directly the production and consumption behavior of economic agents, and on the other hand it spends government expenditure on several environmental activities, including investments which are related to the development of best available technology for environmental protection.
Direct regulation or command and control is regarded as an inefficient instrument. For example, pollution emit permission, one of the typical examples of direct regulation, is known as a rigid policy to manage. The pollution emit permission is as follows; the government gives a pollution permission to economic agents after the government scans the pollution level the results of behaviors produce. But to manage this policy, the government must have entire information about technology and the effects of the behaviors on the environment. So in view of the managing cost of this policy and incentives for technology improvement, it is criticized as an inefficient policy.
Currently, many governments changed their policy target to incentives of voluntary environmental protection from direct regulation. This trend makes the governments use economic instruments like taxes, subsidy etc. However,
the usage of those instruments also requires more information about technology, eco‐management skills and life‐cycle analysis of the product. Furthermore, integrated pollution control can be possible with this information. What this means is that even though the way of environmental policy or regulation turns to encouragement‐oriented from punishment‐ oriented, those policies must be accompanied with technological and scientific knowledge about the environment and behaviors of economic agents. This policy change makes the government more focused on the creation of an atmosphere for environmental technology development and even on leading environment friendly technology advances and development. Recently, Jeong(2006b) indicated the future direction of the Korean environmental policy must pursue the introduction of an integrated pollution control from the point of view of industrial ecology the access control to environment information as a way of regulation and clean technology development being accompanied with environment‐ oriented product innovation.
There is another role of environmental policy except environmental protection. That is, the environmental policy can be used as anti‐recession instruments as the OECD(1997) suggested. When the economy is in recession, the government can spend its expenditure on environmental protection for booming up the economy in the short run. This fiscal policy is the typical way of the government to release the economy from recession, which Keynes suggested. The only difference from the traditional fiscal policy and this, is that the government spends money for environmental protection. By using government expenditure this way, the government can improve the economy and protect the environment at the same time.
Chapter 2. Jobs in the Environmental Sector in Korea
1. Environment‐related Jobs in the Overall Industry
The Korea Employment Information Service(KEIS) has annually published the Occupational Employment Statistics(OES) since 2001. This OES statistics provides information on occupational employment data classified into 194 industrial sector with 392 occupational categories. In 2004, the KEIS gathered surveys of 70,016 people. First, we analyse the distribution of workers who have environment related jobs with these statistics.
The occupations which are related to the environment in the OES are categorized as environmental engineers, environment/health hygiene workers, operator of environmental facilities, managers, and cleaners. Among them, the first three occupations can be high‐skilled labor jobs and the last two occupations are low‐ skill labor. When we sort the environment‐related occupation in the OES, we regard only the occupations which indicate the explicit relationship with the environment as environment‐related job. This is a strict criterion. Because we can not clearly discern the jobsʹ characteristics from the data description in the OES, the only way to identify whether the job is related to the environment or not is to pick the occupation whose title shows the explicit relationship with the environment.
environmental engineers are the engineers whose job is related to sewage system, waste or waste water treatment, clean technology development, noise protection technology, pollution air prevention technology, and so on. The environment/health hygiene workers engage in inspections of water, air, noise, waste treatment and other environment‐related matters. The operators of environmental facilities are the people whose job is related to sewage or water supply facility operation and incinerator facility operation. The managers and cleaners are the people who engage in environmental service businesses.
which is provided in these statistics. With these weights, we can estimate the whole labor market size and the whole environment labor size together. The table 1 shows the overall description of the environment‐related employment distribution. When we use the weight, the total estimated number of workers in 2004 is 22,902,000.
Table 1. Distribution of Environment-related Workers (2004)
Job Title Employment
High‐skilled Labor
Environmental Engineers 16,329
Environment/Health Hygiene Workers 21,472 Environmental Facilities Operators 18,707 Low‐skilled Labor
Managers in Environmental Service Business 11,266
Cleaners 490,047
Total Number of Workers in Environment‐related Jobs 557,821
Total Number of Workers in OES 22,902,000
Sources : Korea Employment Information Services. 2005. Occupational Employment Statistics. Note : High‐skill and low‐skill are classified by the technology related certification holding
requirement
In total, 2.4 percent of workers in OES had environment‐related jobs in 2003. Among them, high‐skilled workers are about 10 percent of those jobs and the remaining 90 percent are low‐skilled labor. This indicates that the majority of workers in the environment‐related labor market are low‐skilled labor. On the one hand, this job structure implies that the government can use environment‐related job labor policy as a temporary policy which is against unemployment and income inequality during recession periods. Also, this structure indicates that the environmental industry in Korea needs to find out or develop the market which can enlarge the high‐technology demand. By doing that, the high‐skilled labor in the environmental industry can be a major labor force in the environment‐related labor market. And the low‐skill dominant structure of environment job can be improved.
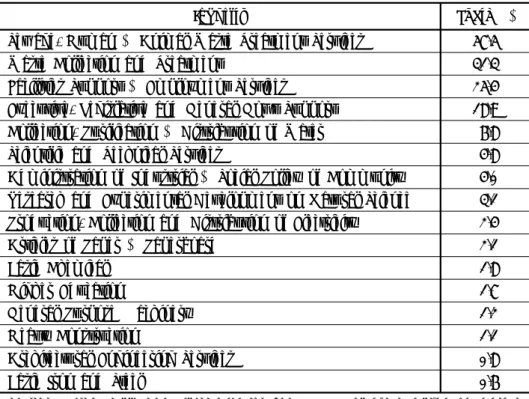
Table 2 shows the share of environment‐related workers among the total workers by industry. Table 2 lists the first fifteen industries that have high value in environment‐related worker share. The share of environment‐related workers in the public and private service sector is higher than that in manufacture. Among service sectors, the share of environment‐related workers is the highest in the waste‐related service sector.
Table 2. The Share of Environment-related Workers by Industry (2003)
Industry Share(%)
Sewage, Human & Animal Waste Treatment Services 57.5
Waste Collection and Treatment 31.3
Facilities Support & Employment Services 25.4 Executive, Legislative and General Govʹt Support 18.9 Collection, Purification & Distribution of Water 6.8
Scientific and Technical Services 4.8
Administration of Industrial & Social Policy of Community 4.0 Research and Experimental Development on Natural Science 3.1 Production, Collection and Distribution of Electricity 2.4
Articles of Paper & Paperboard 2.1
Basic Chemical 1.8
Higher Education 1.7
General Purpose Machinery 1.2
Heavy Construction 1.1
Architectural Engineering Services 0.8
Basic Iron and Steel 0.6
Sources : Korea Employment Information Services. 2004. Occupational Employment Statistics. Note : The share of environment‐related workers is calculated by the number of environment‐related worker in a specific industry divided by the total number of workers in that industry.
To see the distribution of environment‐related workers by industry in detail, letʹs categorize the industry in Table 2 as follows;
ʺDirect environmental servicesʺ includes ①
Sewage, human & animal waste treatment services Waste collection & disposal.
ʺPublic servicesʺ includes ②
Executive, legislative & general government services Administration of industrial & social policy of community Higher education
ʺPrivate technology servicesʺ includes ③
Research & experimental development on natural science & engineering Scientific & technical services
Architectural engineering services ʺPrivate business servicesʺ includes ④
Facilities support & employment services ʺSocial overhead capital relatedʺ includes ⑤
Collection, purification & distribution of water Production, collection & distribution of electricity Heavy construction
ʺ4 manufacturesʺ includes ⑥
Manufacture of articles of paper & paperboard Manufacture of basic iron & steel
Manufacture of general purpose machinery Manufacture of basic chemical
With this categorization, the distribution of low‐skilled and high‐skilled workers in each sector is shown as following Table 3.
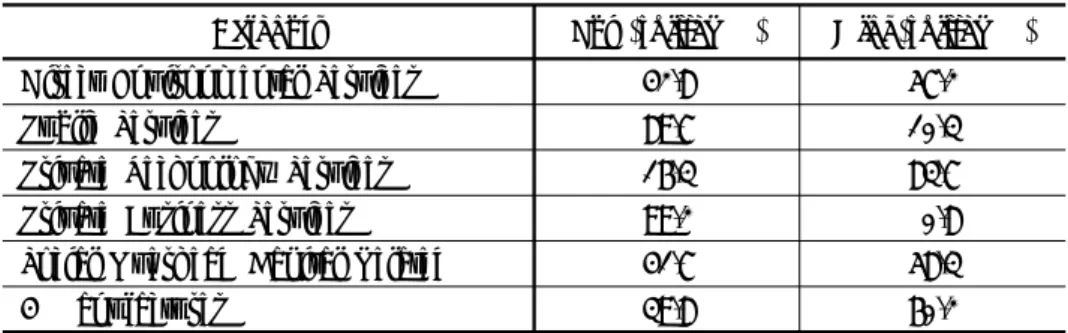
Table 3. Distribution of Worker Skill by Category (2003)
Category Low‐skilled(%) High‐skilled(%)
Direct Environmental Services 42.8 57.2
Public Services 89.7 10.3
Private Technology Services 16.3 83.7
Private Business Services 99.2 0.8
Social Overhead Capital Related 41.7 58.3
4 Manufactures 39.8 60.2
Sources : Korea Employment Information Services. 2004. Occupational Employment Statistics. Note : Low‐skilled is the share of low skilled workers among total environment‐ related workers in the category. High‐skilled is the share of high‐skilled workers among total environment‐related workers in the category.
In Table 3, low‐skilled workers are dominant in public and private business service sector. On the contrary, in private technology service category, the skilled workers are dominant. In other categories, the distribution is similar to each others; unskilled : skilled is 4 : 6. This distribution implies that the effects of government labor policy are different across the industry sectors. For example, if the government wants to improve unemployment in the short period and the policy is in favor of environmental protection, then it is helpful for the government to make the policy which targets public services and private business services sectors. But if the government focuses on the improvement in environment‐related labor structure, then it had better spend its money on environmental technology development or industrial restructuring for an environment‐friendly industry structure.
2. Jobs in the Environmental Industry
The statistics about the environmental industry is collected by the Ministry of Environment in Korea. These statistics cover the data of 2000, 2002 and 2004. First of all, to collect the data, the ministry follows the definition of environmental industry as the OECD(1999) defines;
The environmental goods and services industry consists of activities which produce goods and services to measure, prevent, limit, minimise or correct environmental damage to water, air and soil, as well as problems related to waste, noise and eco‐systems. This includes cleaner technologies, products and services that reduce environmental risk and minimise pollution and resource use.
Based on the definition of the above, the Ministry gathered data from around 23,000 companies categorized into 101 industries in 2004. In 2004, 15 percent of the environmental industry is engaged in the manufacturing sector, 5 percent in construction, and the remaining 80 percent of the companies are in the service sectors. The sales amount of the environmental industry in 2004 was 21,428 billion won. Forty percent of total sales came from the manufacturing sector, 17 percent from construction, and 43 percent from the service sector. The distribution of workers is provided in Table 4;
Table 4. Worker Distribution in the Environmental Industry
Manufacture Construction Service Total Total Employee (A) 97,380 135,384 139,378 372,142
Employee in
Environmental Sector (B) 57,103 22,544 88,314 167,931
B/A 58.6 16.7 63.4 45.1
Sources : Ministry of Environment. 2006. Report on Environmental Industry Statistics. Korea.
The total number of workers in the environmental industry is 372 thousand. Among them, 168 thousand workers work directly for the environmental sector. So, when we look at worker distribution, workers in the service industry are engaged in relatively more jobs directly related to the environment.
In this data set, the number of sampling companies in the environmental sector has increased from 15,801 companies in 2000 to 17,520 in 2002.
Therefore, it is hard to estimate the growth pattern of the environmental industry. But, fortunately, we can get information on average sales and employment.
Table 5. Average Sales and Employee in the Environmental Sector
Company Sales in Environment (million won) Workers in Environment (persons) Average Sales Average Employee
(A) (B) (C) (B/A) (C/A)
2000 15,801 11,536,227 111,468 730 7.1
2002 17,520 18,006,750 129,978 1,028 7.4
2004 23,035 21,427,465 167,961 930 7.3
Sources : Ministry of Environment. 2006. Report on Environmental Industry Statistics. Korea.
The number of companies in the sample has increased by 5.3 percent annually from 2000 to 2002 and 14.7 percent annually from 2002 to 2004. Even if the number of companies in the sample has increased from 2002 to 2004, the average sales per company and average employee per company have decreased. This is opposite to what the environmental industry experienced from 2000 to 2002. For this period, the average sales of company in the industry grew annually by 18.6 percent. The average number of workers grew annually by 2.5 percent from 2000 to 2002, and the average number of workers decreases by 0.9 percent annually from 2002 to 2004. Maybe this pattern is related to a particular reason such as hosting the World Cup in Korea in 2002. To manage the ambient air or water quality appropriately, the government could take more care of pollution than at any other time. This could boost the environmental industry growth during this period.
The change of average sales in the environmental sector and the average workers in environmental sector per company by industry are shown in following Table 6.
Table 6. Average Sales in the Environmental Sector per Company and Workers in the Environmental Sector per Company by Industry
(Unit: persons, million won)
2000 2002 2004
Workers Sales Workers Sales Workers Sales
Food, Beverage 18.4 3,916 24.2 5,849 7.4 636
Textiles 43.3 5,131 31.7 1,271 12.5 3,326
Pulp, Papers 65.0 50,850 126.0 50,061 7.2 1,549
Cokes, Oil Products 4.9 1,372 13.6 3,672 14.3 943
Chemical Products 10.3 2,248 11.8 4,021 13.8 865
Rubber, Plastic 12.0 1,012 14.5 2,429 18.3 1,230
Non Metal 31.7 9,014 39.0 9,292 36.6 2,479
Fabricated Metal 15.1 1,934 14.9 2,524 10.4 1,909 Others Machinery Equipment 15.7 2,030 14.7 2,258 13.3 2,833 Others Electronics 21.1 4,563 17.7 3,553 12.4 1,559 Precision Machinery 11.7 2,618 10.4 1,183 10.6 1,441
Autos, Trailer 15.5 4,976 32.3 4,242 39.4 38,688
Furniture and Others 9.0 1 1.0 ‐ 10.3 1,402
Recycled Materials 8.3 2,216 17.7 6,641 10.3 1,973 Water 25.0 4,870 25.3 6,261 38.6 7,937 Construction(General) 16.3 2,593 15.0 2,748 20.4 3,529 Construction(Special Trade) 8.6 871 13.4 3,383 5.3 690 Wholesale 3.2 255 3.3 356 3.3 434 Retail 1.9 44 1.8 55 1.7 54
Research & Development 14.0 213 22.3 980 23.0 2,179 Scientific Tech. Service 20.5 1,509 24.1 1,740 14.9 1,184
Business Service 44.2 772 34.0 638 15.9 1,723
Sewage Treatment etc 16.4 1,404 18.3 1,483 12.3 1,277
Clubs 32.8 40 72.0 39,600 6.1 125
Sources : Ministry of Environment. 2006. Report on Environmental Industry Statistics. Korea.
When we look at this table, we can also find the same patterns as following. In sales, the sales growth of industries which showed higher growth from
2000 to 2002 diminished rapidly or slowed from 2002 to 2004. In employee state, the employment growth shows similar pattern to that of sales, except some industries such as auto, textile, precision machinery and business services between 2002 and 2004. It looks like the environmental industry development has lost its momentum after 2002 except for some industries.
Chapter 3. Job Creation by the Environmental
Industry and Public Investment
1. Some Background of the Estimated Model
Ordinary labor demand function is derived from the profit maximization condition of firms. Short run labor demand is the function of real wage and production quantities. We estimate the traditional labor demand function (here, labor demand means the labor demand in the environmental sector of each environmental industry). So this is a partial equilibrium approach. Even though there are many constraints for us to interpret the estimation results, if we interpret the results carefully, that is, we keep in mind that the estimation is based on the partial analysis, we can extract meaningful information from the estimation.
Before we explain the estimation methods and results, we want to notify people of data shortages; not only the number of data points but also data reliability. Currently, the Korean Ministry of Environment produces environmental industry statistics biannually. As we mentioned before, since the data collection is in the early stage, there are not enough data points, and it takes some time for these data to be reliable. But this data set is a unique official data of the environmental industry in Korea. So we want to let the readers know that the data set which we use here is officially the best data set about environment occupation distribution and environmental industry.
Furthermore, there is no exact information of wages and price levels in each environmental industry sector in the data. To overcome the lack of information in the data, we use some proxy variables for wage and price levels for each environmental industry. Since the environmental industry statistics is based on standard industry classification and many of meta data in environmental industry statistics share with the sample of industry statistics which is announced in the Korea National Statistics Office, wages
and price levels of the same industry sector to the environmental industry sector can be useful proxies for wages and price levels.
We include environment sales information instead of production quantity of environmental goods in the estimation. It is very difficult to define the production quantity in service sector of the environmental industry. To keep the consistency, we decide to use proxy variables which can be commonly used over environmental industry to indicate the production level for controlling the marginal labor productivity. So the real sales value is used in the estimation.
We adopt panel data technique as an estimation technique. Because there is not enough time series of data for using time series analysis and we do not have enough data points for cross section analysis (in the data, the environmental industry is classified with only 24 industry categories), there are no appropriate approaches to analyze by using estimation. Fortunately, however, the Ministry of Environment started to collect the data for 2000, 2002 and 2004. With these three years of data, we can estimate the labor demand function with panel data analysis. So each industry category is regarded as one subject and each has three time series data point. Sometimes, there are missing variables. In this case, we do not include that industry in the estimation sample.
Since we do not have enough data set in time series and cross section points of view, it is difficult to use instrumental variable methods either. Therefore, in the estimation of labor demand, we estimate the model in several ways. Generally, we follow the widely accepted estimation methods with established statistical package, STATA. These are panel generalized least square, panel generalized least square with heteroskedasticity, panel generalized least square with autocorrelation, fixed effect model, random effect model to check Hausman test, and random effect model with autocorrelation. Each model is tested with a misspecification test. Based on several estimation results, we decide the range of the labor demand elasticity with regard to environmental industry sales. Especially we use log form labor demand function, since it is easy to calculate the elasticity. So the basic structure of estimation equation is
, (1) where : environment‐related labor demand, : industry, : time,
: real wage, : real sales amount in the environmental sector, : real environment investment
With this equation, first, we estimate the model with different assumptions of each error structures. Since we do not have enough information in the view of time series and the number of variables itself, when we estimate the model, by changing the assumption of error structure, we hope that we can get more reliable estimation result. So the error structure assumptions in panel GLS estimation are as follows;
1)
… … ⋮ ⋮ ⋱ ⋮
…
in the case of homoskedasticity and no correlation between cross sectional part
2)
… … ⋮ ⋮ ⋱ ⋮
…
in the case of heteroskedasticity and no correlation between cross sectional part
3) … … ⋮ ⋮ ⋱ ⋮ …
in the case of heteroskedasticity and cross sectional correlation Lastly, we consider autocorrelation in panel error terms. But if the time series are short, normally we assume the common autocorrelation parameters. So we estimate the model with this common autocorrelation assumption. In this case, we can also estimate with the assumption of homoskedasticity case and the assumption of heteroskedasticity case apart.
And we will estimate the labor demand with fixed and random effect model. The basic model for this is the following;
, (2) where : environment‐related labor demand, : industry, : time,
: real wage, : real sales amount in the environmental sector, : real environment investment, : industry specific errors
After we estimate the model with random effect we will test the Hausman test to decide whether we use the random effect model or not.
Finally, each data is the average data as we mentioned above. Since the number of companies in the sample has changed a lot during those periods, there is inconsistency when we use aggregate data in this case. Therefore, we calculate the sales in environmental sector per company, workers hired in the environmental sector per company, and wages per company. After we estimate the elasticity at the average level, we calculate the direct employment demanded for the environmental sector. By using the worker distribution structure between the environmental sector and non‐ environmental sector in the environmental industry statistics in 2004, we estimate the total number of labor demand in the environmental industry.
2. Job Creation in the Environmental Industry
The number of industries that are used in the estimation is 16. They are (1) manufacture of food products and beverage (2) manufacture of textiles except sewn wearing apparel (3) manufacture of chemicals and chemical products (4) manufacture of rubber and plastic products (5) manufacture of non‐metallic mineral products (6) manufacture of fabricated metal products except machinery and furniture (7) manufacture of other machinery and equipment (8) manufacture of other electrical machinery and apparatus (9) manufacture of medical precision and optical instruments (10) manufacture
of motor vehicles and trailers (11) general construction (12) special trade construction (13) research and development (14) professional, scientific and technical services (15) business support services (16) sewage and defuse disposal, sanitation and similar activities.
The total sales in the environmental sector of these 16 industries make up 55 percent of total sales in the environmental sector in environmental industry statistics. To estimate the panel data, the industry which has missing values within sample periods are excluded from the estimation sample to maintain the balance of panel data set. The following table shows the estimation results.
Table 7. Estimation Results of Environment-related Labor Demand
in Environmental Industry with Panel Generalized Least Square Method
Error Type Homo Hetero Hetero Homo Hetero
Relation Type ‐ ‐ Correlated Autocorrelated Autocorrelated Sales in Environment 0.279 0.193 0.019 0.242 0.212 (3.58) (3.75) (0.11) (3.67) (4.09) Wage ‐0.787 ‐0.676 ‐0.545 ‐0.669 ‐0.637 (2.50) (4.67) (0.98) (1.88) (4.36) Environment Investment 0.053 0.133 0.156 0.023 0.077 (0.95) (2.74) (0.77) (0.43) (1.64) Constant 0.729 0.933 2.685 1.132 1.034 (1.45) (2.30) (2.68) (2.39) (2.96) Test Statistics Log‐likelihood ‐23.650 ‐5.186 717.274 ‐15.535 1.239 Wald‐ Statistics 18.81 43.16 8.01 16.74 46.79 (0.0003) (0.0000) (0.0458) (0.0008) (0.0000) Note : 1) Relation type means the relationship in panel
2) The numbers in parenthesis are z‐value. Only, the numbers in parenthesis of Wald‐statistics show p‐value.
3) Every independent variables is real values.
When you look at Table 7, the mis‐specification test statistics improve with heteroskedasticity assumption (in view of log‐likelihood and Wald test
statistics). Therefore, to estimate the labor demand model in the environmental industry, it is reasonable to assume heteroskedasticity3). But when we assume heteroskedasticity and correlation among industries together, we can observe mis‐specified form of model. The main reason for this is that we have un‐balanced panel data in view of time span and the number of industries. In that case, normally, the assumption of heteroskedasticity and correlation among groups is not appropriate for the estimation. So we rule out this assumption from estimation results.
So when we consider heteroskedasticity and heteroskedasticity with AR(1) assumption, first, we can estimate each sign of coefficient as we expect. In the case of sales, when the sales increase, it affects the labor demand positively and it is significant. Wage affects the labor demand significantly and negatively as the classic labor economic theory predicts. The increase of environment investment also raises the labor demand but the significance of this coefficient is not decisive.
Another estimating method is random/fixed effect estimation. Since we can observe heteroskedasticity among industries, it is good for us to use these methods for the labor demand estimation again. First, as we mentioned, the model with random effect method was estimated. After that, we do Hausman test. Test results show that we accept the null hypothesis, ʺdifference in coefficients of random and fixed effect models is not systematicʺ. That is, since the test statistic (3) = 3.05 and p‐value is 0.3832, we accept null. Therefore, random effect model estimation is reliable. Furthermore, we estimate the random effect model with AR(1) process, too. The results of estimation are as follows;
3) The estimated variance of each model except assumption of heteroskedasticity and
correlations among groups are reported in the appendix. Since we use industry‐based data, it is highly probable that we can observe heteroskedasticity.
Table 8. Estimation Results of Environment-elated Labor Demand in Environmental Industry with Random Effect Model
Random Effect Random Effect with AR(1) Sales in Environment 0.259 0.255 (3.42) (3.45) Wage ‐0.660 ‐0.676 (1.86) (1.91) Environment Investment ‐0.004 0.018 (0.07) (0.32) Constant 1.111 1.075 (2.13) (2.10) Test Statistics Overall R2 0.27 0.27 Wald‐ Statistics (3) = 14.91 (4) = 15.29 (0.0019) (0.0041)
Note : 1) The numbers in parenthesis are t‐value. Only, numbers in parenthesis of F‐statistics show p‐value.
2) Every independent variables is real values.
Generally, random effect estimation is reasonable in the estimation of labor demand in the environmental industry. When we look at ‐statistics, we
can accept the argument that the model is well‐specified. And the sign of variables which are significant is what the theory predicts. When we compare these estimation results with those of panel generalized least squares, we realize that the estimated coefficient in random effect model relatively overestimates the effect of independent variables on labor demand. So we regard the estimation results in the random effect model as maximum points and the results of the panel generalized least square model with the assumption of heteroskedasticity as minimum estimation value.
Based on former estimation results, we can infer the elasticity of sales on labor demand in the environmental industry easily, because we estimate the model of log linear function. On the average, each industry is estimated at the elasticity of sales on labor demand as from 0.193 to 0.259. So, when we
define 0.193 as minimum elasticity estimator and 0.259 as maximum value for that, it means that at 1 percent change of sales on the average, it gives 0.193 percent to 0.259 percent increase of labor demand in each environmental industry. With the sample data for estimation, we can calculate the amount of 1 percent change in sales at each industry level from average sales and the following labor demand increase range at each industry level from average workers by industry in 2004. And then we adjust the number with basic monetary unit, 1 billion won, to compare the results with each other4). Finally when we calculate the increase of labor demand in the non‐environmental sector, we assume that the structure of workers between the environment and non‐ environmental sector is that same to that of 2004.
4) Actually, this calculation method can make bias in estimation results. But to compare
the results with each other sector and the induced employment coefficient in I/O table analysis, it is easiest way to get information.
Table 9. Labor Demand Increase according to Sales Increase in the Environmental Sector
(Unit : bil. won, persons)
Total Environment Non‐
Environment
Min Max Min Max Min Max
Food, Beverage 5.1 6.8 2.6 3.5 2.5 3.4 Textiles 6.8 9.2 0.7 1.0 6.1 8.2 Chemical Products 4.4 5.8 3.7 5.0 0.6 0.9 Rubber, Plastic 3.7 4.9 3.1 4.2 0.6 0.8 Non Metal 4.5 6.1 3.2 4.2 1.4 1.8 Fabricated Metal 1.8 2.4 1.2 1.7 0.5 0.7
Others Machinery Equip 4.0 5.4 0.8 1.0 3.3 4.4
Others Electronics 2.7 3.6 1.7 2.3 1.0 1.3
Precision Machinery 2.5 3.4 1.4 1.9 1.1 1.5
Autos, Trailer 0.6 0.8 0.2 0.3 0.4 0.5
Construction(General) 8.4 11.3 1.4 1.9 7.0 9.5
Construction(Special) 8.5 11.4 1.9 2.5 6.6 8.8
Research & Development 2.4 3.3 2.4 3.3 0.0 0.0 Scientific Tech. Service 2.9 3.9 2.9 3.9 0.0 0.0
Business Service 6.5 8.8 1.9 2.5 4.6 6.2
Sewage Treatment etc 2.8 3.8 2.0 2.7 0.8 1.1
Average 4.2 5.7 1.9 2.6 2.3 3.1
Note: 1) environmental industry is classified into smaller industry sectors in this table. 2) The labor demand is increased when we assume that the sales in environmental
sector is increased by 1 billion won in each industry sector.
3) Minimum increase in labor demand of environmental sector is calculated based on the elasticity of 0.193 and Maximum increase is based on the elasticity of 0.259.
One billion won increase of sales in the environmental sector of 16 industries can affect labor demand increase differently. When we array labor demand increase by the amount, the top industries which can affect labor demand in large scale are the construction sector, textile sector, and business
service sector in the environmental industry. Food and Beverage, chemical products and non‐metal sectors are next in labor demand increase.
Even though there are many differences in estimation process and collecting data method, to check the job creation ability of the environmental industry, it is useful to compare these numbers with the induced employment coefficient of several industries which are derived in Input‐Output table analysis. The following Table 10 shows the induced employment coefficient of 2000 I/O table of some industries. Especially, to decide the proper job creation ability status of the environmental industry in labor demand, we select some manufacturing industries that are regarded as major industries in Korea.